JHEP04(2015)124
Published for SISSA by SpringerReceived: February 20, 2015 Revised: March 26, 2015 Accepted: March 27, 2015 Published: April 22, 2015
Search for physics beyond the standard model in
events with two leptons, jets, and missing transverse
momentum in pp collisions at
√
s = 8 TeV
The CMS collaboration
E-mail: [email protected]
Abstract: A search is presented for physics beyond the standard model in final states with two opposite-sign same-flavor leptons, jets, and missing transverse momentum. The data sample corresponds to an integrated luminosity of 19.4 fb−1 of proton-proton collisions at√s = 8 TeV collected with the CMS detector at the CERN LHC in 2012. The analysis focuses on searches for a kinematic edge in the invariant mass distribution of the opposite-sign same-flavor lepton pair and for final states with an on-shell Z boson. The observations are consistent with expectations from standard model processes and are interpreted in terms of upper limits on the production of supersymmetric particles.
Keywords: Supersymmetry, Hadron-Hadron Scattering
JHEP04(2015)124
Contents
1 Introduction 1
2 Detector and trigger 2
3 Signal scenarios 3
4 Event selection, reconstruction, and search strategy 4
5 Background estimates 7
5.1 Flavor-symmetric backgrounds 7
5.2 SM Drell-Yan background 9
6 Kinematic fit 10
7 Results 11
8 Uncertainties in signal modeling 16
9 Interpretation 17
10 Summary 18
The CMS collaboration 23
1 Introduction
This paper presents a search for physics beyond the standard model (SM) in events con-taining a pair of opposite-sign same-flavor (SF) electrons or muons, jets, and an imbalance in transverse momentum. The analysis is based on a sample of proton-proton (pp) colli-sions collected at a center-of-mass energy of 8 TeV with the CMS detector [1] at the CERN LHC in 2012 and corresponds to an integrated luminosity of 19.4 fb−1.
The invariant mass distribution of the two-lepton system can exhibit an excess that increases with the dilepton mass, followed by a sharp decrease and thus an “edge”, if the two leptons originate from the decay of an on-shell heavy neutral particle. This kind of signature is fairly generic for models of physics beyond the SM (BSM), assumes an isotropic decay, and is purely kinematic in origin. In models of supersymmetry (SUSY) [2], an edge with a triangular shape is expected in the cascade process χ!0
2 → ℓ!ℓ → !χ01ℓ+ℓ− [3], where
!
χ02 and χ!01 are respectively the next-to-lightest and lightest neutralino, with !ℓ a selectron or smuon, the SUSY partners of an electron or muon. Alternatively, the χ!02 can undergo a three-body decay toχ!0
JHEP04(2015)124
mass spectrum but with a more rounded shape. Another possibility is the decay of aχ!0 2 to
an on-shell Z boson, χ!02 → !χ01Z. This latter process does not produce an edge but rather a dilepton mass peak near 91 GeV. These processes arise as a consequence of the gauge-coupling structure of SUSY and are a characteristic feature of SUSY decay chains. Their relative importance depends on the SUSY mass hierarchy and is thus model dependent.
This search is therefore motivated by the possible existence of the fairly generic signal shape of an edge, or of a peak at the Z boson mass, that would be visible in the invariant mass distribution of the two leptons. The position of the edge would give an indication of the unknown BSM mass hierarchy. The dilepton invariant mass provides a search variable that is unaffected by uncertainties in the jet energy scale and resolution, and the search for an edge is therefore complementary to searches based solely on hadronic quantities.
The CMS Collaboration previously presented two searches for BSM physics based on events with an opposite-sign SF lepton pair: a search for an edge in the dilepton mass spectrum outside the Z boson mass region [4], and a search for events containing on-shell Z bosons [5]. Both these studies were conducted using the 7 TeV CMS data sample collected in 2011. The present study updates and combines these two analyses, using the 8 TeV data sample. Searches for SUSY in opposite-sign dilepton final states, but targeting different production and/or decay mechanisms, are presented by the ATLAS Collaboration in refs. [6,7].
A brief description of the CMS detector is given in section 2. Signal models studied in this analysis are described in section 3. Section 4 outlines the event selection and simulation. The background estimation methods are presented in section 5. A fitting procedure used to search for an edge is described in section 6. The results of the search are presented in section 7. Systematic uncertainties associated with the signal modeling are discussed in section8and the results of the search are interpreted in the context of the signal models in section9. A summary is presented in section 10.
2 Detector and trigger
The central feature of the CMS detector is a superconducting solenoid of 6 m internal diam-eter that produces an axial magnetic field of 3.8 T. A silicon pixel and strip tracker, a lead tungstate crystal electromagnetic calorimeter, and a brass/plastic-scintillator hadron cal-orimeter are positioned within the field volume. Iron and quartz-fiber hadron calcal-orimeters are located outside the magnetic field volume, within each endcap region of the detector. Muons are measured using gas-ionization detectors embedded in the steel flux-return yoke outside of the solenoid. A detailed description of the CMS detector, its coordinate system, and the main kinematic variables used in the analysis can be found in ref. [1].
Events must satisfy at least one of a set of ee, µµ, and eµ triggers. The ee and µµ trig-gers collect signal candidate data while the eµ trigger collects data used in the background-determination procedure, as described below. These triggers require at least one electron or muon with transverse momentum pT > 17 GeV, and another with pT > 8 GeV. Their
efficiencies after event selection (>90%) are measured in data and are accounted for in the analysis. The efficiencies of the ee, µµ, and eµ triggers differ by only a few percent in the kinematic range of this search.
JHEP04(2015)124
3 Signal scenarios
Two classes of signal events are considered, as explained below. Both classes are imple-mented in the framework of simplified models [8], in which only the targeted production and decay schemes are examined, with all non-participating BSM particles assumed to be too heavy to be relevant.
The first class of signal events targets the production of an edge in the invariant mass spectrum of opposite-sign SF lepton pairs, as expected from the correlated production of these leptons in cascade decays. This class of scenarios is based on the production of a bottom squark-antisquark pair. Each bottom squark !b decays to a bottom quark b and theχ!02 neutralino. Two specific possibilities are considered. In the first scenario (figure 1 left), the χ!0
2 decays to an off-shell Z boson Z∗ and the χ!01 neutralino, where the χ!01 is a
stable, weakly interacting, lightest SUSY particle (LSP). The Z∗ boson decays according to its SM branching fractions, sometimes producing a charged lepton pair ℓ+ℓ− (ℓ = e, µ). The mass difference between the χ!0
2 and χ!01 , which determines the location of the edge,
is fixed to 70 GeV. This scenario is referred to as the “fixed-edge” scenario. In the second scenario (figure 1 right), the χ!02 decays to an on- or off-shell Z boson and the χ!01 LSP or according to χ!0
2 → ℓ!ℓ, with a 50% probability for each decay. The slepton !ℓ, i.e., the
SUSY partner of the lepton, then decays according to !ℓ→ ℓ!χ01. The considered sleptons are mass-degenerate selectrons and smuons. The mass of the slepton is chosen to lie halfway between the masses of the two neutralinos: m!ℓ= mχ!0
1+ 0.5(mχ!02− mχ!01). The mass of the !
χ01 is set to 100 GeV, with the position of the edge a free parameter in a scan of the mass spectrum. This scenario is referred to as the “slepton-edge” scenario.
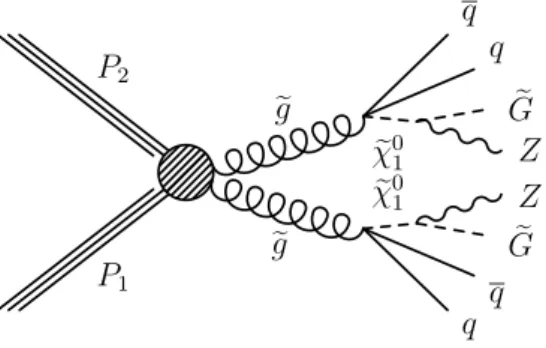
The second class of signal events targets the production of an opposite-sign SF lepton pair from the decay of an on-shell Z boson. This class of scenarios, illustrated in figure2, is based on gluino pair production in the context of gauge mediated supersymmetry breaking (GMSB) models [9–11]. Each gluino decays to a quark-antiquark pair and the χ!01 neu-tralino. The χ!01 decays to an on-shell Z boson and a stable, massless, weakly interacting gravitino LSP. We refer to this scenario as the “GMSB” scenario.
The production of squark and gluino pairs is simulated with the MadGraph 5.1.3.30 [12, 13] Monte Carlo (MC) leading-order event generator, including up to two additional partons at the matrix element level. The decays of the squarks, gluinos, and other particles are simulated with the pythia 6.4.22 [14] event generator. The MadGraph events are subsequently processed with the pythia program to generate parton showers and account for hadronization. The decay of the Z boson is handled in pythia. In all the aforementioned scenarios (fixed-edge, slepton-edge, GMSB), the Z boson decays according to its SM branching fractions. To reduce computational requirements, the detector response is simulated using the CMS fast simulation [15]. Differences in the lepton reconstruction and identification efficiencies between the fast and a “full” simulation, where the full simu-lation is based on processing through the Geant4 [16] programs, are corrected using scale factors. The expected signal event rates are normalized to cross sections calculated at the next-to-leading order (NLO) in the strong coupling constant, including the resummation of soft gluon emission at next-to-leading-logarithmic (NLO+NLL) accuracy [17–22].
JHEP04(2015)124
P1 P2 ! b ! b∗ ! χ0 2 ! χ0 2 Z∗ Z∗ b f f ! χ0 1 ! χ0 1 ℓ− ℓ+ b P1 P2 ! b !b∗ ! χ0 2 ! χ0 2 Z(∗) ! l b f f ! χ0 1 ! χ0 1 ℓ− ℓ+ bFigure 1. Event diagrams for the (left) “fixed-edge”, and (right) “slepton-edge” scenarios, with !b a bottom squark, !χ0
2 the second lightest neutralino, χ!01 a massive neutralino LSP, and !ℓ an electron- or muon-type slepton. For the slepton-edge scenario, the Z boson can be either on- or off-shell, while for the fixed-edge scenario it is off-shell.
P1 P2 ! g ! g ! χ0 1 ! χ0 1 q q ! G Z Z ! G q q
Figure 2. Event diagram for the “GMSB” scenario, with!g a gluino, !χ0
1 the lightest neutralino, and !G a massless gravitino LSP.
4 Event selection, reconstruction, and search strategy
We select events with an oppositely charged lepton pair (e+e−, e±µ∓, or µ+µ−). The
leptons are required to have pT> 20 GeV and |η| < 2.4, where η is the pseudorapidity [1].
In events with more than two selected leptons, we choose the two oppositely charged leptons with highest pT. The background estimation techniques employed in this analysis rely, in
part, on a symmetry between lepton pairs with the same flavor compared to those with opposite flavor (OF), where OF refers to e±µ∓combinations. It is therefore desirable that the reconstruction efficiencies of electrons [23] and muons [24] be as similar as possible. For this reason, we exclude leptons in the intervals 1.4 <|η| < 1.6 between the barrel and endcap regions of the detector [1], where the electron and muon reconstruction efficiencies differ significantly. For the SF signal candidate sample, only events with an e+e−or µ+µ− pair are used.
Leptons produced in the decays of low-mass particles, such as hadrons containing b and c quarks, almost always lie in or near jets. The background from these low-mass processes can be suppressed by requiring the leptons to be isolated in space from other particles. A cone of radius ∆R≡√(∆η)2+ (∆φ)2 = 0.3 is constructed around the lepton momentum direction, where φ is the azimuthal angle. The lepton relative isolation is then quantified
JHEP04(2015)124
by the scalar pT sum of all particle candidates within this cone, excluding the lepton,
divided by the lepton pT. The resulting quantity is required to be less than 0.15. The sum
includes a correction to the total energy to account for contributions from extraneous pp interactions within the same or a nearby bunch crossing (pileup). For electrons, the pileup correction is based on the effective area method [25], while for muons it is based on the number of charged hadrons not associated with the primary vertex. The performance of the electron and muon isolation criteria is discussed in refs. [23,24].
The primary vertex is taken to be the reconstructed vertex with the largest p2Tsum of associated tracks. Leptons with impact parameters larger than 0.2 mm in the transverse plane or 1 mm along the beam direction are rejected. As an additional requirement, the two selected leptons must be separated by ∆R > 0.3 to avoid systematic effects that arise for isolation requirements in very collinear topologies.
A particle-flow (PF) technique [26] is used to reconstruct jets and missing transverse momentum. All objects reconstructed with the PF algorithm serve as input for jet re-construction, based on the anti-kT clustering algorithm [27] with a distance parameter of
0.5, as implemented in the FastJet package [25,28]. We apply pT- and η-dependent
cor-rections to account for residual effects of nonuniform detector response. The contribution to the jet energy from pileup is estimated on an event-by-event basis using the jet area method described in ref. [29], and is subtracted from the overall jet pT. Jets are required
to have pT> 40 GeV,|η| < 3.0, and to be separated by ∆R > 0.4 from all selected leptons.
The missing transverse momentum ⃗pmissT is defined as the projection on the plane perpen-dicular to the beam axis of the negative vector sum of the momenta of all reconstructed PF objects in an event. The magnitude of ⃗pmiss
T is referred to as ETmiss. The ETmiss distributions
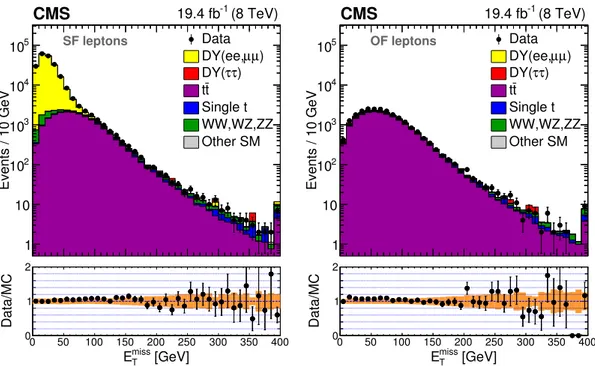
of events in the SF and OF samples for dilepton invariant mass mℓℓ > 20 GeV and number
of jets Njets ≥ 2 are shown in figure 3.
The event selection criteria are motivated by the expectation that BSM signal events, involving the production of new heavy particles, generally have larger jet multiplicity and ETmiss than background events, which primarily arise from top quark-antiquark (tt) and Drell-Yan (DY) processes. The large value of Emiss
T expected in signal events is due to the
weakly interacting LSP particles, which escape without detection.
In the search for an edge, we define two signal regions: either Njets ≥ 2 and ETmiss >
150 GeV, or Njets ≥ 3 and ETmiss> 100 GeV. For both regions, we separately consider events
in which both leptons satisfy |ηlep| < 1.4 (“central” signal region) and events in which at
least one lepton satisfies 1.6 < |ηlep| < 2.4 (“forward” signal region). The motivation
for the distinction between the central and forward regions is that for BSM production through the decay of heavy resonances, the final-state leptons and jets are expected to be more centrally distributed than for the SM backgrounds. Two methods are used to search for an edge signature. In the first method, a search for an edge is performed in the range 20 < mℓℓ< 300 GeV by fitting the signal and background hypotheses to data, as described
in section6. In the second method, based on a direct comparison of event counts, with no assumption about the shapes of the signal and background distributions, we select three regions, 20 < mℓℓ < 70 GeV, 81 < mℓℓ < 101 GeV, and mℓℓ > 120 GeV, denoted the
“low-mass”, “on-Z”, and “high-mass” regions, respectively. For this “counting experiment”, the integrated yield in each region is compared to the corresponding background prediction.
JHEP04(2015)124
[GeV] miss T E 0 50 100 150 200 250 300 350 400 Events / 10 GeV 1 10 2 10 3 10 4 10 5 10 Data ) µ µ DY(ee, ) τ τ DY( t t Single t WW,WZ,ZZ Other SM CMS 19.4 fb-1 (8 TeV) SF leptons [GeV] miss T E 0 50 100 150 200 250 300 350 400 Data/MC 0 1 2 [GeV] miss T E 0 50 100 150 200 250 300 350 400 Events / 10 GeV 1 10 2 10 3 10 4 10 5 10 Data ) µ µ DY(ee, ) τ τ DY( t t Single t WW,WZ,ZZ Other SM CMS 19.4 fb-1 (8 TeV) OF leptons [GeV] miss T E 0 50 100 150 200 250 300 350 400 Data/MC 0 1 2Figure 3. The Emiss
T distributions of events in the SF (left) and OF (right) samples for mℓℓ > 20 GeV and Njets≥ 2 in comparison with predictions for the SM background from the MC generators described in section 4. In the ratio panel below each plot, the error bars on the black points show the statistical uncertainties of the data and MC samples, while the shaded band indicates the MC statistical and systematic uncertainties added in quadrature. The rightmost bins contain the overflow.
In the search for BSM events with an on-shell Z boson, we perform a dedicated counting experiment in the region 81 < mℓℓ < 101 GeV, based on the distribution of ETmiss. For this
study, two inclusive bins in the number of jets are defined: Njets≥ 2 and Njets ≥ 3. Events
are examined in exclusive bins of ETmiss as described in section7.
While the main SM backgrounds are estimated using data control samples, simulated MC events are used to evaluate smaller sources of background. The simulation is also used to estimate uncertainties. Simulated samples of DY + jets, tt, W + jets, VV, and ttV (V = W, Z) events are generated with the MadGraph 5.1.3.30 event generator. The DY + jets sample considers events with dilepton invariant masses as low as 10 GeV, as well as decays to the τ τ channel. The matrix element calculation performed with MadGraph 5.1.3.30 is then interfaced to the pythia 6.4.22 program for the description of parton showering and hadronization, analogous to the procedure used for the signal samples. The detector response in these samples is simulated with a Geant4 model [16] of the CMS detector. The simulated events are reconstructed and analyzed with the same software used to process data. In the simulation, multiple pp interactions are superimposed on the hard collision, and the simulated samples are reweighted to reflect the beam conditions, taking into account the total inelastic pp cross section at the LHC. Corrections are applied to account for the differences between simulation and data in the trigger and reconstruc-tion efficiencies. The simulated sample yields are normalized to an integrated luminosity
JHEP04(2015)124
of 19.4 fb−1 using NLO inclusive cross sections, except for the DY + jets and W + jets samples, where next-to-next-to-leading order calculations [30] are used.
5 Background estimates
The principal SM backgrounds are divided into two categories. Backgrounds that pro-duce OF pairs (e+µ−, e−µ+) as often as SF pairs (e+e−, µ+µ−) are referred to as flavor-symmetric (FS) backgrounds. This category is dominated by tt processes. Drell-Yan events form the second principal background category. The FS background estimate accounts also for WW, Z/γ∗(→ ττ), and tW single-top quark production, as well as for backgrounds due to leptons from hadron decays and from hadrons misidentified as leptons. Contributions from tt + X, with X a W, Z, or Higgs boson, have been studied in the simulation and found to be negligible.
The missing transverse momentum in DY + jets events arises primarily from jet energy resolution and reconstruction effects. Contributions from SM WZ and ZZ processes, which might include genuine ETmiss, are incorporated into the DY + jets background estimates.
5.1 Flavor-symmetric backgrounds
The contribution of FS background events to the signal regions is determined using a control sample defined by OF events that satisfy the full event selection. The OF yields are multiplied by a factor RSF/OF to account for efficiency differences in the selection of
dilepton pairs in the SF and OF samples. Two methods are used to evaluate the RSF/OF factor, as explained below. We also determine corresponding factors Ree/OF and Rµµ/OF for the individual SF terms.
The first method, referred to as the “factorization” method, uses a data control sample to determine the SF-to-OF ratio of reconstruction efficiencies, and a second data control sample to determine the corresponding ratio of trigger efficiencies. The reconstruction efficiency ratio is evaluated using a large DY + jets data control sample selected by re-quiring 60 < mℓℓ < 120 GeV, Njets ≥ 2, and ETmiss < 50 GeV. The measured quantity is
rµe =
"
Nµµ/Nee, which represents a ratio of the muon-to-electron reconstruction efficiency
uncorrected for trigger efficiencies. The extrapolation of rµe into the central (forward)
sig-nal region is studied using data. A 10% (20%) systematic uncertainty is assigned to account for the observed dependencies. The ratio RT of the trigger efficiencies in SF and OF events
is determined using a data control sample selected with a trigger based on HT, which is the
scalar sum of jet pT values for jets with pT> 40 GeV. The sample is selected by requiring
HT > 200 GeV, mℓℓ > 20 GeV, and excluding events with Njets = 2 and ETmiss > 100 GeV.
The latter two requirements ensure that this control sample is uncorrelated with the con-trol sample used to determine the reconstruction efficiencies. A 5% uncertainty is assigned to the efficiency of each dilepton trigger (e+e−, µ+µ−, e±µ∓) to account for the observed dependence of these efficiencies on mℓℓ, ETmiss, and Njets. The full correction to the OF
event rate is RSF/OF= 0.5(rµe+ rµe−1)RT, with RT =
#
ϵtrigee ϵtrigµµ /ϵtrigeµ .
The second method, referred to as the “control-region” method, directly measures the RSF/OF factors from the ratio of the e+e−, µ+µ−, or combined SF yields with the OF
JHEP04(2015)124
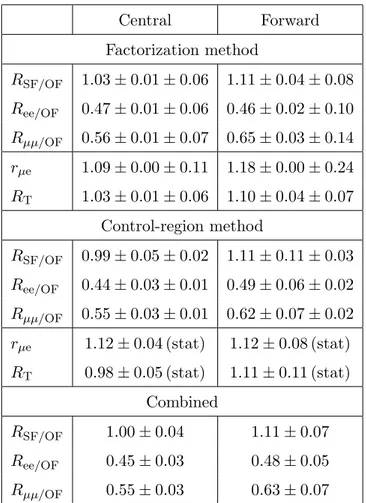
Central Forward Factorization method RSF/OF 1.03± 0.01 ± 0.06 1.11 ± 0.04 ± 0.08 Ree/OF 0.47± 0.01 ± 0.06 0.46 ± 0.02 ± 0.10 Rµµ/OF 0.56± 0.01 ± 0.07 0.65 ± 0.03 ± 0.14 rµe 1.09± 0.00 ± 0.11 1.18 ± 0.00 ± 0.24 RT 1.03± 0.01 ± 0.06 1.10 ± 0.04 ± 0.07 Control-region method RSF/OF 0.99± 0.05 ± 0.02 1.11 ± 0.11 ± 0.03 Ree/OF 0.44± 0.03 ± 0.01 0.49 ± 0.06 ± 0.02 Rµµ/OF 0.55± 0.03 ± 0.01 0.62 ± 0.07 ± 0.02rµe 1.12± 0.04 (stat) 1.12± 0.08 (stat)
RT 0.98± 0.05 (stat) 1.11± 0.11 (stat)
Combined
RSF/OF 1.00± 0.04 1.11± 0.07
Ree/OF 0.45± 0.03 0.48± 0.05
Rµµ/OF 0.55± 0.03 0.63± 0.07
Table 1. Results for RSF/OF in the signal regions. The results of the two methods are shown with statistical and systematic uncertainties, while the uncertainties for the combined values are a combination of the statistical and systematic terms. The values of rµeand RTlisted for the control-region method are not used directly in the analysis and are listed for purposes of comparison only.
yields in a tt-dominated control region with Njets ≥ 2, 100 < ETmiss < 150 GeV, and 20 <
mℓℓ < 70 GeV. Differences between the factors obtained in this control region and in the
signal regions are studied with the tt simulation. No difference is observed within the MC statistical uncertainty, which is used to define the corresponding systematic uncertainty. The size of this uncertainty is found to be 2% (3–4%) in the central (forward) region.
As the two methods rely on uncorrelated control samples, and the results agree within their uncertainties, the final results for RSF/OFare obtained by taking the weighted average of the results from the two methods, propagating the uncertainties. The results are shown in table 1. The FS background is then given by the number of events in the OF control samples multiplied by the corresponding RSF/OF factor. It is seen that the values of the RSF/OFratios are consistent with unity within the uncertainties. We find that the variation
of RSF/OFfor increasing mℓℓ, Njets, and ETmisslies within the assigned uncertainty. We thus
JHEP04(2015)124
5.2 SM Drell-Yan background
In the search for an edge based on a fit, the DY+jets background is determined as described in section6. For the counting experiment method, the DY background is determined using the jet-Z balance (JZB) and Emiss
T -template methods [5], as described in this section.
The JZB is a measure of the imbalance between the pT of the Z/γ∗ boson and the pT
of the recoiling hadronic system in DY + jets. The JZB is defined as the scalar difference between the pT of the Z/γ∗ and the net pT of the recoiling hadronic system. Standard
model DY + jets events equally populate negative and positive values of JZB, because non-zero JZB in these events arises from jet energy resolution effects, whereas in BSM and tt events, which contain genuine ETmiss, JZB can be very asymmetric towards positive values because of the correlated production of the lepton pair and the undetected particles. Events with negative values of JZB mainly arise from DY + jets processes, with a small contribution from tt production. The number of tt events that contribute negative JZB values is determined using the corresponding results for OF events. The tt contribution is then subtracted from the number of negative JZB events in the SF sample to estimate the DY+jets background. Uncertainties arising from imperfect knowledge of the RSF/OF factor (table1) when subtracting the tt contribution are propagated to the final DY + jets estimate. This method also accounts for processes with DY→ ℓ±ℓ∓+ X, where X denotes
other particles that might be present in the final state. The systematic uncertainty in the assumption that DY + jets events equally populate positive and negative values of JZB is evaluated in simulation by comparing the ETmiss distributions of events with JZB < 0 and >0. A systematic uncertainty of 20% is assigned to account for possible differences, dominated by the limited statistical precision of the MC sample.
The Emiss
T -template method relies on a data control sample consisting of events with
photons and jets to evaluate the DY + jets background in a high ETmiss signal region. For both DY + jets and γ + jets events, large values of Emiss
T arise from the mismeasurement
of jet pT values. The ETmiss distribution for DY + jets events can thus be evaluated using
γ + jets events selected with similar kinematic requirements. After selection, the Njets,
HT, and boson pT distributions of the γ + jets sample are reweighted to match those of
the DY + jets sample. The systematic uncertainty is determined in simulation by applying this reweighting to a γ + jets MC sample and comparing the reweighted ETmiss spectrum to that in a DY + jets MC sample. The uncertainty is taken as the larger of the difference between the two samples or the MC statistical uncertainty. The assigned uncertainty is 4% for EmissT < 60 GeV, 15% for 60 < ETmiss < 200 GeV, 34% for 200 < ETmiss < 300 GeV, and 100% for Emiss
T > 300 GeV. The uncertainty in the last two ETmiss bins is mostly due to the
MC statistical uncertainty. Uncertainties are also assigned to account for the difference in the number of pileup interactions in the triggered DY + jets and γ + jets events (1–3%, increasing with Emiss
T ) and the purity of the photon selection (1–5%, increasing with ETmiss).
With the Emiss
T -template method, the backgrounds from WZ, ZZ, and other rare SM
processes are estimated using simulation. An uncertainty of 50% is assigned to the WZ and ZZ backgrounds based on comparisons with data in orthogonal control samples selected by requiring Njets ≥ 2 and either exactly three leptons (WZ control sample) or exactly four
JHEP04(2015)124
leptons (ZZ control sample). For the other rare backgrounds, which include events with ttZ, ZZZ, ZZW, and ZWW production, an uncertainty of 50% is similarly assigned.
The two methods are used to estimate the yield of SM DY events in the on-Z region, with all other selection criteria the same as for signal events. Since the two methods use uncorrelated samples to describe the high-Emiss
T tail of SM DY + jets production, the
DY background estimate in the on-Z region is taken to be the weighted average of the two estimates. The individual results are consistent with the weighted average within their uncertainties.
This estimate of the DY+jets background is extrapolated outside on-Z region using the ratio Rout/in. It is measured in data as the event yield outside the on-Z region divided by
the yield in the on-Z region, for the dilepton invariant mass distribution in SF events with ETmiss < 50 GeV and Njets ≥ 2, after subtraction of the FS backgrounds. This distribution
is almost entirely composed of lepton pairs from DY processes, making it suitable for the determination of Rout/in. A systematic uncertainty of 25% is assigned to Rout/in to account for possible biases introduced by the different selection criteria used for the signal and control regions, and for differences in the value of Rout/in between electrons and muons.
6 Kinematic fit
The search for an edge based on the fit method is performed using a simultaneous extended unbinned maximum likelihood fit to the dilepton mass distributions of e+e−, µ+µ−, and e±µ∓ events. The likelihood model contains three components: (a) an FS background component, (b) a DY background component, and (c) a signal component.
The FS background is described using a model with three regions: a low-mass region modeling the rising distribution shaped by lepton acceptance requirements, a transition region, and a high-mass region in which the distribution falls exponentially. The probability density functions describing the three regions are:
PF S(mℓℓ) = ⎧ ⎪ ⎪ ⎪ ⎪ ⎨ ⎪ ⎪ ⎪ ⎪ ⎩ PF S,1(mℓℓ) = c1mαℓℓ if 20 GeV < mℓℓ< m(1)ℓℓ , PF S,2(mℓℓ) =(4i=1c2,imiℓℓ−1 if m (1) ℓℓ < mℓℓ< m(2)ℓℓ , PF S,3(mℓℓ) = c3e−βmℓℓ if m(2)ℓℓ < mℓℓ< 300 GeV, (6.1)
where m(1)ℓℓ and m(2)ℓℓ define the boundaries between the regions. Because of the requirement that the function and its derivative both be continuous, the FS model is left with five independent parameters plus the normalization.
The DY background is modeled with the sum of an exponential function, which de-scribes the low-mass rise, and a Breit-Wigner function with a mean and width set to the nominal Z boson values [31], which accounts for the on-Z lineshape. To account for the experimental resolution, the Breit-Wigner function is convolved with a double-sided
JHEP04(2015)124
Crystal-Ball [32] functionPDSCB(mℓℓ): PDSCB(mℓℓ) = ⎧ ⎪ ⎪ ⎪ ⎪ ⎪ ⎪ ⎪ ⎨ ⎪ ⎪ ⎪ ⎪ ⎪ ⎪ ⎪ ⎩ A1 ) B1− mll− µCB σCB *−n1 if mll−µCB σCB <−α1, exp ) −(mll− µCB) 2 2σ2 CB * if − α1< mllσ−µCBCB < α2, A2 ) B2+ mll− µCB σCB *−n2 if mll−µCB σCB > α2, (6.2) where Ai= ) ni |αi| *ni exp ) −|αi| 2 2 * and Bi = ni |αi|− |αi|. (6.3) The full model for the on-Z DY lineshape is thus:PDY, on-Z(mℓℓ) =
+
PDSCB(mℓℓ)PBW(mℓℓ− m′) dm′. (6.4)
The signal component is described by a triangular shape, convolved with a Gaussian distribution to account for the experimental resolution:
PS(mℓℓ) = 1 √ 2πσℓℓ + medgeℓℓ 0 y exp ) −(mℓℓ− y) 2 2σℓℓ2 * dy. (6.5)
As a preliminary step, a fit is performed separately for electrons and muons in the DY-enriched control region (the same control region as described for Rout/in in section5.2)
to determine the shape of backgrounds containing a Z boson. In systematic studies of the fit, the DY shape parameter that models the exponentially falling spectrum of the virtual photon is varied by ±25%. The total effect on the fitted signal yield is found to be neg-ligible. The parameters of the DY shape are then fixed and only the normalizations of these backgrounds are free parameters in the fit. The nominal fit is applied simultaneously in the signal region to the dilepton invariant mass distributions in the e+e−, µ+µ−, and e±µ∓samples. Therefore the model for the FS background is the same for the SF and OF events. The RSF/OF factors, in the central and forward regions, are treated as nuisance
parameters, parametrized by Gaussian distributions with a mean value and standard de-viation given by the values of RSF/OF and their uncertainties (table 1). The fit is carried out in the central and forward regions simultaneously, with the position of the edge as the only shared parameter. Therefore the signal model has three free parameters: the fitted signal yield in the central and forward regions separately, and the position of the edge.
7 Results
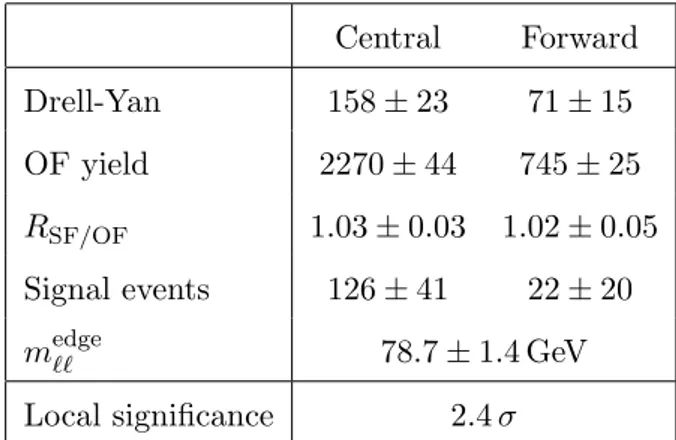
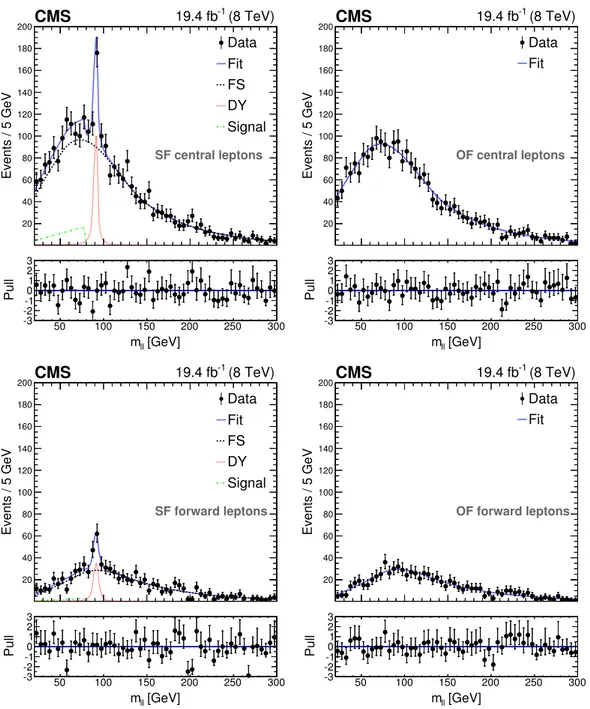
The dilepton mass distributions and the results of the fit in the central and forward signal regions are shown in figure 4. Table 2 presents a summary of the fit results. A signal yield of 126± 41 (22 ± 20) events is obtained when evaluating the signal hypothesis in the central (forward) region, with an edge located at 78.7± 1.4 GeV. The p-value, evaluated using −2 ln Q, is 0.009, where Q denotes the ratio of the fitted likelihood value for the
JHEP04(2015)124
Central Forward Drell-Yan 158± 23 71± 15 OF yield 2270± 44 745± 25 RSF/OF 1.03± 0.03 1.02 ± 0.05 Signal events 126± 41 22± 20 medgeℓℓ 78.7± 1.4 GeV Local significance 2.4 σTable 2. Results of the unbinned maximum likelihood fit for event yields in the signal regions. The quoted uncertainties are calculated using the MINOS [33] program and account for both statistical and systematic sources.
signal-plus-background hypothesis to the background-only hypothesis for the case where the edge position is fixed to the observed value. This p-value is interpreted as the one-sided tail probability of a Gaussian distribution and corresponds to an excess in the observed number of events compared to the SM background estimate of 2.4 standard deviations.
As cross-checks, we tested alternative shapes for the FS background, specifically the sum of three Gaussian distributions, and binned and smoothed histograms taken from the OF events. In all cases, the results were found to be consistent with the nominal results.
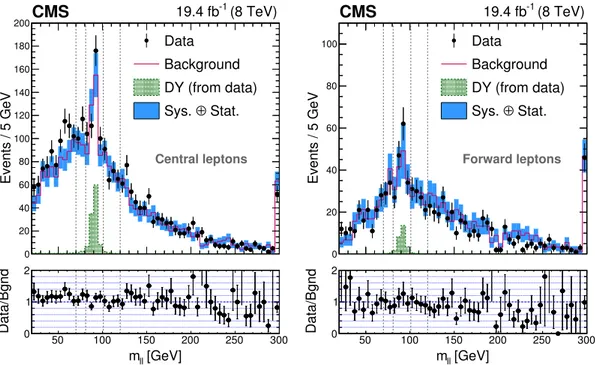
Besides the fit described in section 6, we perform a counting experiment in the mass windows 20 < mℓℓ< 70 GeV, 81 < mℓℓ < 101 GeV, and mℓℓ > 120 GeV, with no assumption
about a particular signal shape, as mentioned in section 4. Figure 5 shows the invariant mass distributions for the signal candidate sample and the estimated background. For the background prediction, the OF yield in the signal mass window is multiplied by the RSF/OF
factor, and the background prediction for backgrounds containing a Z boson in the on-Z region by the Rout/in factor, as described in sections 5.1and 5.2.
The results are summarized in table 3. The significance of the excess in the observed number of events with respect to the estimated number of SM background events is evalu-ated using a profile likelihood asymptotic approximation [34]. The local significance of the excess in the central low-mass region, where the largest deviation is found, is 2.6 standard deviations. Note that the signal regions were defined before the data sample was exam-ined, and that the low-mass region (20 < mℓℓ < 70 GeV) does not include events between
70 GeV and the best-fit value for the location of the edge (mℓℓ = 78.7 GeV). The flavor of
the ℓ+ℓ− pair was studied in the counting experiment. Within the statistical uncertainty
and accounting for differences in the reconstruction efficiencies, the electron and the muon channels are found to contribute evenly to the excess. Further studies of the excess in the low-mass region do not yield evidence for a neglected systematic term. The excess is observed predominantly in events with at least one identified bottom quark jet (b jet) and diminishes if a veto on the presence of a b jet is applied. To identify b jets, we use the CSV algorithm at the medium working point [35].
JHEP04(2015)124
[GeV] ll m 50 100 150 200 250 300 Events / 5 GeV 20 40 60 80 100 120 140 160 180 200 Data Fit FS DY Signal CMS 19.4 fb-1 (8 TeV) SF central leptons [GeV] ll m 50 100 150 200 250 300 Pull -3 -2-1 01 2 3 [GeV] ll m 50 100 150 200 250 300 Events / 5 GeV 20 40 60 80 100 120 140 160 180 200CMS (8 TeV) -1 19.4 fb OF central leptons Data Fit [GeV] ll m 50 100 150 200 250 300 Pull -3 -2-1 01 2 3 [GeV] ll m 50 100 150 200 250 300 Events / 5 GeV 20 40 60 80 100 120 140 160 180 200 Data Fit FS DY Signal CMS 19.4 fb-1 (8 TeV) SF forward leptons [GeV] ll m 50 100 150 200 250 300 Pull -3 -2-1 01 2 3 [GeV] ll m 50 100 150 200 250 300 Events / 5 GeV 20 40 60 80 100 120 140 160 180 200CMS (8 TeV) -1 19.4 fb OF forward leptons Data Fit [GeV] ll m 50 100 150 200 250 300 Pull -3 -2-1 01 2 3Figure 4. Fit results for the signal-plus-background hypothesis in comparison with the measured dilepton mass distributions, in the central (top) and forward (bottom) regions, projected on the same-flavor (left) and opposite-flavor (right) event samples. The combined fit shape is shown as a blue, solid line. The individual fit components are indicated by dashed lines. The flavor-symmetric (FS) background is displayed with a black dashed line. The Drell-Yan (DY) background is displayed with a red dashed line. The extracted signal component is displayed with a green dashed line. The lower plots show the pull distributions, defined as (Ndata− Nfit)/σdata.
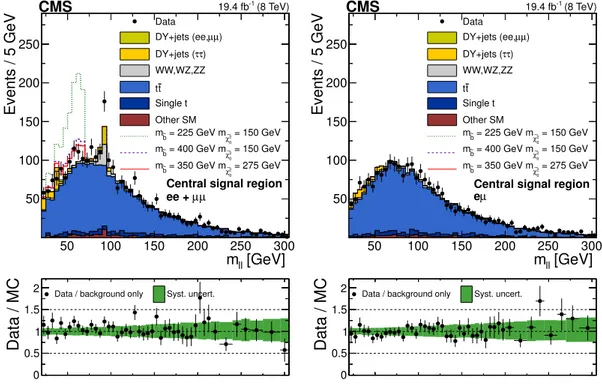
Figure6presents a comparison of the data and the SM simulation in the central region. Expectations for the fixed-edge bottom-squark pair-production scenario of figure 1 (left), with mass combinations (m!b,mχ!0
JHEP04(2015)124
[GeV] ll m 50 100 150 200 250 300 Events / 5 GeV 0 20 40 60 80 100 120 140 160 180 200CMS (8 TeV) -1 19.4 fb Central leptons Data Background DY (from data) Stat. ⊕ Sys. [GeV] ll m 50 100 150 200 250 300 Data/Bgnd 0 1 2 [GeV] ll m 50 100 150 200 250 300 Events / 5 GeV 0 20 40 60 80 100 CMS 19.4 fb-1 (8 TeV) Forward leptons Data Background DY (from data) Stat. ⊕ Sys. [GeV] ll m 50 100 150 200 250 300 Data/Bgnd 0 1 2Figure 5. Comparison between the observed and estimated SM background dilepton mass distri-butions in the (left) central and (right) forward regions, where the SM backgrounds are evaluated from control samples (see text) rather than from a fit. The rightmost bins contain the overflow. The vertical dashed lines denote the boundaries of the low-mass, on-Z, and high-mass regions. The lower plots show the ratio of the data to the predicted background. The error bars for both the main and lower plots include both statistical and systematic uncertainties.
Low-mass On-Z High-mass
Central Forward Central Forward Central Forward
Observed 860 163 487 170 818 368 Flavor-symmetric 722± 27 ± 29 155 ± 13 ± 10 355 ± 19 ± 14 131 ± 12 ± 8 768 ± 28 ± 31 430 ± 22 ± 27 Drell-Yan 8.2± 2.6 2.5± 1.0 116± 21 42± 9 2.5± 0.8 1.1± 0.4 Total estimated 730± 40 158± 16 471± 32 173± 17 771± 42 431± 35 Observed−estimated 130+48−49 5+20−20 16−38+37 −3+20−21 47+49−50 −62+37−39 Significance 2.6 σ 0.3 σ 0.4 σ <0.1 σ 0.9 σ <0.1 σ
Table 3. Results of the edge-search counting experiment for event yields in the signal regions. The statistical and systematic uncertainties are added in quadrature, except for the flavor-symmetric backgrounds. Low-mass refers to 20 < mℓℓ< 70 GeV, on-Z to 81 < mℓℓ< 101 GeV, and high-mass to mℓℓ> 120 GeV.
for the bottom squark and χ!02 , are also shown. The first scenario presents the illustration of a model that can easily be excluded, while the other two present examples of models that are consistent with our data.
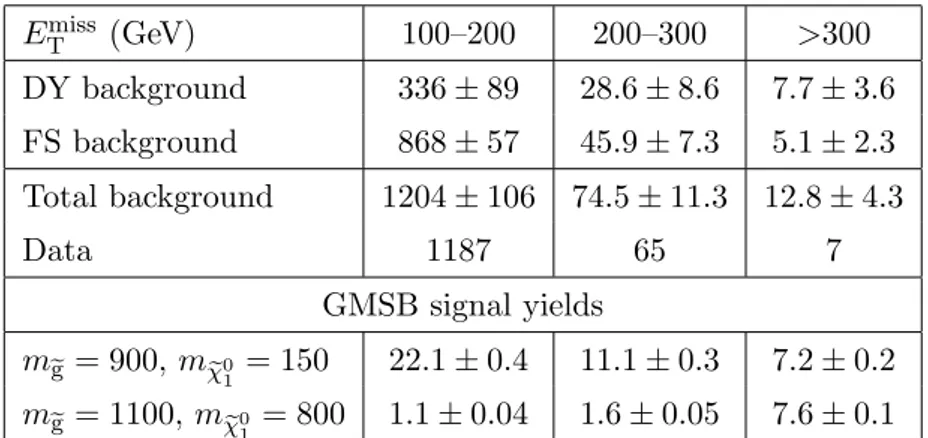
The results from the dedicated on-Z counting experiment mentioned in section 4 are presented in tables 4 and 5 for events with Njets ≥ 2 and Njets ≥ 3, respectively. The
corresponding ETmiss distributions are shown in figure 7. The data are seen to agree with the SM predictions across the full Emiss
JHEP04(2015)124
[GeV] ll m 50 100 150 200 250 300 Events / 5 GeV 50 100 150 200 250 Data ) µ µ DY+jets (ee, ) τ τ DY+jets ( WW,WZ,ZZ t t Single t Other SM = 150 GeV 2 0 χ∼ = 225 GeV m b ~ m = 150 GeV 2 0 χ∼ = 400 GeV m b ~ m = 275 GeV 2 0 χ∼ = 350 GeV m b ~ m µ µ ee +Central signal region
(8 TeV) -1 19.4 fb CMS Data / MC 0 0.5 1 1.5
2 Data / background only Syst. uncert.
[GeV] ll m 50 100 150 200 250 300 Events / 5 GeV 50 100 150 200 250 Data ) µ µ DY+jets (ee, ) τ τ DY+jets ( WW,WZ,ZZ t t Single t Other SM = 150 GeV 2 0 χ∼ = 225 GeV m b ~ m = 150 GeV 2 0 χ∼ = 400 GeV m b ~ m = 275 GeV 2 0 χ∼ = 350 GeV m b ~ m µ e
Central signal region
(8 TeV) -1 19.4 fb CMS Data / MC 0 0.5 1 1.5
2 Data / background only Syst. uncert.
Figure 6. Data compared with SM simulation for the SF (left) and OF (right) event samples in the central region. Example signal scenarios based on the pair production of bottom squarks are shown (see text). In the ratio panel below each plot, the error bars on the points show the statistical uncertainties of the data and MC samples, while the shaded band indicates the MC systematic uncertainty. Entries/10 GeV -1 10 1 10 2 10 3 10 4 10 5 10 Data Z background FS background )) 0 1 χ ∼ ), m( g ~ (m( (900, 150) GeV (1100, 800) GeV events µ µ ee + 2 ≥ jets n (8 TeV) -1 19.4 fb CMS [GeV] T miss E 0 50 100 150 200 250 300 350 Prediction Data 0 0.51 1.52 Entries/10 GeV -1 10 1 10 2 10 3 10 4 10 Data Z background FS background )) 0 1 χ ∼ ), m( g ~ (m( (900, 150) GeV (1100, 800) GeV events µ µ ee + 3 ≥ jets n (8 TeV) -1 19.4 fb CMS [GeV] T miss E 0 50 100 150 200 250 300 350 Prediction Data 0 0.51 1.52
Figure 7. The Emiss
T distributions for the on-Z signal regions with (left)≥2 jets and (right) ≥3 jets. The uncertainty band shown for the ratio includes both statistical and systematic uncertainties. Additionally, Emiss
T distributions are drawn for two choices of masses in the GMSB scenario. The rightmost bins contain the overflow.
JHEP04(2015)124
Emiss T (GeV) 100–200 200–300 >300 DY background 336± 89 28.6± 8.6 7.7± 3.6 FS background 868± 57 45.9± 7.3 5.1± 2.3 Total background 1204± 106 74.5 ± 11.3 12.8 ± 4.3 Data 1187 65 7 GMSB signal yields m!g= 900, mχ!0 1 = 150 22.1± 0.4 11.1± 0.3 7.2± 0.2 m!g= 1100, mχ!0 1 = 800 1.1± 0.04 1.6± 0.05 7.6± 0.1Table 4. Event yields in the signal region for the dedicated on-Z counting experiment with Njets≥ 2. Both statistical and systematic uncertainties are included for the background estimates. Signal yields are also shown for two choices of masses (in GeV) in the GMSB scenario (statistical uncertainties only). ETmiss (GeV) 100–200 200–300 >300 DY background 124± 33 12.7± 3.8 3.2 ± 1.8 FS background 354± 28 26.5± 5.4 2.0 ± 1.4 Total background 478± 43 39.2± 6.6 5.3 ± 2.3 Data 490 35 6 GMSB signal yields m!g = 900, mχ!0 1 = 150 22.0± 0.4 11.0 ± 0.3 7.1 ± 0.2 m!g = 1100, mχ!0 1 = 800 1.1± 0.04 1.5 ± 0.05 7.4 ± 0.1
Table 5. Event yields in the signal region for the dedicated on-Z counting experiment with Njets≥ 3. Both statistical and systematic uncertainties are included for the background estimates. Signal yields are also shown for two choices of masses (in GeV) in the GMSB (statistical uncertainties only).
8 Uncertainties in signal modeling
Systematic uncertainties associated with the estimation of the SM background are discussed in section 5. This section describes uncertainties in the signal modeling. The impact of the uncertainties on the considered signal models is shown in table 6.
The uncertainty related to the measurement of the integrated luminosity is 2.6% [36]. The uncertainty related to the parton distribution functions (PDF) is evaluated using the PDF4LHC recommendations [37–41] and amounts to 0–6% in the signal acceptance. Un-certainties in the modeling of the reconstruction, identification, and isolation efficiencies amount to 1% per lepton. The uncertainty of the corrections to account for lepton recon-struction differences between the fast and full simulations is 1% per lepton. The uncertainty in the trigger efficiencies is about 5%. Uncertainties in the muon momentum scale are neg-ligible, whereas for electrons the uncertainty in the energy scale is 0.6% (1.5%) in the barrel (endcap) region, leading to a 0–5% uncertainty in the signal yield. The uncertainty
JHEP04(2015)124
Uncertainty source Impact on signal yield [%]
Luminosity 2.6
PDFs on acceptance 0–6
Lepton identification/isolation 2
Fast simulation lepton identification/isolation 2
Dilepton trigger 5
Lepton energy scale 0–5
Emiss
T 0–8
Jet energy scale/resolution 0–8
ISR modeling 0–14
Additional interactions 1
Table 6. Summary of systematic uncertainties for the signal efficiency.
in the jet energy scale [42] varies between 0–8%. The uncertainty in the jet energy scale is propagated to evaluate the uncertainty associated with the ETmiss distribution, which is found to be 0–8%. The uncertainty associated with the modeling of initial-state radiation (ISR) [43] is 0–14%. The uncertainty in the correction to account for pileup in the simula-tion is evaluated by shifting the inelastic cross secsimula-tion by ±5%. The impact on the signal yield is found to be about 1%.
9 Interpretation
Based on the results of the counting experiments, exclusion limits are determined. The kinematic fit is not used for this purpose because it assumes a specific shape for the dilep-ton mass spectrum of signal events and so is more model dependent. The limits are calculated at 95% confidence level (CL) using the CLs criterion with the LHC-style test
statistic [34,44,45], taking into account the statistical and systematic uncertainties in the signal yields and the background predictions discussed in sections 8 and 5, respectively. The different systematic uncertainties are considered to be uncorrelated with each other, but fully correlated among the different signal regions. The systematic uncertainties are treated as nuisance parameters and are parametrized with log-normal distributions.
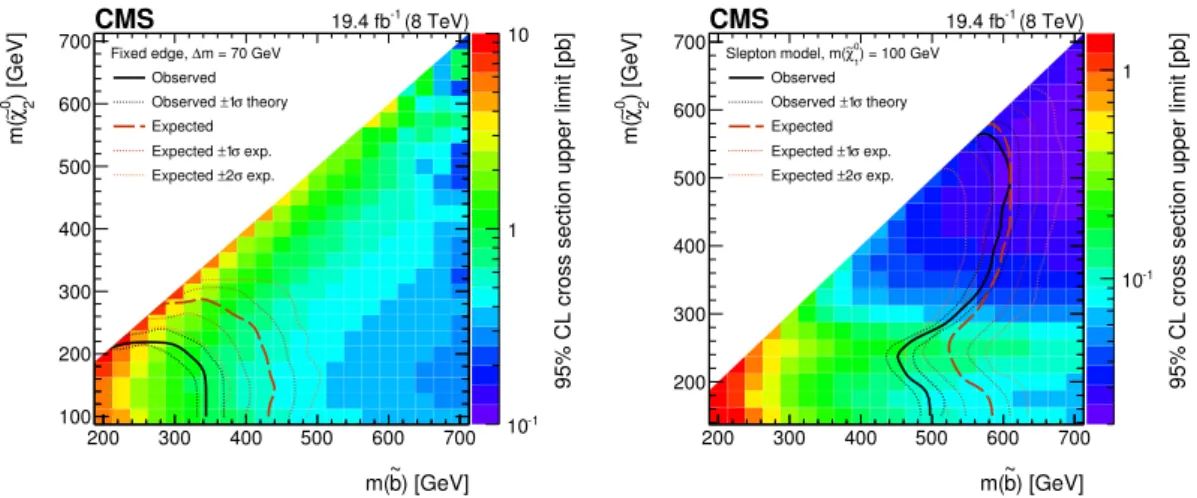
For the fixed- and slepton-edge scenarios all six signal regions (low-mass, on-Z, and high-mass, for the central and forward lepton regions) are combined. The resulting exclu-sion limits for these scenarios are shown in figure 8. The production of bottom squarks is considered, as the excess observed in data consists predominantly of events with at least one b jet. In the fixed-edge scenario, the mass difference between the χ!0
2 and χ!01
neu-tralinos is fixed to 70 GeV, resulting in an edge in the mℓℓ spectrum at this value. This
choice for the edge position is motivated by the observed excess in the low-mass region of the counting experiment. Bottom-squark masses between 200 and 350 GeV are probed,
JHEP04(2015)124
95% CL cross section upper limit [pb]
-1 10 1 10 ) [GeV] b ~ m( 200 300 400 500 600 700 ) [GeV] 0 2 χ ∼ m( 100 200 300 400 500 600 700 m = 70 GeV ∆ Fixed edge, Observed theory σ 1 ± Observed Expected exp. σ 1 ± Expected exp. σ 2 ± Expected (8 TeV) -1 19.4 fb CMS
95% CL cross section upper limit [pb]
-1 10 1 ) [GeV] b ~ m( 200 300 400 500 600 700 ) [GeV] 0 2 χ ∼ m( 200 300 400 500 600 700 0) = 100 GeV 1 χ ∼ Slepton model, m( Observed theory σ 1 ± Observed Expected exp. σ 1 ± Expected exp. σ 2 ± Expected (8 TeV) -1 19.4 fb CMS
Figure 8. Exclusion limits at 95% CL for the fixed- (left) and slepton-edge (right) scenarios in the m!b-mχ!0
2 plane. The color indicates the excluded cross section for each considered point in
parameter space. The intersections of the theoretical cross section with the expected and observed limits are indicated by the solid and hatched lines. The 1 standard deviation (σ) experimental and theoretical uncertainty contours are shown as dotted lines.
depending on the value of the χ!0
2 mass. In the slepton-edge scenario, the χ!01 mass is
set to 100 GeV, leaving the position of the edge as a free parameter that approximately corresponds to the mass difference between the χ!02 and χ!01. The branching fraction into dilepton final states is larger than in the fixed-edge scenario, and bottom-squark masses between 450 and 600 GeV are probed, again depending on the value of the χ!02 mass. The loss of sensitivity seen in figure8(right) forχ!02 masses around 250 GeV occurs because the peak of the triangular signal shape lies within, or close to, the gaps in acceptance between the low-mass and on-Z, or the on-Z and high-mass signal regions.
The results from the dedicated on-Z signal regions are used to place limits on the GMSB scenario. In this scenario, there are two free parameters: the masses of the gluino (m!g) and theχ!01(mχ!0
1). As signal events typically have large jet multiplicities, the exclusive bins requiring Njets ≥ 3 and ETmissin the ranges 100 < ETmiss < 200 GeV, 200 < ETmiss < 300 GeV,
and Emiss
T > 300 GeV are used. The results are shown in figure9in the plane of mχ!0
1 versus m!g. These results probe gluino masses up to about 900–1100 GeV depending on the χ!01 mass. The limit is least stringent when mχ!0
1 is close to the Z boson mass.
10 Summary
We have presented a search for physics beyond the standard model in the opposite-sign dilepton final state using a data sample of pp collisions collected at a center-of-mass energy of 8 TeV, corresponding to an integrated luminosity of 19.4 fb−1 , recorded with the CMS detector in 2012. Searches are performed for signals that either produce a kinematic edge, or a peak at the Z boson mass, in the dilepton invariant mass distribution. For regions dominated by flavor-symmetric backgrounds, i.e., backgrounds that produce opposite-flavor events (e+µ−, e−µ+) as often as same-flavor events (e+e−, µ+µ−), we achieve a precision of about 5% (10%) for the estimated number of standard model background events in the
JHEP04(2015)124
[pb] σ 9 5% C L u p p e r l imi t on -3 10 -2 10 -1 10 1 10gluino mass [GeV]
400 500 600 700 800 900 1000110012001300 mass [GeV] 0 1 χ 200 400 600 800 1000 1200 theory σ 1 ± Observed limit, exp. σ 1 ± Expected limit, 95% CL CLs NLO Exclusions G~ Z → 0 1 χ , 0 1 χ 2j+ → g ~ , g ~ g ~ → pp (8 TeV) -1 19.4 fb CMS
Figure 9. Exclusion limits at 95% CL for the GMSB scenario in the m!g-mχ!0
1 plane. The color
indicates the excluded cross section for each considered point in parameter space. The intersections of the theoretical cross section with the expected and observed limits are indicated by the solid and hatched lines. The 1 standard deviation (σ) experimental and theoretical uncertainty contours are shown as dotted lines.
central (forward) lepton rapidity regions. We do not observe evidence for a statistically significant signal. The maximum deviation from the null hypothesis is at the level of 2.6 standard deviations and is observed in the dilepton mass window 20 < mℓℓ < 70 GeV.
We interpret the results of the search for a kinematic edge in the context of simplified models consisting of bottom-squark pair production, with each bottom-squark !b decaying to a bottom quark and the χ!02 neutralino. Exclusion limits are set in the m!b-mχ!0
2 mass
plane for two scenarios. In the fixed-edge scenario, the mass difference between the χ!0 2
and χ!01 particles is fixed to 70 GeV. Bottom-squark masses between 200 and 350 GeV are excluded at 95% confidence level in this scenario. In the slepton-edge scenario, the χ!02 decays to an on- or off-shell Z boson and the χ!0
1 lightest supersymmetric particle or to a
slepton and a lepton, with a 50% probability for each possibility. Bottom-squark masses between 450 and 600 GeV are excluded at 95% confidence level in this second scenario. In both scenarios, the sensitivity depends on the mass of theχ!02 . Finally, a dedicated search for events containing an on-shell Z boson is interpreted in a model of gauge-mediated supersymmetry breaking, in which the Z bosons are produced in decay chains initiated through gluino pair production. Gluino masses between 900 and 1100 GeV are excluded at 95% confidence level, depending on the mass of the lightest neutralino χ!01 .
Acknowledgments
We congratulate our colleagues in the CERN accelerator departments for the excellent performance of the LHC and thank the technical and administrative staffs at CERN and at other CMS institutes for their contributions to the success of the CMS effort. In ad-dition, we gratefully acknowledge the computing centers and personnel of the Worldwide
JHEP04(2015)124
LHC Computing Grid for delivering so effectively the computing infrastructure essential to our analyses. Finally, we acknowledge the enduring support for the construction and operation of the LHC and the CMS detector provided by the following funding agencies: BMWFW and FWF (Austria); FNRS and FWO (Belgium); CNPq, CAPES, FAPERJ, and FAPESP (Brazil); MES (Bulgaria); CERN; CAS, MoST, and NSFC (China); COL-CIENCIAS (Colombia); MSES and CSF (Croatia); RPF (Cyprus); MoER, ERC IUT and ERDF (Estonia); Academy of Finland, MEC, and HIP (Finland); CEA and CNRS/IN2P3 (France); BMBF, DFG, and HGF (Germany); GSRT (Greece); OTKA and NIH (Hungary); DAE and DST (India); IPM (Iran); SFI (Ireland); INFN (Italy); MSIP and NRF (Repub-lic of Korea); LAS (Lithuania); MOE and UM (Malaysia); CINVESTAV, CONACYT, SEP, and UASLP-FAI (Mexico); MBIE (New Zealand); PAEC (Pakistan); MSHE and NSC (Poland); FCT (Portugal); JINR (Dubna); MON, RosAtom, RAS and RFBR (Rus-sia); MESTD (Serbia); SEIDI and CPAN (Spain); Swiss Funding Agencies (Switzerland); MST (Taipei); ThEPCenter, IPST, STAR and NSTDA (Thailand); TUBITAK and TAEK (Turkey); NASU and SFFR (Ukraine); STFC (United Kingdom); DOE and NSF (U.S.A.). Individuals have received support from the Marie-Curie program and the European Re-search Council and EPLANET (European Union); the Leventis Foundation; the A. P. Sloan Foundation; the Alexander von Humboldt Foundation; the Belgian Federal Science Policy Office; the Fonds pour la Formation `a la Recherche dans l’Industrie et dans l’Agriculture (FRIA-Belgium); the Agentschap voor Innovatie door Wetenschap en Technologie (IWT-Belgium); the Ministry of Education, Youth and Sports (MEYS) of the Czech Republic; the Council of Science and Industrial Research, India; the HOMING PLUS program of Foundation for Polish Science, cofinanced from European Union, Regional Development Fund; the Compagnia di San Paolo (Torino); the Consorzio per la Fisica (Trieste); MIUR project 20108T4XTM (Italy); the Thalis and Aristeia programs cofinanced by EU-ESF and the Greek NSRF; and the National Priorities Research Program by Qatar National Research Fund.
Open Access. This article is distributed under the terms of the Creative Commons Attribution License (CC-BY 4.0), which permits any use, distribution and reproduction in any medium, provided the original author(s) and source are credited.
References
[1] CMS collaboration, The CMS experiment at the CERN LHC,2008 JINST 3 S08004
[INSPIRE].
[2] S.P. Martin, A supersymmetry primer,Adv. Ser. Direct. High Energy Phys. 21 (2010) 1
[hep-ph/9709356] [INSPIRE].
[3] I. Hinchliffe, F.E. Paige, M.D. Shapiro, J. Soderqvist and W. Yao, Precision SUSY measurements at CERN LHC,Phys. Rev. D 55 (1997) 5520[hep-ph/9610544] [INSPIRE].
[4] CMS collaboration, Search for new physics in events with opposite-sign leptons, jets and missing transverse energy in pp collisions at√s = 7 TeV, Phys. Lett. B 718 (2013) 815
JHEP04(2015)124
[5] CMS collaboration, Search for physics beyond the standard model in events with a Z boson,jets and missing transverse energy in pp collisions at √s = 7 TeV,Phys. Lett. B 716 (2012) 260[arXiv:1204.3774] [INSPIRE].
[6] ATLAS collaboration, Search for direct production of charginos, neutralinos and sleptons in final states with two leptons and missing transverse momentum in pp collisions at
√s = 8 TeV with the ATLAS detector, JHEP 05 (2014) 071[
arXiv:1403.5294] [INSPIRE].
[7] ATLAS collaboration, Search for direct top-squark pair production in final states with two leptons in pp collisions at√s = 8 TeV with the ATLAS detector,JHEP 06 (2014) 124
[arXiv:1403.4853] [INSPIRE].
[8] LHC New Physics Working Group, D. Alves et al., Simplified models for LHC new physics searches,J. Phys. G 39 (2012) 105005[arXiv:1105.2838] [INSPIRE].
[9] K.T. Matchev and S.D. Thomas, Higgs and Z boson signatures of supersymmetry,Phys. Rev. D 62 (2000) 077702[hep-ph/9908482] [INSPIRE].
[10] P. Meade, M. Reece and D. Shih, Prompt decays of general neutralino NLSPs at the Tevatron,JHEP 05 (2010) 105[arXiv:0911.4130] [INSPIRE].
[11] J.T. Ruderman and D. Shih, General neutralino NLSPs at the early LHC,JHEP 08 (2012) 159[arXiv:1103.6083] [INSPIRE].
[12] J. Alwall, M. Herquet, F. Maltoni, O. Mattelaer and T. Stelzer, MadGraph 5: going beyond,
JHEP 06 (2011) 128[arXiv:1106.0522] [INSPIRE].
[13] J. Alwall et al., The automated computation of tree-level and next-to-leading order
differential cross sections and their matching to parton shower simulations,JHEP 07 (2014) 079[arXiv:1405.0301] [INSPIRE].
[14] T. Sj¨ostrand, S. Mrenna and P.Z. Skands, PYTHIA 6.4 physics and manual,JHEP 05 (2006) 026[hep-ph/0603175] [INSPIRE].
[15] S. Abdullin et al., The fast simulation of the CMS detector at LHC,J. Phys. Conf. Ser. 331 (2012) 032049.
[16] GEANT4 collaboration, S. Agostinelli et al., GEANT4 — a simulation toolkit, Nucl. Instrum. Meth. A 506 (2003) 250[INSPIRE].
[17] W. Beenakker, R. Hopker, M. Spira and P.M. Zerwas, Squark and gluino production at hadron colliders,Nucl. Phys. B 492 (1997) 51[hep-ph/9610490] [INSPIRE].
[18] A. Kulesza and L. Motyka, Threshold resummation for squark-antisquark and gluino-pair production at the LHC,Phys. Rev. Lett. 102 (2009) 111802[arXiv:0807.2405] [INSPIRE].
[19] A. Kulesza and L. Motyka, Soft gluon resummation for the production of gluino-gluino and squark-antisquark pairs at the LHC,Phys. Rev. D 80 (2009) 095004[arXiv:0905.4749]
[INSPIRE].
[20] W. Beenakker et al., Soft-gluon resummation for squark and gluino hadroproduction, JHEP 12 (2009) 041[arXiv:0909.4418] [INSPIRE].
[21] W. Beenakker et al., Squark and gluino hadroproduction, Int. J. Mod. Phys. A 26 (2011) 2637[arXiv:1105.1110] [INSPIRE].
[22] M. Kr¨amer et al., Supersymmetry production cross sections in pp collisions at √s = 7 TeV,
arXiv:1206.2892[INSPIRE].
[23] CMS collaboration, Performance of electron reconstruction and selection with the CMS detector in proton-proton collisions at√s = 8 TeV,arXiv:1502.02701[INSPIRE].
JHEP04(2015)124
[24] CMS collaboration, Performance of CMS muon reconstruction in pp collision events at√s = 7 TeV, 2012 JINST 7 P10002[
arXiv:1206.4071] [INSPIRE].
[25] M. Cacciari, G.P. Salam and G. Soyez, FastJet user manual,Eur. Phys. J. C 72 (2012) 1896
[arXiv:1111.6097] [INSPIRE].
[26] CMS collaboration, Performance of τ -lepton reconstruction and identification in CMS,2012 JINST 7 P01001[arXiv:1109.6034] [INSPIRE].
[27] M. Cacciari, G.P. Salam and G. Soyez, The anti-kt jet clustering algorithm,JHEP 04 (2008) 063[arXiv:0802.1189] [INSPIRE].
[28] M. Cacciari and G.P. Salam, Dispelling the N3 myth for the k
t jet-finder,Phys. Lett. B 641 (2006) 57[hep-ph/0512210] [INSPIRE].
[29] M. Cacciari and G.P. Salam, Pileup subtraction using jet areas,Phys. Lett. B 659 (2008) 119
[arXiv:0707.1378] [INSPIRE].
[30] Y. Li and F. Petriello, Combining QCD and electroweak corrections to dilepton production in FEWZ,Phys. Rev. D 86 (2012) 094034[arXiv:1208.5967] [INSPIRE].
[31] Particle Data Group, K.A. Olive et al., Review of particle physics,Chin. Phys. C 38 (2014) 090001.
[32] M.J. Oreglia, A study of the reactions ψ′→ γγψ,Ph.D. thesis, Stanford University, Stanford, U.S.A. (1980), see appendix D [SLAC-R-236].
[33] F. James and M. Roos, Minuit: a system for function minimization and analysis of the parameter errors and correlations,Comput. Phys. Commun. 10 (1975) 343[INSPIRE].
[34] ATLAS collaboration, Procedure for the LHC Higgs boson search combination in summer 2011,ATL-PHYS-PUB-2011-011(2011).
[35] CMS collaboration, Identification of b-quark jets with the CMS experiment,2013 JINST 8 P04013[arXiv:1211.4462] [INSPIRE].
[36] CMS Collaboration, CMS luminosity based on pixel cluster counting — Summer 2013 Update,CMS-PAS-LUM-13-001(2013).
[37] S. Alekhin et al., The PDF4LHC working group interim report, arXiv:1101.0536[INSPIRE].
[38] M. Botje et al., The PDF4LHC working group interim recommendations,arXiv:1101.0538
[INSPIRE].
[39] R.D. Ball et al., Parton distributions with LHC data, Nucl. Phys. B 867 (2013) 244
[arXiv:1207.1303] [INSPIRE].
[40] A.D. Martin, W.J. Stirling, R.S. Thorne and G. Watt, Parton distributions for the LHC,
Eur. Phys. J. C 63 (2009) 189[arXiv:0901.0002] [INSPIRE].
[41] H.-L. Lai et al., New parton distributions for collider physics,Phys. Rev. D 82 (2010) 074024
[arXiv:1007.2241] [INSPIRE].
[42] CMS collaboration, Determination of jet energy calibration and transverse momentum resolution in CMS,2011 JINST 6 P11002.
[43] CMS collaboration, Search for top-squark pair production in the single-lepton final state in pp collisions at√s = 8 TeV,Eur. Phys. J. C 73 (2013) 2677[arXiv:1308.1586] [INSPIRE].
[44] T. Junk, Confidence level computation for combining searches with small statistics,Nucl. Instrum. Meth. A 434 (1999) 435[hep-ex/9902006] [INSPIRE].
[45] A.L. Read, Presentation of search results: the CL(s) technique,J. Phys. G 28 (2002) 2693
JHEP04(2015)124
The CMS collaboration
Yerevan Physics Institute, Yerevan, Armenia V. Khachatryan, A.M. Sirunyan, A. Tumasyan
Institut f¨ur Hochenergiephysik der OeAW, Wien, Austria
W. Adam, T. Bergauer, M. Dragicevic, J. Er¨o, M. Friedl, R. Fr¨uhwirth1, V.M. Ghete, C. Hartl, N. H¨ormann, J. Hrubec, M. Jeitler1, W. Kiesenhofer, V. Kn¨unz, M. Krammer1, I. Kr¨atschmer, D. Liko, I. Mikulec, D. Rabady2, B. Rahbaran, H. Rohringer, R. Sch¨ofbeck,
J. Strauss, W. Treberer-Treberspurg, W. Waltenberger, C.-E. Wulz1
National Centre for Particle and High Energy Physics, Minsk, Belarus V. Mossolov, N. Shumeiko, J. Suarez Gonzalez
Universiteit Antwerpen, Antwerpen, Belgium
S. Alderweireldt, S. Bansal, T. Cornelis, E.A. De Wolf, X. Janssen, A. Knutsson, J. Lauw-ers, S. Luyckx, S. Ochesanu, R. Rougny, M. Van De Klundert, H. Van Haevermaet, P. Van Mechelen, N. Van Remortel, A. Van Spilbeeck
Vrije Universiteit Brussel, Brussel, Belgium
F. Blekman, S. Blyweert, J. D’Hondt, N. Daci, N. Heracleous, J. Keaveney, S. Lowette, M. Maes, A. Olbrechts, Q. Python, D. Strom, S. Tavernier, W. Van Doninck, P. Van Mulders, G.P. Van Onsem, I. Villella
Universit´e Libre de Bruxelles, Bruxelles, Belgium
C. Caillol, B. Clerbaux, G. De Lentdecker, D. Dobur, L. Favart, A.P.R. Gay, A. Grebenyuk, A. L´eonard, A. Mohammadi, L. Perni`e2, A. Randle-conde, T. Reis, T. Seva, L. Thomas, C. Vander Velde, P. Vanlaer, J. Wang, F. Zenoni
Ghent University, Ghent, Belgium
V. Adler, K. Beernaert, L. Benucci, A. Cimmino, S. Costantini, S. Crucy, A. Fagot, G. Garcia, J. Mccartin, A.A. Ocampo Rios, D. Poyraz, D. Ryckbosch, S. Salva Diblen, M. Sigamani, N. Strobbe, F. Thyssen, M. Tytgat, E. Yazgan, N. Zaganidis
Universit´e Catholique de Louvain, Louvain-la-Neuve, Belgium
S. Basegmez, C. Beluffi3, G. Bruno, R. Castello, A. Caudron, L. Ceard, G.G. Da Silveira,
C. Delaere, T. du Pree, D. Favart, L. Forthomme, A. Giammanco4, J. Hollar, A. Jafari, P. Jez, M. Komm, V. Lemaitre, C. Nuttens, D. Pagano, L. Perrini, A. Pin, K. Piotrzkowski, A. Popov5, L. Quertenmont, M. Selvaggi, M. Vidal Marono, J.M. Vizan Garcia
Universit´e de Mons, Mons, Belgium
N. Beliy, T. Caebergs, E. Daubie, G.H. Hammad
Centro Brasileiro de Pesquisas Fisicas, Rio de Janeiro, Brazil
W.L. Ald´a J´unior, G.A. Alves, L. Brito, M. Correa Martins Junior, T. Dos Reis Martins, J. Molina, C. Mora Herrera, M.E. Pol, P. Rebello Teles
JHEP04(2015)124
Universidade do Estado do Rio de Janeiro, Rio de Janeiro, Brazil
W. Carvalho, J. Chinellato6, A. Cust´odio, E.M. Da Costa, D. De Jesus Damiao, C. De Oliveira Martins, S. Fonseca De Souza, H. Malbouisson, D. Matos Figueiredo, L. Mundim, H. Nogima, W.L. Prado Da Silva, J. Santaolalla, A. Santoro, A. Sznajder, E.J. Tonelli Manganote6, A. Vilela Pereira
Universidade Estadual Paulistaa, Universidade Federal do ABCb, S˜ao Paulo,
Brazil
C.A. Bernardesb, S. Dograa, T.R. Fernandez Perez Tomeia, E.M. Gregoresb, P.G. Mercadanteb, S.F. Novaesa, Sandra S. Padulaa
Institute for Nuclear Research and Nuclear Energy, Sofia, Bulgaria
A. Aleksandrov, V. Genchev2, R. Hadjiiska, P. Iaydjiev, A. Marinov, S. Piperov, M. Rodozov, S. Stoykova, G. Sultanov, M. Vutova
University of Sofia, Sofia, Bulgaria
A. Dimitrov, I. Glushkov, L. Litov, B. Pavlov, P. Petkov Institute of High Energy Physics, Beijing, China
J.G. Bian, G.M. Chen, H.S. Chen, M. Chen, T. Cheng, R. Du, C.H. Jiang, R. Plestina7, F. Romeo, J. Tao, Z. Wang
State Key Laboratory of Nuclear Physics and Technology, Peking University, Beijing, China
C. Asawatangtrakuldee, Y. Ban, S. Liu, Y. Mao, S.J. Qian, D. Wang, Z. Xu, F. Zhang8, L. Zhang, W. Zou
Universidad de Los Andes, Bogota, Colombia
C. Avila, A. Cabrera, L.F. Chaparro Sierra, C. Florez, J.P. Gomez, B. Gomez Moreno, J.C. Sanabria
University of Split, Faculty of Electrical Engineering, Mechanical Engineering and Naval Architecture, Split, Croatia
N. Godinovic, D. Lelas, D. Polic, I. Puljak
University of Split, Faculty of Science, Split, Croatia Z. Antunovic, M. Kovac
Institute Rudjer Boskovic, Zagreb, Croatia
V. Brigljevic, K. Kadija, J. Luetic, D. Mekterovic, L. Sudic University of Cyprus, Nicosia, Cyprus
A. Attikis, G. Mavromanolakis, J. Mousa, C. Nicolaou, F. Ptochos, P.A. Razis, H. Rykaczewski
Charles University, Prague, Czech Republic M. Bodlak, M. Finger, M. Finger Jr.9
JHEP04(2015)124
Academy of Scientific Research and Technology of the Arab Republic of Egypt, Egyptian Network of High Energy Physics, Cairo, Egypt
Y. Assran10, A. Ellithi Kamel11, M.A. Mahmoud12, A. Radi13,14
National Institute of Chemical Physics and Biophysics, Tallinn, Estonia M. Kadastik, M. Murumaa, M. Raidal, A. Tiko
Department of Physics, University of Helsinki, Helsinki, Finland P. Eerola, M. Voutilainen
Helsinki Institute of Physics, Helsinki, Finland
J. H¨ark¨onen, V. Karim¨aki, R. Kinnunen, M.J. Kortelainen, T. Lamp´en, K. Lassila-Perini, S. Lehti, T. Lind´en, P. Luukka, T. M¨aenp¨a¨a, T. Peltola, E. Tuominen, J. Tuominiemi, E. Tuovinen, L. Wendland
Lappeenranta University of Technology, Lappeenranta, Finland J. Talvitie, T. Tuuva
DSM/IRFU, CEA/Saclay, Gif-sur-Yvette, France
M. Besancon, F. Couderc, M. Dejardin, D. Denegri, B. Fabbro, J.L. Faure, C. Favaro, F. Ferri, S. Ganjour, A. Givernaud, P. Gras, G. Hamel de Monchenault, P. Jarry, E. Locci, J. Malcles, J. Rander, A. Rosowsky, M. Titov
Laboratoire Leprince-Ringuet, Ecole Polytechnique, IN2P3-CNRS, Palaiseau, France
S. Baffioni, F. Beaudette, P. Busson, E. Chapon, C. Charlot, T. Dahms, L. Dobrzynski, N. Filipovic, A. Florent, R. Granier de Cassagnac, L. Mastrolorenzo, P. Min´e, I.N. Naranjo, M. Nguyen, C. Ochando, G. Ortona, P. Paganini, S. Regnard, R. Salerno, J.B. Sauvan, Y. Sirois, C. Veelken, Y. Yilmaz, A. Zabi
Institut Pluridisciplinaire Hubert Curien, Universit´e de Strasbourg,
Univer-sit´e de Haute Alsace Mulhouse, CNRS/IN2P3, Strasbourg, France
J.-L. Agram15, J. Andrea, A. Aubin, D. Bloch, J.-M. Brom, E.C. Chabert, C. Collard, E. Conte15, J.-C. Fontaine15, D. Gel´e, U. Goerlach, C. Goetzmann, A.-C. Le Bihan,
K. Skovpen, P. Van Hove
Centre de Calcul de l’Institut National de Physique Nucleaire et de Physique des Particules, CNRS/IN2P3, Villeurbanne, France
S. Gadrat
Universit´e de Lyon, Universit´e Claude Bernard Lyon 1, CNRS-IN2P3, Institut
de Physique Nucl´eaire de Lyon, Villeurbanne, France
S. Beauceron, N. Beaupere, C. Bernet7, G. Boudoul2, E. Bouvier, S. Brochet, C.A. Carrillo Montoya, J. Chasserat, R. Chierici, D. Contardo2, B. Courbon, P. Depasse, H. El Mamouni,
J. Fan, J. Fay, S. Gascon, M. Gouzevitch, B. Ille, T. Kurca, M. Lethuillier, L. Mirabito, A.L. Pequegnot, S. Perries, J.D. Ruiz Alvarez, D. Sabes, L. Sgandurra, V. Sordini, M. Vander Donckt, P. Verdier, S. Viret, H. Xiao