ELSEVIER
Respiration Physiology 99 (1995) 259-271°
Factors limiting maximal 02 consumption: effects of acute changes
in ventilation
Guido Ferretti a'*, Pietro Enrico di Prampero b
~' Dg'partement de Physiologie, Centre MOdical Universitaire, Gen~ve, Switzerland b Dipartimento di Scienze e 7i~cnologie Biomediche. Universith di Udine. Udine. haly
Accepted 5 September 1994
A b s t r a c t
The response of the 02 transport system to acute changes in alveolar ventilation ('qA) was analysed. The fractional limitations to maximal 02 consumption (Vo~ ... ) imposed by the lungs (ventilation, Fv, and lung-blood transfer, FL), the cardiovascular system (FQ), and peripheral 02 diffusion (Fp) were calculated according to a multifactorial model. A reference set of data, describing the status of 02 transport at maximal exercise in normoxia was used. The effects of'qA
on 9% ... were assessed on the assumption of a constant reference 02 flow in mixed venous blood (0Vo,). The changes
in reference data "after given independent changes in VA were calculated by an iterative procedure, until the Vo~in~,~. value
compatible with the constant reference Q9% was found, at Plo, values of 150 (normoxia), 130, 110 and 90 Torr. The V o ...
changes in normoxia were less than expected assuming a linear 02 transport system, because of the flatness of the 02 dissociation curve around normoxic P%. This affected the cardiovascular resistance to 02 flow, and its changes coun- terbalanced the effects on Vo_, ... of induced changes in VA. This phenomenon was reversed in hypoxia, as the steep part of the O2 dissociation curve was approached. The fractional limitations to 9 o ... in normoxia resulted as follows: Fv and FL provided between 5 and 12%, FQ between 59 and 78?'0, and Fp between 13 and 19% of the overall %), ... limitation. In hypoxia, Fv and FL increased and FQ decreased. At PIo, = 90 Torr, when VA was halved. Fv, FL, FQ and Fp amounted to 0.35, 0.31, 0.20 and 0.14, respectively.
Key words: Exercise, 02 transport; Mammals, humans; Model, 02 transport exercise: Oxygen, transport, exercise
1. Introduction
The maximal 0 2 c o n s u m p t i o n (9O:max) is defined by the plateau attained by the 0 2 c o n s u m p t i o n above a given power. Since Hill and L u p t o n (1923), the limitation to Vo,ma× was usually attributed to the cardiovascular 0 2 transport system, at least during
* C o r r e s p o n d i n g author. Tel.: + + 4 1 - 2 2 - 7 0 2 5 3 6 3 ; Fax: + + 41- 2 2 - 3 4 7 3 3 3 4 .
0034-5687/95/$9.50 © 1995 Elsevier Science B.V. All rights reserved S S D I 0 1 } 3 4 - 5 6 8 7 ( 9 4 ) 0 0 0 9 2 - 1
exercise involving big muscle groups (Blomqvist and Saltin, 1983; Ekblom, 1986; Margaria et al., 1965). In recent years, a different a p p r o a c h to the subject of ~'o~ . . . . limitation was proposed. The 0 2 c o n d u c - tance equation, a non-linear I solution of which was firstly p r o p o s e d by Shephard (1969), was applied to the description of the 0 2 transport system during
In the present context, 'non-linear" is used to mean that the equation contains a variable coefficient.
260 G. Ferretti and P.E. di Prampero / Respiration Physiology 99 (1995) 259-271
maximal exercise (Taylor and Weibel, 1981). A mul- tifactorial model of V%max limitation was developed afterwards, on the assumption that each physiologi- cal resistance to the 0 2 flow from ambient air to the mitochondria provides a given measurable fraction of the overall V%max limitation (Cerretelli and di Prampero, 1987; di Prampero, 1985; di Prampero and Ferretti, 1990). These authors, by applying present Eq. (2) (see below), calculated that cardio- vascular 02 transport may provide about 70~o of the overall V o . . . . limitation.
A different approach to the analysis of Vo:ma × limitation was proposed by Wagner (1992), who looked at a two-site system (perfusion vs diffusion), and stressed the role of peripheral 02 diffusion as a factor limiting Vo~a x. An algebraic model of this system was recently developed (Wagner, 1993), by applying the diffusive-convective interaction equa- tions (Piiper and Scheid, 1981; Piiper et al., 1984). Both the above-cited analyses disregarded the lungs as a possible specific source of V%~ax limita- tion. On one hand, Wagner (1993), although he assumed a linear diffusion-limited lung 02 transfer, discussed his results in terms of an overall 02 de- livery, that included also an oversimplified cardio- vascular O 2 transport with a linear O 2 dissociation curve. On the other hand, di Prampero and Ferretti (1990) postulated that the changes of the resistances to 02 flow located in the lungs could not influence Vo2ma x in normoxia because inevitably associated with opposite equivalent changes in cardiovascular 02 transport. This hypothesis, while excluding the lungs.from a numerical analysis of the factors lim- iting V o . . . implies the qualitative assumption of a non-linear 0 2 transport system.
The role of the lungs in limiting ~/Oema x in normoxic and hypoxic humans is examined in the present study. The readjustments occurring along the 0 2 transport system after acute variations of the venti- latory resistance to 02 flow, and their effects on Vo2max, are quantified. The fractional limitation of Vo2ma x is then calculated for the first time along the entire 0 2 transport system, according to the multi- factorial model (di Prampero, 1985; di Prampero and Ferretti, 1990). Thus, this study represents a step beyond previous analyses, that looked only at the linear interrelation between cardiovascular 02 transport and tissue 02 utilisation.
2. T h e g e n e r a l m o d e l
A detailed description of 02 flow along the 02 transport system against a number of resistances in series can be found in the literature (Taylor and Weibel, 1981; di Prampero, 1985; di Prampero and Ferretti, 1990). Thus only some critical features are reckoned hereafter.
The overall resistance to 02 flow (RT = 1/GT, where G indicates conductance) is considered equal to the sum of four physiological resistances in series, associated with alveolar ventilation (ventilatory re- sistance, Rv = 1/Gv), alveolar-capillary 02 transfer (lung resistance, RE= 1/GL), blood 02 transport (circulatory resistance, RQ = 1/GQ), and peripheral 02 diffusion and utilisation (peripheral resistance, Rp = 1/Gp). At maximal exercise at steady state, the following equalities apply:
Wo2ma x = ( P l o z - PAo2)/Rv =
(PAo2 - Pa%)/RL = (Pao2 - P~e%)/RQ = (P~o2 - Pmo2)/RP = (PIo2 - Pm%)/RT (1) where PIo2 , PAo2 , Pao2, P~¢o:, and Pmo2 represent the 02 partial pressures in inspired air, alveolar air, arterial blood, mixed venous blood, and the mito- chondrial matrix, respectively. Each resistance (Rv, RL, RQ and Rp) is considered responsible for a fraction of the overall limitation to Vo2ma x (FV, FL, FQ and Fp, respectively, their sum being equal to one). Developing Eq. (1), and expressing in relative terms the changes in Vo2,na x upon changes of the ith resistance to 02 flow (ARi), di Prampero and Fer- retti (1990) ended up with the following linear equa- tion:
Wo . . . . ARi
= 1 + Fi. (2)
(~/O . . . . q- A~]o . . . . ) Ri
where Fi is the fractional limitation to Vo2ma x im- posed by the resistance in question. Letting ARI/ Ri = x, a n d ~/O2max/(~VrO2rnax + Vo2max) = y, and gen- eralizing, we obtain:
dy
Fi - (3)
dx
G. Ferretti and P.E. di Prampero / Respiration Physiology 99 (1995) 259-271 261
physiological applications of Eq. (3) are described in the next paragraphs.
Microsoft Excel 4.0 and Microcal Origin 2.24 soft- wares were used for data treatment and graphical analysis.
3. Of a linear respiratory system
Were the 02 transport along the respiratory sys- tem a linear process, Eq. (2) would be applicable and any Fi would be equal to:
Ri APi
Fi - - - - (4)
RT APT
whereby the changes
in go?max
ensuing from any given acute variation in one Ri could be predicted. The fractional limitation to "V'o~m~x obtained on the basis of Eq. (4) for sedentary men and for en- durance athletes in normoxia is shown in Table 1. A linear 02 transport system implies that Fv, FL, FQ and Fp values in Table 1 would remain the same whatever the head 02 pressure, thus leading to a linear increase in Vo,m~ as a function of P I o . This, however, is not the case (Cerretelli, 1980).The hypothesis of a non-linear behaviour of the 02 transport system is discussed in the next para- g.raphs where the effect of induced changes in R v on V o ... are analysed. For this analysis, we used a personal computer (Gateway 2000 486/33C, USA).
Table 1
Fractional limitation to '¢o_,n,~x on the assumption conductance equation has a linear solution
that the O 2
Sea level Sea level sedentary endurance athletes
Vo, ... L min - a 2.90 4.90 PIo2, Tort 150 150 PAo:, -l-orr 120 115 b Pao., Torr 95 83 b Pvo~, Torr 20 ~ 18 ~ Pmo2, Torr 0 0 F v 0.20 0.23 FL 0.17 0.21 FQ 0.50 0.43 Fp 0.13 0.12
Experimental data at lea level are average values from Cerretelli and di Prampero (1987), except a (Turner et al., 1993) and b (Dempsey et al., 1984).
4. Basic data: assumptions and calculations Let us take a young healthy subject, with "~O2m~x in normoxia (PIo2= 150 Torr) of 2.9 g min (Cerretelli and di Prampero, 1987), and blood hae- moglobin concentration (Hb) of 150 g L ~. Refer- ence G v is assumed to be 100 ml rain ~ Torr -~ ( R v = 1 0 Torr min L -l STPD, V A = 9 2 L min -1 BTPS). Then PAo2 is calculated as:
PAo2 = Plo2 - Vo . . . . .Rv (5) Reference Pao, at maximal exercise is assumed to be 95 Torr (Cerretelli and di Prampero, 1987). Assum- ing a steady-state for gas exchange, RL can be cal- culated from Eq. (1). The obtained RL value (8.97 Torr rain L - 1) is kept constant along the entire simu- lation.
The 'physiological' arterial 02 saturation (Sao,) is calculated from Pao2 by means of the 02 status al- gorithm (Siggaard-Andersen and Siggaard-Ander- sen, 1990), that takes into account the Bohr effect. To do this, we assumed that: (1) lactic acid at maxi- mal exercise is accumulated at a constant rate, its average concentration being 8 raM; (2) lactic acid dissociation is complete in the range of blood pH; (3) resting blood bicarbonate concentration is 24 mM, and decreases stoichioimetrically with lac- tic acid accumulation; (4) the gas exchange ratio is 1; and (5) alveolar and arterial CO 2 partial pressures (PAco ~ and P a c o 2 , respectively) are equal. If this is so, Paco~ can be calculated as:
Paco2 = PAco: = "VCO2 'R v = Vo . . . . "Rv (6) Arterial blood pH can then be obtained from the Henderson-Hasselbalch equation. Arterial 02 con- centration (Cao, ~, ml 02 L - l ) is calculated from Hb and Sa% as:
Cao2 = 1.34 Hb Sao2 (7)
where 1.34 is the physiological 02 binding coefficient of haemoglobin. Maximal cardiac output (()) is as- sumed to be constant and equal to 20 L rain ~. Mixed venous 02 concentration (C~o2) is then
262 G. Ferretti and P.E. di Prampero / Respiration Physiology 99 (1995) 259-271
calculated from the Fick equation. For a respiratory quotient of 1, the CO2 concentration in mixed venous blood (CV¢%) is given by:
"~o~
9o~ ....
C ' T c o : = C a c o 2 + 0 = C a c o : + Q " (8) Mixed venous CO 2 partial pressure (P'Tco~) is then calculated from the CO 2 dissociation curve for re- duced blood, and mixed venous blood pH by means of the Henderson-Hasselbalch equation. This allows computation of mixed venous 02 partial pressure (PV%) from
CVo:
by means of the 0 2 status algo- rithm. The 02 transport coefficient of blood is then calculated as:(Ca% - C'eo2)
fib = (9)
(Pa% - P~%)
after which GQ and its reciprocal, RQ, can be cal- culated. Finally the product of O times C~o, pro- vides the 02 flow in mixed venous blood (0x?o~), for which a value of 1.011 rain -~ is obtained.
The values of all the assumed and calculated variables described in this paragraph for a condition in which PIo, = 150 Torr, Rv = 10 Torr rain L and Vo . . . . -2.9 L.min -1, here defined as the reference condition in normoxia, are reported in Table 2.
5. The effects of a change in Rv on V o . . . . 5.1. Normoxia
For any given imposed change in Rv, starting from the reference condition, Vo, max and related pa-
Table 2
Reference values for all computed parameters in normoxia for a ventilatory resistance to 02 flow (Rv) equal to 10 Torr min L ~, and the ensuing values after R v is increased to 12.5 Torr min L - 1 or decreased to 7.5 Torr min L
Parameter Symbol Unit Value
Rv = I0 Rv = 12.5 Rv - 7.5
Inspired 0 2 partial pressure Ploz Torr 150 150 150
Maximal O 2 uptake Vo, m~x L min ~ (STPD) 2.90" 2.84 2.95
02 transfer coefficient for gas fl.g* mlO 2 L ~ Torr ~ 1.16" 1.16 1.16
Alveolar ventilation VA L min t (BTPS) 92.0 73.9 123.9
Alveolar 02 partial pressure PAo_, Torr 12 l 115 128
Lung resistance to 02 flow RL* Torr min L t 8.97 8.97 8.97
Arterial O 2 partial pressure Pao_ , Torr 95" 89 101
Arterial CO 2 partial pressure Paco 2 Torr 29.0 35.5 22.2
Arterial pH pH~ unitless 7.383 7.295 7.500
Arterial CO 2 concentration Caco 2 mlCO 2 L - 1 43.6 46.2 40.9
Haemoglobin concentration Hb* g L ~ 150" 150 150
Arterial O 2 saturation Sao~ unitless 0.973 0.958 0.984
Arterial 02 concentration Cao~ mlO2 L ~ 195.5 192.5 197.9
Cardiac output Q* L min ~ 20" 20 20
Mixed venous O z partial pressure C~7o2 mlO2 L t 50.5 50.5 50.5
Mixed venous 02 saturation Sx7o2 unitless 0.251 0.251 0.251
Mixed venous CO2 concentration CCeco~ mtCO 2 L t 58.1 60.4 55.6
Mixed venous CO2 partial pressure P~coz Tort 51.3 57.0 45.0
Mixed venous pH price unitless 7.136 7.090 7.193
Mixed venous 02 partial pressure P,7% Torr 16.9 17.2 16.5
02 transfer coefficient for blood fib mlO2 M 1 T o r r - 1 1.86 1.94 1.74
Cardiovascular resistance to 02 flow RQ Torr min L ~ 26.9 25.3 28.6
02 flow in mixed venous blood 0902* L min 1 1.0ll 1.011 1.011
Asterisks indicate assumed constants. Exponents indicate either an assumed value or an average from the literature. The reference condition is indicated in italic. The 1.16 figure for fig is BTPS.
G. Ferretti and P.E. di Prampero / Respiration Physiology 99 (1995) 259-271 263
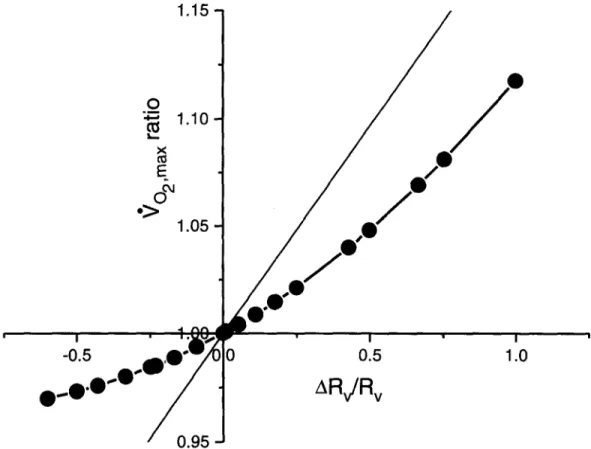
rameters are calculated by trial and error, until the values compatible with the constancy of 0"~o, are found and retained. The 9 0 . . . . values ensuing t'rom numerous imposed changes in Rv are shown in Table 3, together with the characteristics of the car- diovascular 02 transport. Note that the lower is Rv, the higher is RQ, so that RT and ~rO2ma × change very little. In Fig. 1, the relative changes in Vo~ma x are plotted as a function of the corresponding changes in Rv. Fig. 1 is equivalent to the Fig. 2 of di Pramp- ero and Ferretti (1990), using Rv instead of RQ. F v is the first derivative of the general form of Eq. (2) which is complex and unpredictable on physiologi- cal grounds. An average F v value for a given change in Rv can be obtained from the average slope of the curve in Fig. 2 between two points, as:
( 9 0 ... + a g o ... ) a R v
= F v (10)
which is nothing but a discrete solution of Eq. (2) for Fv.
5.2. H3poxia
In hypoxia, the reference Vo2max and the 902ma x values ensuing from given VA changes, are estimated by the same procedure as in normoxia. PIo2 values of 130. 110 and 90 Torr are tested. RL is assumed
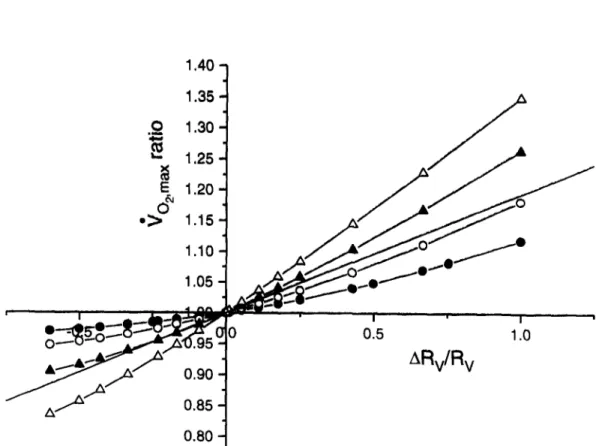
to remain unchanged. The reference Rv is 10 Tort rain L -1, as in normoxia. 0 and lactate concen- tration are assumed not to vary in hypoxia. In ad- dition, it is assumed that no further hyperventilation due to direct hypoxic stimulation of the peripheral chemoreceptors occurs, at least down to the tested PI% and Pao: (Ward and Robbins, 1987). 0Vo~ is assumed to be 1.011 L rain -I and constant, as in normoxia (Ferretti et al., 1993). In spite of these constraints, the decrease of the reference 9o2,1 .... in hypoxia turns out equivalent to that reported in the classical 9 o .... x vs PIo: plot (Cerretelli, 1980). The results obtained in hypoxia are shown in Fig. 2, where the 9 o ... ratio is plotted as a function of the induced changes in Rv, for four levels of P I o . The changes in F v as a function of the estimated Pao. are shown in Fig. 3.
6. Fractional limitation of maximal 0 2 consumption
The fractional limitation of 902ma x is estimated after induced changes in Rv only, but these are in- evitably associated with opposite changes in RQ. This appears to be a consequence of the curvilinear shape of the O 2 dissociation curve, whose average slope is the term fib (see Eq. (9)). An increase in ventilation leads to higher PAo, and hence Pa% val- ues, but it does not affect Ca% in normoxia, so that
Tablc 3
Changes in Vo2m~ x and related parameters after given changes in the ventilatory resistance to 02 flow (Rv)
R v Vo2 ... PAo2 Pao2 Cao~ CVo 2 PVo2 fib RQ
(Torr min (L min ') (Torr) (Torr) (ml() 2 L - l) (mlO2 L l) (Torr) (mlO2 L J (Torr min
L i) Torr i) L i) 20.0 2.59 98.1 74.9 18(I.3 50.5 18.0 2.28 21.9 17.5 2.68 102.9 78.9 184.7 50.5 17.8 2.20 22.8 15.0 2.77 108.5 83.7 188.9 50.5 17.5 2.09 23.2 12.5 2.84 114.5 89.0 192.3 50.5 17.2 1.98 25.3 1(I.5 2.89 119.6 93.7 195.0 50.5 17.0 1.88 26.6 10.0 2.90 121.0 95.0 195.5 50.5 16.9 1.86 26.9 9.1 2.92 123.5 97.3 196.5 50.5 16.8 1.81 27.6 7.5 2.95 127.8 101.4 197.9 50.5 16.5 1.74 28.7 6.7 2.96 130.3 103.7 198.5 50.5 16.4 1.69 29.5 5,0 2.98 135.1 108.4 199.6 50.5 16,2 1.62 30.9 4,0 2.99 138.0 111.2 200.1 50.5 16,1 1.57 31.8
264 G. Ferretti and P.E. di Prampero / Respiration Physiology 99 (1995) 259-271
1.15-1
0
:~ 1.10
E
&
1.05
/ /
/
I I . i l i ~ s ~ i r , I ' I-0 5
,,O .i'-- ' / ' T
O'W/OlO
0.5
1.o
....o
/ I
ARv/Rv
/
0.95
_1Fig. l. Changes in maximal 02 consumption
(go2max) induced
by acute changes in alveolar ventilation, expressed as the ratio between the '¢o2max before and the '¢o2~-,x after the manipulation, are plotted as a function of the changes in the ventilatory resistance to 02 flow (Rv), expressed as ARv/Rv, id est R v after minus R v before, the difference divided by R v before. 90_,m,x ratios above 1 reflect a de- crease in Vo,ma x and A R v / R v above zero reflect an increase in Rv. The results of the present analysis in normoxia are connected by the thick curve. The thin line represents the relationship that would apply in the case of a linear 02 transport system.fib
decreases. It is the ensuing change in RQ, shown in Fig. 4 as a function of Rv, that prevents Vo~m~ x from varying linearly with the Rv variations. This reasoning may explain the shape of the curve shown in Fig. 1. In fact, were the 02 dissociation curve linear, the changes in 4 o . . . . following any change in Rv would be represented by the thin line in the same figure, and F v would be a constant that could be calculated from Eq. (4). The difference between the thin and thick lines in Fig. 1 reflects the appar- ent effect of the shape of the 02. dissociation curve on the fractional limitation to V o . . . . imposed by pulmonary ventilation.However, as PIo~ decreases, Pao2 progressively shifts towards the steeper part of the O2 dissociation curve, so that 1)
fib
becomes higher than in nor-moxia, with subsequent lower RQ, and 2) no further compensation of Rv changes by RQ is possible. The former corollary is reflected in the classical non- linear "~O2max vs PIo2 plot (Cerretelli, 1980): any de- crease in PIo: is necessarily accompanied, because of the shape of the O2 dissociation curve, by a re- duction in RQ, and thus in RT, that leads to higher Vo:ma x values than predicted on the basis of an in- variant RT. In addition, the latter corollary implies that the 02 transport system in hypoxia approaches linearity around F v (FQ) values that are greater (lower) than those computed in normoxia. This is shown in Fig. 2, where a drop in PIo2 is accompa- nied by a reduced concavity of the plotted curves, whose slopes, that are equal to Fv, increase, becom- ing progressively higher than that of the hypotheti-
G. Ferretti and P,E. di Prampero / Respiration Physiology 99 (1995) 259-271 265
cal line calculated assuming a linear 0 2 transport system with a reference normoxie/3 b.
Since the sum of all Fis is always equal to one, the changes in F v shown by the curves in Figs. 1 and 2 imply rearrangement of all other FIs. Define then an overall pulmonary resistance, Rpu = R v + RL, from which an overall pulmonary fractional limita- tion to V%m~x , Fpu ( = FV + FI.) can be predicted. Changes in Fpu following changes in R v can be estimated from Eq. (10) after substituting Rpu in- stead of Rv and Fpu instead of Fv. FL can then be calculated as Fpu - Fv. FQ and Fp are then calcu- lated on the assumption that the O2 transfer across RQ and Rp, at any Po2 level, is linear, in which case:
(Pa% - P9%)
FQ - (1 - Fpu) (11)
Pao2
Fp is then obtained by subtraction of all other Fi values from one. The overall average fractional limi- tation to Vo2m,x in normoxia resulting from the above described calculations is given in Table 4. Fig. 5 summarizes the readjustments of FQ, Fp and F v as a function of PI%, calculated for 4 changes in Rv from the reference condition. It appears that in nor- moxia most of the "~O.m,x limitation is provided by FQ, but at PIo2 = 90 Torr the fractional limitation to '¢o2m,x is almost equally partitioned among the four considered Fi values.
It is noteworthy that the present results, whose validity relies on the multifactorial model of "~o . . . .
limitation, confirm and reinforce the conclusions arrived at by Piiper and Scheid (1981) who first stressed the role of diffusion resistance in lungs as limiting ~/O2ma x in hypoxia on the basis of the two- site perfusive-convective gas exchange model.
1.40
1.35
.~
1.30
1.25
°> O~
1.15
1.10
-.-d[l~
. . .
r
~
i
...
• o 5 l Oo---u- ~,,,,~,zx'0.95
:'t
~
"
~
"
0.90
ARv/Rv
- A . . . - " ~0.85
0.80 -1
Fig. 2. Same as in Fig. 1, but at various Po~ values (inspired P%, PIo2 of 150, 130, 110 and 90 Torr for O , O , • and A, respectively). The straight line represents the relationship applying in the case of a linear 02 transport system for an 02 transfer coefficient for blood equivalent to that of the reference condition in normoxia. ~'O~max ratios above 1 reflect a decrease in "¢Ozmax and ARv/Rv above zero reflect an increase in Rv.
266
0.40
G. Ferretti and P.E. di Prampero / Respiration Physiology 99 (1995) 259-271
> II 0.35 0.30 0.25 0.20 0.15 0.10 0.05 0.00
Z • X
Pi,o2 = 90 Torr A & , • P] 02 = 110 TorrPi,o2 = 150 T o r . ~ ~
• 0 • •
30 40 50 60 70 80 90 100 110 120Pa,o 2
Fig. 3. Fractional limitation to maximal 02 consumption imposed by alveolar ventilation (Fv) as a function of arterial Po~ ( P a o J , at the indicated inspired Po2 (PIo2). Each point corresponds to a given change in the ventilatory resistance to 02 flow.
7. Model's limitation: critique of assumptions
The multifactorial model of ~/O2ma x limitation analysed in this study is characterized by its sim- plicity, which, however, may per se restrict its ap- plicability. In addition, the simulation, although ex- tending the results obtained in previous studies (di Prampero, 1985; di Prampero and Ferretti, 1990), yet represents a particular case, in view of the con- straints imposed by the assumptions made. A cri- tique of assumptions is attempted in the following paragraphs.
7.1. Constancy of 0~o2 and of cardiac output
Most critical is the assumption of a constant Qgo: in any condition. This assumption relies on the
Table 4
Fractional limitation of Vo_,m~x in normoxia, calculated from a reference R v of 10 Torr min LO2 ]
ARV FV FL FQ Fp A~'o, ...
(Torr rain L O £ l) (L rain - i)
10.0 0.118 0.106 0.589 0.187 - 0 . 3 0 6 7.5 0.108 0.097 0.616 0.179 - 0 . 2 1 8 5.0 0.096 0.086 0.647 0.171 - 0 . 1 3 3 2.5 0.085 0.077 0.676 0.162 - 0 . 0 6 0 0.5 0.079 0.071 0.696 0.154 - 0 . 0 1 2 - 0 . 9 0.068 0.061 0.721 0.150 0.018 - 2 . 5 0.065 0.058 0.733 0.144 0.046 - 3.3 0.060 0.054 0.746 0.140 0.059 - 5.0 0.054 0.048 0.764 0.134 0.080 - 6 . 0 0.050 0.045 0.775 0.130 0.090
G. Ferretti and P.E. di Prampero / Respiration Physiology 99 (1995) 259-271 267
O
LI-
0.80
0.75 -
~ b P l ' ° 2 = 150 Torr
0.70
0,60065
". i l i ~ ) ~Pi,o2 = 130 Torr
%0,o,.
0.50
0.45
0.40
0,35
0.30
0.25
0.20
0.15
0.00
0.05
0%
~II~PL,o2 = 110 Torr
• A
A & & Z ~ Pt,o2 = 90 Torr
%
! I I I I I I
0.10
0.15
0.20
0.25
0,30
0.35
0.40
F V
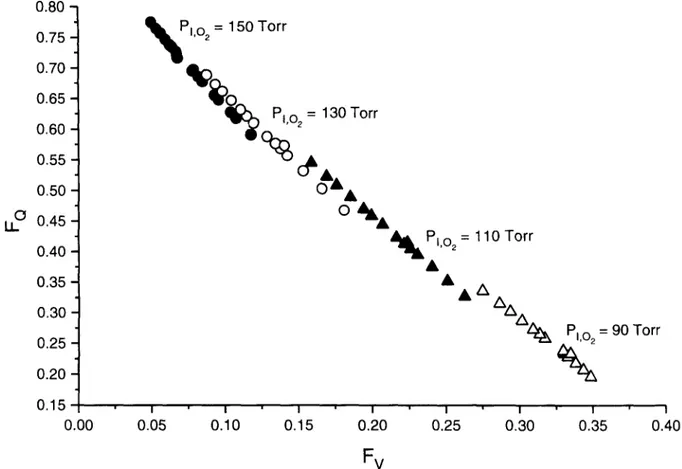
Fig. 4. Fractional limitation to Vo2 ... imposed by the circulatory resistance to 0 2 flow (FQ) as a function of fractional limitation to Vo ... imposed by the ventilatory resistance to 02 flow (Fv), at the indicated inspired Po. (Plo~).
observation that arterial 0 2 flow ((~ao2) during ex- ercise was related to the mechanical power output by a straight line with a slope equal to that of the VO 2 vs power (w) line (Ferretti et al., 1992). This implies that the difference between 0ao2 (w) and "~o2 (9¢), i.e. (~o~, is a constant. Yet hypoxia may interfere with the alleged control system of the cardiovascular response to exercise by hypoxaemic stimulation of peripheral chemoreceptors, that besides inducing hyperventilation, is known to affect the heart func- tion. This could lead to expect Pao2-related changes in 0V¢o. However, this is not the case, at least down to P]o: levels around 80 Torr (Ferretti et al., 1993). Obviously enough, the hypothesis of a constant 0V¢o~ must apply also when maximal 0 is let to vary freely. In the present study, however, also (~ has been forcefully maintained constant, in order to
stress the role of/~b in the RQ changes induced by varying Rv. As a consequence, C9o_ " turns out the same in all examined conditions. Yet, the constraint of a constant (~ at maximal exercise covers a great number of physiological conditions in which specific changes in either RQ or R v are induced (Dempsey et al., 1984; Ekblom et al., 1976; Turner et al., 1993). Also, maximal 0 in acute hypoxia is the same as in normoxia (Stenberg et al., 1966; Hartley et al., 1973).
7.2. Mitochondrial Po:
In this study, as in others (di Prampero and Ferretti, 1990; Wagner, 1993), Pmo2 is assumed to be zero. Of course, no direct support to this assump- tion can be obtained. Yet Po2 values of less than 3 Torr in the cytosol of contracting dog muscle fibres
268 G. Ferretti and P.E. di Prampero / Respiration Physiology 99 (1995) 259-271 EL- • R v / R v = ° 0 . 6 0 0.8 0.7 FO 0.6 0.5 0.4 0.3 F v 0.2 0.1 FL 0.070 ~ ~ . J . i • i . i , i , i , i . t 80 90 100 110 120 130 140 150 160 P I O 2 ( T o r r ) 0,8 0.7 0.6 0.5 0.4 u_- 0,3 0.2 , ¢ R v / R v = - 0 . 2 5 F Fv 0.1 0"070 ' 80/ , I i I i I , I , I , i , = , i 90 100 110 120 130 140 150 160 P I O 2 ( T o r r ) z X R v / R v = 1 . 0 0 0.8 t ~ R v / R v = 0 . 2 5 0.8 0 . 7 0.7 0,6 0 6 FQ FQ 0.5 0.5 0.4 0 4 LL- LL- 0.3 0.3 F v Fv 0.2 0.2 0.1 0.1 0,0 . i . i . i , J , 1 , i • i . i . i 0 . 0 , I i / , I , I . I , I . i . K , i 70 80 90 100 110 120 130 140 150 160 70 80 90 100 110 120 130 140 150 160
PIO 2 (Torr) PlO 2 (Torr)
Fig. 5. Fractional limitation to maximal 02 consumption imposed by the ith resistance to 02 flow (Fi) as a function of inspired Po2 (Plo2). Each panel applies for the induced change in ventilatory resistance (Rv) indicated on top. Curves referring to the fractional limitation to V o . . . . imposed by cardiovascular 02 transport (FQ), peripheral 02 transfer (Fp), pulmonary 02 transfer (FL) and alveolar ventila- tion (Fv) are shown.
G. Ferretti and P.E. di Prampero / Respiration Physiology 99 (1995) 259-271 269
have been reported (Gayeski and Honig, 1988), which indirectly argues in favour of the present as- sumption. In any case, a Pmo~ of 3 Torr, which seems to be an overestimate, would affect RT by no more than 3.4~, (at PIo~ = 90 Torr), with negligible effects on the fractional limitation o f ~/O~rnax'
7.3. Constano' of lung resistance to 0 2 f l o w
The assumption of a constant RL value has the clear advantage of allowing a neat identification of the strict connections existing between R v and RQ and of their effects on V o . . . . limitation. Yet this assumption represents an oversimplification. In fact it can be shown that (see e.g. Piiper and Scheid,
1981)
PAo 2 - Pao_, _ RL - exp ( DL°2~
PAo2 - PxTo2 RE + RQ (~'flbJ
(12) where DLo2 is the lung diffusing capacity for 02, whereby RL appears to be affected by fib. In the reference condition, the error introduced on RL by assuming RL constant, with present fib values, would be + 11.1°o, +23.87o and +37.17o a t P l o of130, 110 and 90 Torr, respectively. On the other hand taking a constant RL when varying R v in normoxia implies an error comprised between +9.5Yo and -7.7",o (two extremes of Rv). This error, however, disappears in hypoxia, as the oxygen dissociation curve approaches linearity.
These errors on RL would affect either Pa%, so that a different equilibrium is attained, with an RQ error compensating for the RL error, or RT, or both. The latter case would imply an underestimate of "¢o ... in the reference condition ( - 1 . 9 % , -4.3°0 and -6.87o at P I o " of 130, 110 and 90 Torr, respec- tively), with slight but unessential effects on the Fis and on the shape of the curves in Fig 5.
8. Physiological consequences and predictions
The results of Table 4 and Fig. 1 support the hypothesis that the lungs provide negligible Vo2ma x
limitation in normoxia. In fact, it appears that at least a 60°~0 reduction in Rv is required to obtain a
1 o 0 'o increase in Vo, m~×, and that a 10~o decrease in
R v results in a Vo2ma x change within the experi- mental error. This leads to the prediction that, if one reduces R v by means of almitrin bismesylate (Giesbrecht et al., 199l), or by breathing He-O2 mix- tures (Dempsey et al., 1984), very little Vo . . . . in- creases should be found in normoxia.
This prediction may be contradicted by endurance athletes, who have extremely high Vo~ma x and Q values. In fact, they were shown to undergo a sig- nificant arterial blood desaturation at maximal ex- ercise in normoxia (Dempsey et al., 1984; Williams et al., 1986) with Pao~ and S a o ' values around the steeper part of the 02 dissociation curve. As a con- sequence, in endurance athletes, ~/O2ma x in normoxia may increase significantly after a reduction in Rv. If this is so, (1) the fraction of ~z o . . . . limitation pro- vided by the lungs in endurance athletes would be greater than in sedentary subjects, and (2) the slope of the ~/O2ma x VS PIO ' relationship should be system- atically greater in endurance athletes than in seden- tary subjects, because of the respective different changes in Sao2. Although the latter hypothesis has not been systematically tested so far, it is not con- tradicted by the spotty data obtained by Terrados et al. (1985) at altitudes up to 1500 m, and by Lawler et al. (1988) in acute hypoxia ( P I o " of 106 Torr only). In hypoxia, as shown in Fig. 4, the role played by the lungs in limiting Vo~ma X increases and RQ is lower than in normoxia because of the increase in fib- AS a consequence, a new equilibrium along the res- piratory system is attained, whereby the factors lim- iting "qO~max may vary as indicated in Fig. 5. Fig. 5 has numerous physiological consequences. Firstly, in hypoxia: a reduction in Rv should have greater effects on Vo2max, the lower is PIo~ and thus Pao~. Second, the effects on 'qo ... of any manoeuvre acutely altering cardiovascular 02 transport, such as blood withdrawal or re infusion, should be less the lower is P I o . Furthermore, changes in active muscle mass and thus in total muscle blood flow, that affect Rp and RQ respectively, as occurs e.g. during exer- cise with small vs big muscle groups, should have smaller effects on Vo2m~ X in hypoxia than in nor- moxia. In other words, the differences in V o ... between one- vs two-leg exercise should be slightly reduced in hypoxia, whereby the Vo ... vs PI% re- lationship may be slightly different in the two exer- cise modes.
270 G. Ferretti and P.E. di Prampero / Respiration Physiology 99 (1995) 259-271
None of the above listed hypotheses have under- gone specific experimental verification so far, al- though some data in the literature, obtained for other purposes, appear compatible with them. After one week at 4300 m above sea level, one-leg ~'O2max was found to be 91 ~o of two-leg Vo2rnax , instead of 81 ~o in normoxia (Fulco et al., 1988). The same authors, however, failed in observing a different Wo2ma x ratio between the two exercise modes in acute hypoxia. In another context, Dempsey et al. (1984) were able to find greater changes in Vo2ma x after He-O2 breath- ing in hypoxia than in normoxia. These data, how- ever, are too sparse to provide sufficient experimen- tal background in support of the theoretical analysis carried out in the present study. To get this, one should (1) independently vary one of the physiologi- cal resistances to 0 2 flow represented in Eq. (1); (2) look at the changes.in resistance; (3) look at the resulting changes in Vo2max; (4) check whether sub- sequent, dependent changes in RQ may be respon- sible for some of the changes in Vo:ma x, (5) repeat the experiments in normoxia and hypoxia; (6) verify whether the changes in "V'o:max are compatible with the predictions resulting from the present study. No experiment so far was conceived and realised, that could fulfil all the conditions listed here above.
9. Conclusions
The present analysis shows that pulmonary ven- tilation and lung 0 2 transfer share a small fraction of ~'O2ma× limitation in normoxia, most of the limits being imposed by cardiovascular 02 transport (-,~ 70 ~o)- As PIo2 decreases, the role of the lungs in limiting ~'Qmax becomes greater and that of the car- diovascular system smaller, the lower is PIo. At PI% = 90 Torr, the lungs (pulmonary ventilation plus lung 02 transfer) account for the majority of the fractional limitation to ~'O2max, particularly in the range of low ventilation values. These results are a direct consequence of the non-linear blood 02 load- ing and unloading due to the sigmoidal shape of the 02 dissociation curve.
Acknowledgement
This study was supported by a grant from the Swiss Federal Sports Commission.
References
Blomqvist, C.G. and B. Saltin (1983) Cardiovascular adaptations to physical training. Ann. Rev. Physiol. 45: 169-189. Cerretelli, P. (1980). Gas exchange at altitude. In: Pulmonary Gas
Exchange. II. Organism and Environment, edited by J.B. West, New York, Academic Press, pp. 97-147.
Cerretelli, P. and P.E. di Prampero (1987). Gas exchange at ex- ercise. In: Handbook of Physiology, section 3: The Respiratory System, vol. IV: Gas Exchange, edited by L.E. Fahri and S.M. Tenney. Bethesda, MD: American Physiological Society, pp. 555-632.
Dempsey, J.A., P.G. Hanson and K.S. Henderson (1984). Ex- ercise induced arterial hypoxaemia in healthy human subjects at sea level. J. Physiol. (London) 355: 161-175.
di Prampero, P.E. (1985). Metabolic and circulatory limitations to X/O2ma x at the whole animal level. J. Exp. Biol. 115: 319- 331.
di Prampero, P.E. and G. Ferretti (1990). Factors limiting maxi- mal oxygen consumption in humans. Respir. Physiol. 80:113-
128.
Ekblom, B., G. Wilson and P.O. Astrand (1976). Central circu- lation during exercise after venesection and reinfusion of red blood cells. J. Appl. Physiol. 40: 379-383.
Ekblom, B. (1986). Factors determining maximal aerobic power. Acta. Physiol. Scand. (Suppl.) 556: 15-19.
Ferretti, G., B. Kayser, F. Schena, D.L. Turner and H. Hoppeler (1992). Regulation of perfusive 02 transport during exercise in humans: effects of changes in haemoglobin concentration. J. Physiol. (London) 455: 679-688.
Ferretti, G., B. Kayser and F. Schena (1993). Effects of hypoxia on cardiovascular oxygen transport in exercising humans. Pfltlgers Arch. 424: R21.
Fulco, C.S., P.B. Rock, L. Trad, V. Forte jr. and A. Cymerman (1988). Maximal cardiorespiratory responses to one- and two- legged cycling during acute and long-term exposure to 4300 meters altitude. Eur. J. Appl. Physiol. 57: 761-766.
Gayeski, T.E.J. and C.R. Honig (1988). Intracellular PO2 in long axis of individual fibers in working dog graeilis muscle. Am. J. Physiol. 254:H1179-H1186.
Giesbrecht, G.G., A. Puddy, M. Ahmed, M. Younes, N.R. Anthonisen (1991). Exercise endurance and arterial desatura- tion in normobaric hypoxia with increased chemosensitivity. J. Appl. Physiol. 70: 1770-1774.
Hartley, L.H., J.A, Vogel and H. Landowne (1973). Central, femoral and brachial circulation during exercise in hypoxia. J. Appl. Physiol. 34: 87-90.
Hill, A.V. and H. Lupton (1923). Muscular exercise, lactic acid and the supply and utilisation of oxygen. Q. J. Med. 16: 135- 171.
Lawler, J., S.K. Powers and D. Thompson (1988). Linear rela- tionship between Vo2nl~x and ~'%max decrement during expo- sure to acute hypoxia. J. Appl. Physiol. 64: 1486-1492. Margaria, R., F. Mangili, F. Cuttica, P. Cerretelli (1965). The
kinetics of oxygen consumption at the onset of muscular exer- cise in man. Ergonomics. 8: 49-54.
G. Ferretti and P.E. di Prampero / Respiration Physiology 99 (1995) 259-27l 271 in tissue gas exchange: blood-tissue equilibraton and diffusion
shunt. Respir. Physiol. 56:131-144
Piiper, J. and P. Scheid (1981). Model for capillary-alveolar equilibration with special reference to 02 uptake in hypoxia. Respir. Physiol. 46:193-208
Shephard, R.J. (1969). A non-linear solution of the 02 conduc- tance equation: applications to performance at sea level and at an altitude of 7,350 ft. Int. Z. Angew. Physiol. 27: 212-225. Siggaard-Andersen, O. and M. Siggaard-Andersen (1990). The oxygen status algorithm: a computer program for calculating and displaying pH and blood gas data. Scand. J. Clin. Lab, Invest. (Suppl.) 203: 29-45.
Stenberg, J., B. Ekblom and R. Messin (1966). Hemodynamic response to work at simulated altitude, 4000 m. J. Appl. Physiol. 21: 1589-1594.
Taylor, C.R. and E.R, Weibel (1981). Design of the mammalian respiratory system. I. Problem and strategy. Respir. Physiol. 44: 1-10.
Terrados, N., M. Mizuno and H. Andersen (1985). Reduction in maximal oxygen uptake at low altitudes: role of training status and lung function. Clin. Physiol. 5 (Suppl 3): 75-79. Turner, D.L., H. Hoppeler, C. Noti, H.P. Gurtner, H. Gerber, F.
Schena, B. Kayser and G. Ferretti (1993). Limitations to Vo2max in humans after blood retransfusion. Respir. Physiol. 92: 329-341.
Wagner, P.D. (1992). Gas exchange and peripheral diffusion limi- tation. Med. Sci. Sports. Exerc. 24: 54-58.
Wagner, P.D (1993). Algebraic analysis of the determinants of ~/O 2 . . . . . Respir. Physiol. 93: 221-237.
Ward, S.A. and P.A. Robbins (1987). The ventilatory response to hypoxia. In: The Control of Breathing in Man, edited by B.J. Whipp. Manchester: Manchester University Press, pp. 29-44. Williams, J., S. Powers and M. Sturat (1986). Hemoglobin de- saturation in highly trained athletes during heavy exercise. Med. Sci. Sports. Exerc. 18: 168-173.