“ADOLFO ZAMBELLI”
DOTTORATO DI RICERCA IN CHIMICA
XIVCICLO (Nuova serie)
F
LUORESCENCE-
BASED SENSORS FORTHE DETECTION OF BIOLOGICALLY AND ENVIRONMENTALLY RELEVANT
MOLECULES
Silvia Mirra
TUTORProf. Claudio Pellecchia
CO-TUTORS
Dott.ssa Mina Mazzeo Prof. Gerard Canters
COORDINATORE
Prof. Gaetano Guerra
Table of Contents
Chapter 1: Introduction ... 1
1.1. Physiological Implications... 1
1.2. Conventional Methods for H2S Detection ... 4
1.3. Fluorescent Molecular Probes ... 6
1.4. Aim of the Thesis ... 9
1.5. Reference List ... 9
Chapter 2: Cobaloximes as selective tools for H2S sensing ...12
2.1. Introduction... 12
2.2. Results and Discussion ... 13
2.2.1. [Co(dmgH)2(CH2CH3)(py)] ... 13
2.2.1.1. NMR Studies ... 14
2.2.1.2. Crystal Structure ... 21
2.2.1.3. ESI-MS Studies ... 23
2.2.1.4. Optical Studies ... 24
2.2.2. [Co(dfgH)2(CH2CH3)(py)] and [Co(dmgH)2(C6H5)(py)] ... 29
2.2.3. Conclusions ... 35
2.3. Reference List ... 36
Chapter 3: A Copper Porphyrin for Sensing H2S in Aqueous Solution via a “Coordinative-Based” Approach ...40
3.1. Introduction... 40
3.2.2. H2S Sensing ... 44
3.2.3. Conclusions ... 52
3.3. Reference List ... 52
Chapter 4: Azurin as a H2S Sensor...54
4.1. Introduction... 54
4.2. Results and Discussion ... 58
4.2.1. Azurin Wild Type ... 58
4.2.2. Cobalt-Azurin ... 61
4.2.3. Nichel-Azurin ... 70
4.2.4. Conclusions ... 70
4.3. Reference List ... 71
Chapter 5: Cyclam derivative for sensing hydrogen sulfide ...72
5.1. Introduction... 72
5.2. Results and Discussion ... 73
5.3. Conclusions ... 82
5.4. Reference List ... 82
Chapter 6: Concluding Remarks ...83
Chapter 7: Experimental Section ...83
7.1. General Comment ... 83
7.2. Cobaloximes ... 85
7.2.1. Synthesis of K[Co(dmgH)2(CH2CH3)(SH)] (2) ... 85
7.2.2. Synthesis of [Co(dfgH)2(CH2CH3)(py)] (4) ... 86
7.2.4. Determination of Polysulfide ... 87
7.2.5. Computational Details ... 88
7.2.6. Crystal Structure Determination ... 89
7.3. Porphyrin ... 96
7.3.1. Synthesis of CuPPIX ... 96
7.3.2. Fluorescence Quantum Yield ... 96
7.3.3. Polysulfides Determination ... 97
7.4. Azurin ... 97
7.4.1. Preparation of Azurin Metalloderivatives ... 97
7.4.2. Fluorescent Labeling of Proteins and Chromatography of Labeled Species ... 98 7.4.3. Control Experiments ... 99 7.5. Cyclam ... 99 7.5.1. Synthesis of Derivate 6 ... 99 7.5.2. Synthesis of Complex 7 ... 100 7.6. Reference List ... 100
d duplet
dfgH diphenhylglyoxime anion
DFT Density Functional Theory
dmgH dimethylglyoxime anion
ESI-MS Electrospray Ionization Mass Spectrometry
Et Ethyl
FRET Förster Resonance Energy Transfer
GSH Glutathione
HEPES 4-(2-hydroxyethyl)-1-piperazineethanesulfonic acid KPi Potassium Phosphate
L-Cys L-Cysteine
LMCT Ligand-to-Metal Charge Transfer
m multiplet
mins. Minutes
Mt-S Metal-sulfide
o.d. outside diameter
PET Photoinduced Electron Transfer
Ph Phenyl PPIX Protoporphyrin IX Py Pyridine, pyrene q Quartet rt. Room temperature s Singlet SR Switching Ratio t Triplet
1
Chapter 1:
IntroductionHydrogen sulfide (H2S) is a colorless and flammable gas with a characteristic odor of rotten eggs. Ambient air H2S comes from two different sources. Natural sources include bacteria, decomposition of organic matters, volcanic gases, natural gas and undersea vents. Industrial sources are petroleum refinery, rayon manufacturing, paper and pulp mill industry.1 Its danger for human body is because of its reducibility and high lipid solubility even at low levels. It is usually regarded as both an environmental and industrial pollutant.
1.1 Physiological Implications
Exposure to this gas can trigger eye and respiratory tract irritation, whereas inhalation of excess of H2S can result in loss of consciousness, respiratory failure, cardiac arrest, and, in extreme cases, death.2 Therefore, for centuries, hydrogen sulfide (H2S) has been viewed primarily as a noxious chemical species.3 More recent studies have broadened its traditional view as a noxious chemical species and patently established H2S as an essential physiological mediator and cellular signalling species. 4 It acts as the third endogenously generated gaseous signaling compound with
1
E. T. Kato Jr., C. M. P. Yoshida, A. B. Reis, I. S. Melo, T. T. Franco, Polym. Int.
2011, 60, 951.
2 J. R. Reiffenstein, W. C. Hulbert, S. H. Roth, Annu. Rev. Pharmacol. Toxicol.
1992, 32, 109.
3 (a) V. S. Lin, C. J. Chang, Curr. Opin. Chem. Biol. 2012, 16, 595; (b) R. P. Smith,
Can. Med. Assoc. J. 1978, 118, 775; (c) R. P. Smith, Am. Sci. 2010, 98, 6.
4
(a) L. Li, P. K. Moore, Trends Pharmacol. Sci. 2008, 29, 84; (b) L. Li, P. K. Moore, Biochem. Soc. Trans. 2007, 35, 1138; (c) R. Wang, Physiol. Rev. 2012, 92, 791.
2
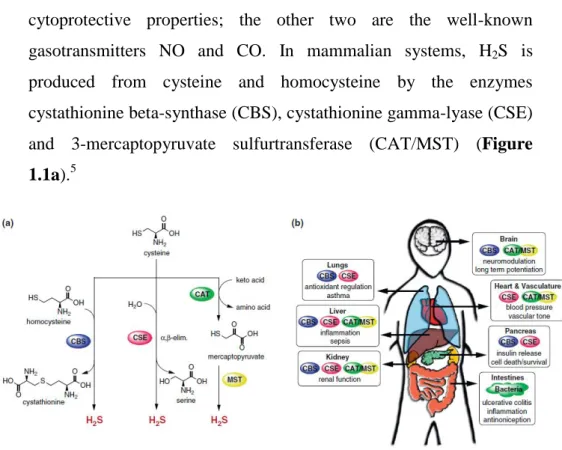
cytoprotective properties; the other two are the well-known gasotransmitters NO and CO. In mammalian systems, H2S is produced from cysteine and homocysteine by the enzymes cystathionine beta-synthase (CBS), cystathionine gamma-lyase (CSE) and 3-mercaptopyruvate sulfurtransferase (CAT/MST) (Figure
1.1a).5
Figure 1.1. Biology of H2S in the human body. (a) Major biochemical pathways for H2S
production. Cystathionine β-synthase (CBS) and cystathionine γ-lyase (CSE), are hemeproteins found in the cytoplasm and synthesize H2S. CBS primarily catalyzes the
formation of cystathionine from homocysteine and cysteine, whereas CSE facilitates the α,β-elimination of cysteine by water, producing serine and H2S. Cysteine aminotransferase
(CAT) and mercaptopyruvate sulfur transferase (MST), enzymes localized in the cytoplasm and mitochondria have also been identified as sources of H2S. CAT acts upon keto acids and
cysteine to yield mercaptopyruvate, from which H2S is released by MST. (b) Selected
physiological effects and biological roles of H2S in the human body and enzymes responsible
for H2Sproduction in various tissue types.
CBS is mostly found in the brain, nervous system, and liver, while CSE is predominantly found in the vasculature and liver and MST can be found in the brain and vasculature. However, all these enzymes are distribuited across many tissues and are often jointly
3
present (Figure 1.1b). Apart from enzymatic synthesis pathways, endogenous production of H2S can also occur through other non-enzymatic processes that are less well understood. Non-non-enzymatic production of H2S occurs through glucose,6 glutathione, inorganic polysulfides (present in garlic)7 and elemental sulfur. H2S is engaged in a number of physiological and pathological processes, such as cardiovascular protection, hypertension, relaxation, proliferation, apoptosis and inflammation processes. Previous reports have shown that cystathionine β-synthase gene, is overexpressed in Down’s syndrome.8 Inadequate levels of H2S are connected with Alzheimer’s disease and impaired cognitive ability; excessive H2S production may be responsible for the pathogenesis of other diseases such as diabetes. These preliminary studies have clearly established H2S as an essential physiological mediator and cellular signaling species,9 but our understanding of H2S chemistry and its far-ranging contributions to physiology and pathology is still mostly unknown.10 The complex biological roles of H2S and potential therapeutic implications constitute a challenging motivation for devising new ways to monitor its production, trafficking, and consumption in living systems.
6
D. G. Searcy, S. H. Lee, j. Exp. Zool. 1998, 282, 310. 7 A. J. Cooper, Annu. Rev. Biochem. 1983, 52, 187.
8 P. Kamoun, M. C. Belardinelli, A. Chabli, K. Lallouchi, B. Chadefaux-Vekemans,
Am. J. Med. Genet. A. 2003, 116A, 310.
9
Li L., Rose P., Moore P. K., Annu. Rev. Pharmacol. Toxicol. 2011, 51, 169. 10 J. Liu, Y. Q. Sun, J. Zhang, T. Yang, J. Cao, L. Zhang, W. Guo, Chemistry 2013,
4
1.2 Conventional Methods for H2S Detection
The determination of the physiological concentrations of H2S in specific tissue and in circulation is of crucial importance for determining the impact of H2S on a given physiological function. This allows us to correlate H2S levels with specific pathophysiological alterations, to examine physiological roles of H2S under in vitro conditions at organ, tissue, and cellular levels and to guide pharmacological and therapeutic administrations of H2S donors. Conflicting data exist on the H2S concentration in the tissues and blood of healthy subjects, with values ranging from 10-300 μM at values of two orders of magnitude lower. This discrepancy of data seems to be linked to the different methods used, with formation of numerous artifacts due to instability of the sulphides, the high volatility and the great susceptibility to oxidation of H2S. In addition, many papers do not distinguish between free H2S and sulphides acid-labile and no acid-acid-labile sulfides. With the pKa1 ~ 7.0 and the pKa2 > 17, there is essentially no S2- in biological tissues, almost the same amounts of H2S and HS- within the cell, and approximately a 20% H2S and 80% HS- in extracellular fluid and plasma at 37 °C and pH 7.4.11
Current literature reports several measurement techniques for H2S such as spectrophotometry,12 chromatography,13 and electrochemical
11 A. H. Nielsen, J. Vollertsen, T. Hvitved-Jacobsen, Water Environ. Res. 2006, 78, 275.
12
(a) E. A. Guenther, K. S. Johnson, K. H. Coale, Anal. Chem. 2001, 73, 3481; (b)
E. Fisher, Chem. Ber. 1883, 16, 2234; (c) J.K. Fogo, M. Popowsky, Anal. Chem.
5
techniques14 that detect forms of sulfide from different non-biological and biological sources like sewage, marine water, urine, feces, blood, serum, tissue and breath.15 These methods generally require cell lysis or destructive tissue preparation and yield a wide range of measured values for biological H2S concentrations. Although these techniques can garner useful information from biological samples, the real-time visualization of H2S in living intact specimens remains a significant challenge (Table 1.1).16
Table 1.1. Comparison of the current methods for H2S measurement.
13 (a) J. Furne, A. Saeed, M. D. Levitt, Am. J. Physiol. Regul. Integr. Comp.
Physiol. 2008, 295, R1479; (b) A. Tangerman, J. Chromatogr. 2009, B 877, 3366.
14
N. S. Lawrence, J. Davis, R. G. Compton, Talanta 2000, 52, 771. 15
T. Ubuka, T. Abe, R. Kajikawa, K. Morino, J. Chromatogr. B. Biomed. Sci. Appl.
2001, 757, 31.
6
1.3 Fluorescent Molecular Probes
Recently, fluorescence-based systems for H2S detection have been proposed as selective probes for biological applications.17 Reaction-based fluorescent probes offer the potential for sensitivity, selectivity, ease to application, biological compatibility and high signal-to-noise ratio, all of which enable the real-time visualization of H2S in living, intact specimens. As such, fluorescent molecular probes provide an attractive approach for the detection of H2S because of their molecular biocompatibility, cell permeability and high sensitivity. This reaction-based probes react chemoselectively with hydrogen sulfide to put in place a signal-producing molecular transformation. Reactions with H2S switch a probe from a non-fluorescent to a highly fluorescent molecule and this provide a sensitive optical signal (Figure 1.2), allowing visualization of biological molecules in real time using fluorescence microscopy.
Figura 1.2. Schematic representation of fluorescent sensor.
17 (a) T. Chen, Y. Zheng, Z. Xu, M. Zhao, Y. Xu, J. Cui, Tetrahedron Lett. 2013,
54, 2980; (b) M. Tropiano, S. Faulkner, Chem. Commun. 2014, 50, 4696; (c) I.
Takashima, M. Kinoshita, R. Kawagoe, S. Nakagawa, M. Sugimoto, I. Hamachi, A. Ojida, Chemistry 2014, 20, 2184.
7
Existing fluorescence-based probes implemented so far have been subdivided into four different categories (depending on the reaction mechanism by which analyte recognition occurs): (i) azide-to-amine reduction;18(ii) nucleophilic addition;19 (iii) copper displacement;20 and (iv) nitro-to-amine reduction21 (Figure 1.3). All the sensors belonging to the above categories make use of organic molecules that change their fluorescence intensity when interacting with H2S. H2S is an effective reducing and displays enhanced nucleophilicity compared to other thiols, likely due to its small size and lower pKa. Sensors belonging to category (iii) constitute an exception since in this case the molecule acting as the recognition element is a metal complex. Here, recognition builds on the displacement of the metal from the fluorophore’s environment to generally produce fluorescence turn-on changes via H2S mediated precipitation of Mt– S.22 Despite all the advantages of the above mentioned probes (e.g. high selectivity and sensitivity), some shortcomings typically involve slow response, irreversibility and poor water solubility.
18 (a) K. Zheng, W. Lin, L. Tan, Org. Biomol. Chem. 2012, 10, 9683; (b) Z. Wu, Z. Li, L. Yang, J. Han, S. Han, Chem. Commun. 2012, 48, 10120.
19 (a) C. Liu, B. Peng, S. Li, C. M. Park, A. R. Whorton, M. Xian, Org. Lett. 2012,
14, 2184; (b) Y. Zhao, X. Zhu, H. Kan, W. Wang, B. Zhu, B. Du, X. Zhang, Analyst 2012, 137, 5576.
20 (a) F. Hou, L. Huang, P. Xi, J. Cheng, X. Zhao, G. Xie, Y. Shi, F. Cheng, X. Yao, D. Bai, Z. Zeng, Inorg. Chem. 2012, 51, 2454; (b) M. Q. Wang, K. Li, J. T. Hou, M. Y. Wu, Z. Huang, X. Q. Yu, J. Org. Chem. 2012, 77, 8350.
21 (a) M. Y. Wu, K. Li, J. T. Hou, Z. Huang, X. Q. Yu, Org. Biomol. Chem. 2012,
10, 8342; (b) W. Xuan, R. Pan, Y. Cao, K. Liu, W. Wang, Chem. Commun. 2012, 48, 10669.
22 (a) L. E. Santos-Figueroa, C. de la Torre, S. El Sayed, F. Sancenon, R. Martinez-Manez, A. M. Costero, S. Gil, M. Parra, Eur. J. Inorg. Chem. 2014, 41–45; (b) Z. Ye, X. An, B. Song, W. Zhang, Z. Dai, J. Yuan, Dalton Trans. 2014, 43, 13055.
8
Figura 1.3. (i) Fluorescent probe SF1 is based on the H2S-mediated reduction of an aryl
azide to an aryl amine; (ii) dinitrophenyl ethers are suitable electrophilic triggers for fluorescent H2S probes and display selectivity for H2S versus a panel of other biological
nucleophiles; (iii) fluorescent sulfide sensor based on copper sulfide precipitation; (iv) the nitro-functionalized probe HSN1 undergoes selective reduction to an amine upon reaction with H2S with greater thiol cross reactivity than the analogous azide probe.
9
In the end, a key challenge for selective detection of H2S within the cellular milieu is the comparatively high concentrations of biological sulfur species such as glutathione as well as cysteine residues.
1.4 Aim of the Thesis
In my opinion a limitation of the fluorescent sensors developed so far is the irreversibility of the reaction by which H2S recognition occurs, which renders the devices not reusable. With a coordinative-based approach one may, in principle, be able to remove H2S from the metal center of the sensor and ensure a reversible H2S binding process. This would be advantageous for practical sensing applications allowing reusability of the sensing device. Knowing this, I try to improve H2S sensors focusing on designing new complexes, which could work by a coordinative-based approach.
1.5 Reference List
1. E. T. Kato Jr., C. M. P. Yoshida, A. B. Reis, I. S. Melo, T. T. Franco, Polym. Int. 2011, 60, 951.
2. J. R. Reiffenstein, W. C. Hulbert, S. H. Roth, Annu. Rev. Pharmacol. Toxicol. 1992, 32, 109.
3. (a) V. S. Lin, C. J. Chang, Curr. Opin. Chem. Biol. 2012, 16, 595; (b) R. P. Smith, Can. Med. Assoc. J. 1978, 118, 775; (c) R. P. Smith, Am. Sci. 2010, 98, 6.
4. (a) L. Li, P. K. Moore, Trends Pharmacol. Sci. 2008, 29, 84; (b) L. Li, P. K. Moore, Biochem. Soc. Trans. 2007, 35, 1138; (c) R. Wang, Physiol. Rev. 2012, 92, 791.
5. C. Q. Chen, H. Xin, Y. Z. Zhu, Acta Pharmacol. Sin. 2007, 28, 1709.
10
6. D. G. Searcy, S. H. Lee, j. Exp. Zool. 1998, 282, 310. 7. A. J. Cooper, Annu. Rev. Biochem. 1983, 52, 187.
8. P. Kamoun, M. C. Belardinelli, A. Chabli, K. Lallouchi, B. Chadefaux-Vekemans, Am. J. Med. Genet. A., 2003, 116A, 310. 9. Li L., Rose P., Moore P. K., Annu. Rev. Pharmacol. Toxicol.
2011, 51, 169.
10. J. Liu, Y. Q. Sun, J. Zhang, T. Yang, J. Cao, L. Zhang, W. Guo, Chemistry 2013, 19, 4717.
11. A. H. Nielsen, J. Vollertsen, T. Hvitved-Jacobsen, Water Environ. Res. 2006, 78, 275.
12. (a) E. A. Guenther, K. S. Johnson, K. H. Coale, Anal. Chem.
2001, 73, 3481; (b) E. Fisher, Chem. Ber. 1883, 16, 2234; (c) J.K. Fogo, M. Popowsky, Anal. Chem. 1949, 21, 732.
13. J. Furne, A. Saeed, M. D. Levitt, Am. J. Physiol. Regul. Integr. Comp. Physiol. 2008, 295, R1479; (b) A. Tangerman, J. Chromatogr. 2009, B 877, 3366.
14. N. S. Lawrence, J. Davis, R. G. Compton, Talanta 2000, 52, 771. 15. T. Ubuka, T. Abe, R. Kajikawa, K. Morino, J. Chromatogr. B.
Biomed. Sci. Appl., 2001, 757, 31.
16. T. Ubuka, Journal of Chromatography B, 2002, 781, 227.
17. (a) T. Chen, Y. Zheng, Z. Xu, M. Zhao, Y. Xu, J. Cui, Tetrahedron Lett. 2013, 54, 2980; (b) M. Tropiano, S. Faulkner, Chem. Commun. 2014, 50, 4696; (c) I. Takashima, M. Kinoshita, R. Kawagoe, S. Nakagawa, M. Sugimoto, I. Hamachi, A. Ojida, Chemistry 2014, 20, 2184.
18. (a) K. Zheng, W. Lin, L. Tan, Org. Biomol. Chem. 2012, 10, 9683; (b) Z. Wu, Z. Li, L. Yang, J. Han, S. Han, Chem. Commun.
11
19. (a) C. Liu, B. Peng, S. Li, C. M. Park, A. R. Whorton, M. Xian, Org. Lett. 2012, 14, 2184; (b) Y. Zhao, X. Zhu, H. Kan, W. Wang, B. Zhu, B. Du, X. Zhang, Analyst 2012, 137, 5576.
20. (a) F. Hou, L. Huang, P. Xi, J. Cheng, X. Zhao, G. Xie, Y. Shi, F. Cheng, X. Yao, D. Bai, Z. Zeng, Inorg. Chem. 2012, 51, 2454; (b) M. Q. Wang, K. Li, J. T. Hou, M. Y. Wu, Z. Huang, X. Q. Yu, J. Org. Chem. 2012, 77, 8350.
21. (a) M. Y. Wu, K. Li, J. T. Hou, Z. Huang, X. Q. Yu, Org. Biomol. Chem. 2012, 10, 8342; (b) W. Xuan, R. Pan, Y. Cao, K. Liu, W. Wang, Chem. Commun. 2012, 48, 10669.
22. (a) L. E. Santos-Figueroa, C. de la Torre, S. El Sayed, F. Sancenon, R. Martinez-Manez, A. M. Costero, S. Gil, M. Parra, Eur. J. Inorg. Chem. 2014, 41–45; (b) Z. Ye, X. An, B. Song, W. Zhang, Z. Dai, J. Yuan, Dalton Trans. 2014, 43, 13055.
12
Chapter 2:
Cobaloximes as selective tools for H2S sensing2.1. Introduction
In the human organism hydrogen sulfide can diffuse between blood and tissues or within cells and can be combined with metalloproteins,1 e.g. hemoglobin, methemoglobin, hematin, and cysteine residues leading to the formation of persulfides or sulfhydrated proteins.2 An important metal-containing and redox-active species present in the human organism is cobalamin (Figure
2.1), the cofactor of several coenzyme-B12-dependent enzymes.
Figure 2.1. Structure of B12-Cobalamin.
In spite of the controversy about its interaction with hydrogen sulfide, recent studies highlighted that cobalamin constitutes a valid approach to affect endogenous H2S concentration in clinical conditions (e.g.
1 (a) X. Bailly, S. J. Vinogradov, J. Inorg. Biochem. 2005, 99, 142; (b) R. E. Weber, S. N. Vinogradov, Physiol. Rev. 2001, 81, 569.
2 (a) A. K. Mustafa, M. M. Gadalla, N. Sen, S. Kim, W. Mu, S. K. Gazi, R. K. Barrow, G. Yang, R. Wang, S. H. Snyder, Sci Signal 2009, 2, ra72; (b) B. D. Paul, S. H. Snyder, Nat. Rev. Mol. Cell. Biol. 2012, 13, 499.
13
wherein systemic inflammation or ipoxia is present).3 In particular cobalamin has been reported to be able to enhance the natural ability of the plasma and supernatant of tissues to complex H2S.
Knowing that vitamin B12 is involved in the H2S transport,4 I decided to use vitamin’s models: cobaloximes 5 (Co(III) complexes of bis(dimethylglyoximate), Figure 2.2) to implement H2S sensors.
Figure 2.2. Structure of a generic cobaloxime [Co(dmgH)2L2].
These complexes are water soluble and easily synthesized. Both these conditions are highly desirable when implementing a sensing device.
2.2. Results and Discussion
2.2.1. [Co(dmgH)2(CH2CH3)(py)]
In the first year has been investigated the reaction of hydrogen sulfide with different alkyl cobaloximes. The first that has been examinated is the simplest, already known [Co(dmgH)2(CH2CH3)(py)] (1) (dmgH = dimethylglyoximate anion). This complex can be prepared converting a preformed chlorocobaloxime to a Co(I) species that, in
3 (a) A. Van de Louw, P. Haouzi, Critical Care 2012, 16, R178; (b) A. Van de Louw, P. Haouzi, Antioxid.Redox.Signal. 2013, 19, 510.
4
A. Van de Louw, P. Haouzi, ANTIOXIDANTS & REDOX SIGNALING 2012, 00, 1.
5 (a) P. J. Toscano, L. G. Marzilli, Prog. Inorg. Chem. 1984, 31, 105. (b) N. Bresciani-Pahor, M. Forcolin, L. G. Marzilli, L. Randaccio, M. F. Summers, P. J. Toscano, Coord. Chem. Rev. 1985, 63, 1.
14
basic conditions, has significant anionic character to react with the electrophilic ethyl iodide (Scheme 2.1).6
Scheme 2.1. Synthesis of [Co(dmgH)2(CH2CH3)(py)] (1). 2.2.1.1. NMR Studies
In the first instance, the reaction of complex 1 potassium hydrosulfide (KSH) was studied using NMR spectroscopy (Figure 2.3). It was previously reported that in coordinating solvents cobaloximes undergo solvolysis reactions in which the pyridine ligand is displaced by a molecule of solvent.7 Accordingly, in the 1H NMR spectrum of 1 recorded in D2O, two sets of resonances were detected indicating the presence of the solvated and pyridine-coordinated species. The addition of one equivalent of KSH to the NMR sample of 1 in D2O instantaneously led to the appearance of a new pattern of resonances. In particular in the aliphatic region of the spectrum, in addition to the signals due to the ethyl groups of 1 and the corresponding solvated species, a new A3X2 pattern was detected (Figure 2.3b), whereas in the aromatic region, the signals of the pyridine bound to the cobalt atom were flanked by the signal of the free pyridine.
6 B. D.
Gupta, K. Qanungo, J. Organomet. Chem. 1997, 543, 125.
7
(a) K. L. Brown, D. Lyles, M. Pencovici, R. G. Kallen, J. Am. Chem. Soc. 1975,
15
Figure 2.3. Aliphatic region of the 1H NMR spectrum of [Co(dmgH)2(CH2CH3)(py)] (1)
before (a) and after the addition of 1 (b) and 3 (c) equivalents of KSH ([1] = 34.5 mM, D2O,
rt, 400 MHz).
The coupling patterns between different signals were determined by a COSY experiment (Figure 2.4). By adding increasing equivalents of KSH, the amount of pyridine-bound and solvated species decreased, at the same time the amount of the new species increased. The reaction was completed when 5 equivalents of KSH were added to the NMR tube.
16
Figure 2.4. COSY spectrum of a mixture of 1 and KSH in a 1/1 molar ratio ([1] = 34.5 mM,
D2O, rt, 400 MHz). The assignment of the resonance is shown in Figure 2.2.
The oxime-proton in the cobaloxime has an acidic character, so it can be removed in alkaline solution. To exclude the possibility that the new species observed in the NMR spectrum comes from the deprotonation of cobaloxime by the HS- anion, the reaction was repeated with a solution of NaOH. Upon addition of increasing amounts of NaOH to a solution of 1 a drift of the resonances of the solvated species was observed. No evidence for the formation of the new species was found. It is reasonable to assume that the addition of KSH leads to the selective substitution of the axial ligand to form the corresponding hydrosulfide adduct. To assess whether the substitution reaction is carried out by HS- or H2S, DFT calculations were performed. In the first instance both possible adducts of 1, namely Co(dmgH)2(CH2CH3)(H2S) and [Co(dmgH)2(CH2CH3)(HS)]-, were successfully optimized. In each species, the geometry of the Co atom is best described as a distorted octahedron with ligand-cobalt
17
bond distances very similar to those observed in the X-ray structure of 1.8 In the H2S-adduct, the Co-S bond length of 2.45 Å compares favourably with the metal-sulfur bond lengths observed in the X-ray structures of H2S adducts reported in the literature, all of which are ruthenium(II) complexes.9 The S-H bonds are slightly polarized as reflected by the increase of the bond length from 1.33 Å10 in gaseous H2S to 1,36 Å in the coordinated H2S. In the HS--adduct, the HS -anion is located at 2.40 Å from the metal centre. This bond distance is slightly longer than the M-S bond distance in metal complexes with bridging SH- groups – this bond distance ranges between 2.34 and 2.38 Å in the cluster [Co3(μ3-S)- (μ3-SH)2-(μ-PEt2)(PHEt2)6][ClO4]211 and between 2.33 and 2.36 Å in the cationic iron complex [Fe2
(μ-SH)3(triphos)2] [triphos =
bis-(2-diphenylphosphinoethyl)phenylphosphine].12 Even though the H2 S-adduct is predicted to be stable, its formation starting from the pyridine-adduct 1, is not favoured, As a matter of fact the substitution reaction of pyridine by H2S (reaction (1)) was predicted to be endoergonic by 54.8 kJ mol-1. HS- is an electron pair donor more
8 (a) P. J. Toscano, G. Marzilli, Prog. Inorg. Chem. 1984, 31, 105; (b) N. Bresciani-Pahor, M. Forcolin, L. G. Marzilli, L. Randaccio, M. F. Summers, P. J. Toscano,
Coord. Chem. Rev. 1985, 63, 1.
9
(a) S. L. Chatwin, R. A. Diggle, R. F. Jazzar, S. A. MacGregor, M. F. Mahon, M. K. Whittlesey, Inorg. Chem. 2003, 42, 7695; (b) D. C. Mudalige, E. S. Ma, S. J. Rettig, B. R. James, W. C. Cullen, Inorg. Chem. 1997, 36, 5426; (c) D. Sellman, P. Lechner, F. Knoch, M. Moll, J. Am. Chem. Soc. 1992, 114, 922.
10 T. H. Edwards, N. K. Moncur, L. E. Snyder, J. Chem. Phys. 1967, 46, 2139. 11 C. A. Ghilardi, S. Midollini, A. Orlandini, G. Scapacci, J. Chem. Soc., Dalton
Trans. 1992, 2909.
18
effective than H2S, the substitution of pyridine by the hydrogen sulfide anion (reaction (2)) was predicted to be exergonic by -15.1 kJ mol-1.
Co(dmgH)2(Et)(py) + H2S → Co(dmgH)2(Et)(H2S) + py (1)
Co(dmgH)2(Et)(py) + HS- → Co(dmgH)2(Et)(HS)- + py (2)
Analogous results were obtained if the solvated species, Co(dmgH)2(CH2CH3)(H2O), was considered as the starting reagent – the substitution of H2O by H2S (reaction (3)) was predicted to be endergonic by 25.5 kJ mol-1 while the substitution of H2O by HS -(reaction (4)) was predicted to be exergonic by -33.9 kJ mol-1.
Co(dmgH)2(Et)(H2O) + H2S → Co(dmgH)2(Et)(H2S) + H2O (3)
Co(dmgH)2(Et)( H2O) + HS- → Co(dmgH)2(Et)(HS)- + H2O (4)
The substitution of the axial ligand of 1 should be promoted only by the HS- anion; this finding is consistent with the results of a recent study on the different reactivity of HS- and H2S species toward metal centers in which it was shown that zinc(II) and cobalt(II) phtalocyanine complexes react whit HS- but not whit H2S.13 In order to verify if 1 and the hydrosulfide-bound complex [Co(dmgH)2(CH2CH3)(SH)]- (2) are in equilibrium, a 1H-1H EXSY experiment was perfomed on a solution containing the complexes 1 and 2 in equimolar amounts. In the corresponding spectrum positive
13
M. D. Hartle, S. K. Sommer, S. R. Dietrich, M. D. Pluth, Inorg. Chem. 2014, 53, 7800.
19
cross-peaks correlating complex 1 (the pyridine-bound complex and the solvated one) with complex 2 were clearly odserved (Figure 2.5).
Figure 2.5. EXSY spectrum of a mixture of 1 and KSH in a 1/1 molar ratio (D2O, rt, 400
MHz). The assignment of the resonance is shown in Figure 2.2.
This indicates that species actually are in the slow exchange regime as depicted in Scheme 2.2.
20
With these results, the synthesis of the hydroulfido-complex K[Co(dmgH)2(CH2CH3)(SH)] (2) was attempted on a preparative scale. The treatment of complex 1 with 10 equivalents of KSH in a water-methanol solution at room temperature afforded an orange powder, the 1H NMR spectrum of which was perfectly superimposable with that observed for the species generated in situ (Figure2.6). In addition a broad singolet was detected at 2.5 ppm that can be attributed to the resonance of the HS- group on the basis of literature data.14
Figure 2.6. 1H NMR spectrum of K[Co(dmgH)2(CH2CH3)(SH)] (2) in methanol-d4 (rt, 400
MHz).
14
A. Müller, E. Diemann, in Comprehensive coordination chemistry, ed. G. Wilkinson, R. D. Gillard, J. A. McCleverty, Pergamon Press, Oxford, UK, 1987, ch. 161, vol 2.
21
2.2.1.2. Crystal Structure
Despite several attempts, we could not obtain single crystals of 2 suitable for X-ray structure analysis. In one of the crystallization tests, an unexpected trisulfido-bridged dinuclear complex K2[Co2(dmgH)2(CH2CH3)2(μ-S3)] (3) was isolated and structurally characterized (Figure 2.7). The crystal were produced by the direct reaction of 1 with KSH in MeOH/Et2O over two weeks. In this species two cobaloxime units are axially bridged together with a trisulfide anion (S32-).
Figure 2.7. ORTEP xiew of the anionic complex [Co2(dmgH)4(CH2CH3)2(μ-S3)]
with the thermal ellipsoids at 30% probability.
The geometry around each Co atom is a distorted octahedron with four nitrogens of the dimethylglyoximato ligands in the equatorial plane and a sulphur atom of the trisulfide moiety and an ethyl group axially coordinated. The Co1 and Co2 atoms deviate from the equatorial planes formed by the four nitrogen atoms by only
22
0.0222(2) and 0.0308(2) Å, towards the S1 and S3 sulphur atoms, respectively. For the Co1 cobaloxime unit, the chelate rings defined by N1, N2, C1, C2 and N3, N4, C3, C4 atoms are bent by 1.23(7) and 4.55(8)° with respect the equatorial plane towards the S1 atom, while for the Co2 cobaloxime unit the corresponding bent angles are 5.58(9) and 0.99(7)° towards the S3 atom. The two coordination basal planes are almost parallel forming a dihedral angle of 8.96(6)°. The Co1-S1 and Co2-S3 bond distances of 2.3902(5) and 2.3757(5) Å, respectively can be compared with Co-S distance of 2.342(2) Å observed in a Co-(dmgH)2 complex having an ethanethiolate group in axial position trans to a CH3 group.15 This complex displays very short O-H…O intramolecular hydrogen bonds with O…O distances in the range 2.474(2)-2.516(2) Å, typical for this kind of compounds. Both potassium cations are hexa-coordinated: K1 by three oxygens of the dimethylglyoximato ligands, two sulfur atoms and a water molecule, while K2 is coordinated by two oxygens of the dimethylglyoximato ligands, a sulfur atom and three water molecules. All the other structural parameters are in good agreement with those observed for other similar complexes.
Solutions of hydrogen sulfide are unstable; in the presence of atmospheric oxygen, HS- is slowly converted into a complicated mixture of several partially oxidized sulfur species such as elemental sulfur, sulfite, thiosulfate, tetrathionate, sulfate and polysulfides ions.16 It was also reported that the oxidation of HS- to polysulfides
15
S. M. Polson, L. Hansen, L. G. Marzilli, Inorg. Chem. 1997, 36, 307. 16
(a) K. Y. Chen, J. C. Morris, Environ. Sci. Technol. 1972, 6, 529; (b) D. J. O’Brien, F. B. Birkner, Environ. Sci. Technol. 1977, 11, 1114.
23
can be promoted by traces of metals.17 To determine whether the formation of the S32- anion was catalyzed by complex 1, we carried out a reaction in water with a 1/KSH molar ratio of 1/50 at room temperature under aerobic conditions and analyzed the product mixtures sampled from the reactor at certain reaction times.18 It is worth noting that freshly prepared solutions of KSH or other H2S donors commonly contain low quantities of the S22- anion.19 In my experiments its amount slowly increased over the days, whereas the S32- anion was detected only after four days of reaction. The same polysulfide distributions were found in a solution of KSH used as a blank. We can reasonably assume that the formation of the trisulfide anion found in 3 is not mediated by the cobalt complex 1.
2.2.1.3. ESI-MS studies
In the negative ion ESI-MS spectrum two ions at m/z 351.5 and 322.4
are consistent with the coordinated HS- anions
[Co(dmgH)2(CH2CH3)(SH)]- and [Co(dmgH)2(SH)]- (Figure 2.8).
17
(a) M. R: Hoffmann, B. C. Lim, Environ. Sci. Technol. 1979, 13, 1406; (b) A. P. Hong, S. D. Boyce, M. R. Hoffmann, Environ. Sci. Technol. 1989, 23, 533; (c) S. M. Chen, S. W. Chiu, J. Mol. Catal. A: Chem. 2001, 166, 243.
18 I. Filipponen, A. Guerra, A. Hai, L. A. Lucia, D. S. Argyropoulos, Ind. Eng.
Chem. Res. 2006, 45, 7388; (b) D. S. Argyropoulos, Y. Hou, R. Ganesaratnam, D.
N. Harpp, K. Koda, Holzforschung, 2005, 59, 124. 19
(a) M. N. Hughes, M. N. Centelles, K. P. Moore, Free Radical Biol. Med. 2009,
47, 1346; (b) J. I. Toothey, Anal. Biochem. 2011, 413, 1; (c) R. Greiner, Z.
Pálinkás, K. Bäsell, D. Becher, H. Antelmann, P. Nagy, T. P. Dick, Antioxid. Redox
24
Figure 2.8. Electrospray mass spectra (negative-ion mode) of K[Co(dmgH)2(CH2CH3)(SH)]
(2) in methanol.
2.2.1.4. Optical Studies
Optical sensors are a type of chemical sensors which act on the basis of changes in the optical properties. Optical properties are changed because of the interaction between the analyte and the receptor. Aimed to test the principal usability of the system as an optical sensor, in the first instance the H2S binding to the ethyl-cobaloxime complex has been studied by UV-visible spectroscopy. In such way it was possible to determine at which wavelengths the maximum change in the absorbance occurs. Thus, the fluorescence spectra were detected at this wavelength. When KSH (a commonly employed H2S donor) was added to a MilliQ water solution of the ethyl-cobaloxime
25
complex, the absorption spectrum significantly changed. Specifically, while the absorption spectrum of the free complex exhibits a band at 230 nm and three less intense bands centered at 285, 398 and 450 nm, H2S addition quenches the 398 nm band and leads to the appearance of a new band centered at 330 nm (that can be assigned to S → Co(III) ligand-to-metal charge transfer (LMCT) transition on the basis of analogy with other Co(III) complexes)20 whereas the 230 nm band becomes consistently more intense (Figure 2.9)
Figure 2.9. Electronic absorption spectra of [Co(dmgH)2(CH2CH3)(py)] (1) (rt, black line,
3.2 x 10⁻⁵ M, H2O) and after addition of KSH (rt, red line, 3.2 x 10 -5
M, H2O).
To assess whether the absorption spectrum of the ethyl-pyridine complex varies with the concentration of the analyte, UV-vis spectra of the system were recovered after the addition of increasing amounts
20 (a) K. L. Brown, R. G. Kallen, J. Am. Chem. Soc. 1972, 94, 1894; (b) G. Pellizer, G. R. Tauszik, G. Costa, J. Chem. Soc., Dalton Trans. 1973, 317; (c) T. C. Higgs, D. Ji, R. S. Czernuszewicz, B. F. Matzanke, V. Schunemann, A. X. Trautwein, M. Helliwell, W. Ramirez, C. Carrano, J. Inorg. Chem. 1998, 37, 2383.
26
of KSH solution. Figure 2.10 shows that there is a clear dependence of the absorption spectrum of the ethyl-pyridine complex on the KSH concentration (from 3.2 x 10⁻⁵ M to 1.0 x 10⁻³ M).
Figure 2.10. Electronic absorption spectra of [Co(dmgH)2(CH2CH3)(py)] (1) (rt, 3.2 x 10 -5
M, H2O) upon addition of increasing concentrations of KHS (from 3.2 x 10⁻⁵ M to 1.0 x 10⁻³
M).
The same spectrum is acquired for the adduct obtained on a preparative scale (Figure 2.11).
27
Figure 2.11. Electronic absorption spectra of K[Co(dmgH)2(CH2CH3)(SH)] (2) (rt, 3.2 x 10⁻⁵
mMblack line, 3.2 x 10⁻⁴ mM red line, H2O).
To obtain an indication on the selectivity of the construct, the absorption spectrum of the system was checked in the presence of biologically relevant and potentially competing thiols. In the presence of either GSH or L-cys or Na2S2O3 or NaSCN no significant shifts could be observed (Figure 2.12). These findings clearly evidence the high selectivity of the system over other biologically related species.
28
Figure 2.12. Relative Absorbance at 330 nm of [Co(dmgH)2(CH2CH3)(py)] (1) (3.2 x 10⁻⁵
M) in the presence of KSH (3.2 x 10⁻⁴ M), glutathione (GSH), cysteine, S2O32-, SCN– (3.2 x
10-4 M) in an aqueous solution.
To exclude that the modification of the absorption spectrum of the ethyl-pyridine complex in the presence of increasing amounts of KSH could be only due to the changing of the pH of the sample solution, we measured the UV-vis spectrum of the system in the presence of an excess of NaOH or HCOOH. No changes could be observed (Figure
2.13).
Figure 2.13. Electronic absorption spectra of [Co(dmgH)2(CH2CH3)(py)] (1) (rt, black line,
3.2 x 10⁻⁵ M, H2O) and after addition of (a) NaOH (rt, red line, 3.2 x 10 -4
M, H2O) and (b)
HCOOH (rt, green line, 3.2 x 10⁻⁴ M, H 2O).
Despite the great potential of complex 1 as H2S sensor (e.g. water solubility, high selectivity for H2S over several biologically relevant thiols, easy of synthesis) the lack of a consistent fluorescence response on the KSH concentration constitutes a limitation of the present system. Therefore it has been thought of modifying the framework of complex 1 to implement a fluorescent H2S sensor.
29
2.2.2. [Co(dfgH)2(CH2CH3)(py)] and [Co(dmgH)2(ph)(py)] Then, making appropriate modifications, other two complexes were synthetized. In the first case we chose to replace the equatorial dimethylglyoxime ligand with another which contained potentially fluorescent groups, such as the diphenylglyoxime, thus obtaining complex 4 ([Co(dfgH)2(CH2CH3)(py)]). In the second case one of the axial ligands has been modified, replacing the ethylenic moiety with a phenyl, obtaining the formation of the complex 5 ([Co(dmgH)2(ph)(py)]). Complexes 4 and 5 were prepared in good yields (75% for complex 4 and 46%) by following synthetic procedures similar to that of complex 1 (Scheme 2.3).
Scheme 2.3. (a) Synthesis of [Co(dfgH)2(CH2CH3)(py)] (1); (b) Synthesis of
[Co(dmgH)2(C6H5)(py)].
Slow cooling of saturated methanol solutions of complex 4 yielded single crystals suitable for X-ray diffraction (Figure 2.14).
30
Figure 2. 14. ORTEP xiew of the anionic complex [Co(dfgH)2(CH2CH3) (py)].
H2S binding to complex 4 was first assessed by UV/Vis spectroscopy. Adding KSH to a methanolic solution of 4 a clear change of the initial spectrum was observed. Figure 2.15 shows a typical UV/Vis spectrum of a solution containing 1.5∙10–5 M of [Co(dfgH)2(CH2CH3)(py)] in which the increase of the band at 280 nm is particularly evident.
31
Figure 2. 15. Electronic absorption spectra of [Co(dfgH)2(CH2CH3)(py)] (4) (rt, black line,
1.5∙10-5 M, MeOH) and after addition of KSH (rt, red line, 7.5∙10-5 M, MeOH).
Pronounced changes were observed also in the fluorescence response. Exciting the wavelength at which we observe the maximum variation in absorption (280 nm), addition of KSH to a methanol solution of complex 4 resulted in a consistent quenching of the fluorescence intensity (SR ~ 50% ; see Figure 2.16).
300 400 500 600 700 800 0 200 400 600 800 Complex HS- free Complex HS- bound fluore sc ence intens ity wavelength (nm)
Figure 2. 16. Emission spectra of [Co(dfgH)2(CH2CH3)(py)] (4) (λexc = 280 nm) before and
after addition of an excess of KSH.
When increasing amounts of KSH were added and the fluorescence intensities were monitored, a progressive quenching was observed (Figure 2.17).
32
Figure 2.17. Emission spectra of [Co(dfgH)2(CH2CH3)(py)] (4) (λexc = 280 nm, rt, 3.9 x 10⁻⁶
M, MeOH) upon addition of increasing concentrations of KHS (from 1.8 x 10⁻⁵ M to 1.8 x 10⁻⁴ M).
When the fluorescence intensity values were plotted against the KSH
concentrations, a linear fit was observed (Figure 2.18).
0 50 100 150 200 400 500 600 700 800 900 F 302 [KSH] (10-6 M)
Figure 2.18. The relationship between the fluorescence intensity (λem = 302 nm) and the
33
To gain insight in the binding mode of H2S to complex 4 1H NMR experiment was taken. The 1H NMR spectrum of 4 recorded in CD3OD shows two sets of resonances, for the solvated and pyridine-coordinated species (black spectra,below). The addition of one equivalent of KSH to the NMR sample of 1 in CD3OD led to the appearance of a new pattern of resonances (red spectra, above). In particular in the aliphatic region of the spectrum, in place of the signals due to the ethyl groups of 4 and the corresponding solvated species, a new A3X2 pattern was detected (Figure 2.19).
Figure 2.19. Aliphatic region of the 1H NMR spectrum of [Co(dfgH)2(CH2CH3)(py)] (4)
before (a) and after the addition of 1 (b) equivalent of KSH ([4] = 7.7∙10-6 M, CD3OD, rt,
400 MHz).
Differently than in the case of complex 4 for complex 5 was possible to obtain a KSH-dependent fluorescence response in Milli-Q water solution. Again a fluorescence quenching (SR ~ 40%) was observed when adding an excess of KSH to complex 5 (Figure 2.20), even if lower than that obtained with the complex 4.
34 400 600 800 0 20 40 60 Complex HS- free Complex HS- bound fluore sc ence intens ity wavelength (nm)
Figure 2. 20. Emission spectra of [Co(dmgH)2(ph)(py)] (4) (λexc = 314 nm) before and after
addition of an excess of KSH.
Also with this complex, when increasing amounts of KSH were added, a progressive quenching of fluorescence was observed (Figure
2.21).
Figure 2.21. Emission spectra of [Co(dmgH)2(ph)(py)] (4) (λexc = 250 nm, rt, 2.7 x 10⁻⁶ M,
35
For both complex 4 and complex 5 in the presence of either L-cysteine or glutathione, was observed SRs significantly lower than those found with KSH (Figure 2.22).
Figure 2.22. The relationship between the fluorescence intensity ((a) [4] = 3.9∙10-6 M, λem =
302 nm; (b) [5] = 2.7∙10-6 M, λem = 250 nm); and the concentrations of KSH, cysteine,
glutathione ((a) from 1.8∙10-5 M to 1.8∙10-4 M, (b) from 1.4∙10-6 M to 1.1∙10-4 M).
2.2.3. Conclusions
In summary the potential of a family of model complexes of Vitamin B12 has been investigated as H2S sensors in aqueous solution. Clear evidence that complex 1 can be successfully used for the optical detection of H2S has been provided. High selectivity of the devised construct over potentially competing thiols and other biologically related species has been also shown. To gain further insights in the mechanism of recognition of H2S mono-dimensional and bi-dimensional NMR experiments were performed. DFT calculations shed further light on the binding mechanism of H2S to the title complex. However, the main limit of the complex 1 is the lack of fluorescence response. Efforts to modify the skeleton of the devised
36
construct to translate the absorption information into fluorescence information led to two new fluorescent H2S sensor (complex 4 and complex 5). In particular complex 5 works successfully in water. However, these complexes show a turn-off fluorescence response, that is not the most satisfactory for our purpose. Indeed, energy transfer, collisional quenching and photobleaching can also led to a fluorescence turn-off.
2.3. Reference List
1. (a) X. Bailly, S. J. Vinogradov, J. Inorg. Biochem. 2005, 99, 142; (b) R. E. Weber, S. N. Vinogradov, Physiol. Rev. 2001, 81, 569. 2. (a) A. K. Mustafa, M. M. Gadalla, N. Sen, S. Kim, W. Mu, S. K.
Gazi, R. K. Barrow, G. Yang, R. Wang, S. H. Snyder, Sci Signal
2009, 2, ra72; (b) B. D. Paul, S. H. Snyder, Nat. Rev. Mol. Cell.
Biol. 2012, 13, 499.
3. (a) A. Van de Louw, P. Haouzi, Critical Care 2012, 16, R178; (b)
A. Van de Louw, P. Haouzi, Antioxid.Redox.Signal. 2013, 19, 510.
4. A. Van de Louw, P. Haouzi, ANTIOXIDANTS & REDOX SIGNALING 2012, 00, 1.
5. (a) P. J. Toscano, L. G. Marzilli, Prog. Inorg. Chem. 1984, 31,
105; (b) N. Bresciani-Pahor, M. Forcolin, L. G. Marzilli, L. Randaccio, M. F. Summers, P. J. Toscano, Coord. Chem. Rev.
1985, 63, 1.
6. B. D. Gupta, K. Qanungo, J. Organomet. Chem. 1997, 543, 125.
7. (a) K. L. Brown, D. Lyles, M. Pencovici, R. G. Kallen, J. Am. Chem. Soc. 1975, 97, 7338; (b) K. L. Brown, A. W. Awtrey, Inorg. Chem. 1978, 17, 111.
37
8. (a) P. J. Toscano, G. Marzilli, Prog. Inorg. Chem. 1984, 31, 105; (b) N. Bresciani-Pahor, M. Forcolin, L. G. Marzilli, L. Randaccio, M. F. Summers, P. J. Toscano, Coord. Chem. Rev. 1985, 63, 1. 9. (a) S. L. Chatwin, R. A. Diggle, R. F. Jazzar, S. A. MacGregor,
M. F. Mahon, M. K. Whittlesey, Inorg. Chem. 2003, 42, 7695; (b) D. C. Mudalige, E. S. Ma, S. J. Rettig, B. R. James, W. C. Cullen, Inorg. Chem. 1997, 36, 5426; (c) D. Sellman, P. Lechner, F. Knoch, M. Moll, J. Am. Chem. Soc. 1992, 114, 922.
10. T. H. Edwards, N. K. Moncur, L. E. Snyder, J. Chem. Phys. 1967, 46, 2139.
11. C. A. Ghilardi, S. Midollini, A. Orlandini, G. Scapacci, J. Chem. Soc., Dalton Trans. 1992, 2909.
12. M. di Vaira, S. Midollini, L. Sacconi, Inorg. Chem. 1979, 18, 3466.
13. M. D. Hartle, S. K. Sommer, S. R. Dietrich, M. D. Pluth, Inorg. Chem. 2014, 53, 7800.
14. A. Müller, E. Diemann, in Comprehensive coordination chemistry, ed. G. Wilkinson, R. D. Gillard, J. A. McCleverty, Pergamon Press, Oxford, UK, 1987, ch. 161, vol 2.
15. S. M. Polson, L. Hansen, L. G. Marzilli, Inorg. Chem. 1997, 36, 307.
16. (a) K. L. Brown, R. G. Kallen, J. Am. Chem. Soc. 1972, 94, 1894; (b) G. Pellizer, G. R. Tauszik, G. Costa, J. Chem. Soc., Dalton Trans. 1973, 317; (c) T. C. Higgs, D. Ji, R. S. Czernuszewicz, B. F. Matzanke, V. Schunemann, A. X. Trautwein, M. Helliwell, W. Ramirez, C. Carrano, J. Inorg. Chem. 1998, 37, 2383.
17. M. Frisch, G. W. Trucks, H. B. Schlegel, G. E. Scuseria, M. A. Robb, J. R. Cheeseman, G. Scalmani, V. Barone, B. Mennucci, G. A. Petersson, H. Nakatsuji, M. Caricato, X. Li, H. P. Hratchian, A. F. Izmaylov, J. Bloino, G. Zheng, J. L. Sonnenberg, M. Hada,
38
M. Ehara, K. Toyota, R. Fukuda, J. Hasegawa, M. Ishida, T. Nakajima, Y. Honda, O. Kitao, H. Nakai, T. Vreven, J. A. Montgomery Jr., J. E. Peralta, F. Ogliaro, M. Berpark, J. J. Heyd, E. Brothers, K. N. Kudin, V. N. Staroverov, R. Kobayashi, J. Normand, K. Raghavachari, A. Rendell, J. C. Burant, S. S. Iyengar, J. Tomasi, M. Cossi, N. Rega, J. M. Millam, M. Klene, J. E. Knox, J. B. Cross, V. Bakken, C. Adamo, J. Jaramillo, R. Gomperts, R. E. Stratmann, O. Yazyev, A. J. Austin, R. Cammi, C. Pomelli, J. W. Ochterski, R. L. Martin, K. Morokuma, V. G. Zakrzewski, G. A. Voth, P. Salvador, J. J. Dannenberg, S. Dapprich, A. D. Daniels, O. Farkas, J. B. Foresman, J. V. Ortiz, J. Cioslowski, D. J. Fox, Gaussian 09, revision A.02, Gaussian, Inc., Wallingford, CT, 2009.
18. A. D. Becke, Phys. Rev. A: At., Mol., Opt. Phys. 1988, 38, 3098. 19. (a) J. P. Perdew, Phys. Rev. B: Condens. Matter, Mater. Phys.
1986, 33, 8822; (b) J. P. Perdew, Phys. Rev. B: Condens. Matter
Mater. Phys. 1986, 34, 7406.
20. J. Tomasi, B. Mennucci, R. Cammi, Chem. Rev. 2005, 105, 2999. 21. The solvent-corrected Gibbs free energies = gas-phase Gibbs free
enrgies + (solvent-phase electronic energies – gas-phase electronic energies).
22. Z. Otwinowski, W. Minor, in Methods in Enzymology, Part A, ed. C. W. Carter and R. M. Sweet, Academic Press, London, 1997, 276, 307.
23. R. H. Blessing, Acta Crystallogr., Sect. A: Found. Crystallogr.
1995, 51, 33.
24. A. Altomare, M. C. Burla, M. Camalli, G. L. Cascarano, C. Giacovazzo, A. Guagliardi, A. G. Moliterni, G. Polidori, R. Spagna, J. Appl. Crystallogr. 1999, 32, 115.
39
25. G. M. Sheldrick, SHELX-97, Program for Crystal Structure Refinement, University of Gottingen, Germany, 1997.
26. M. Nardelli, J. Appl. Crystallogr. 1995, 28, 659. 27. L. J. Farrugia, J. Appl. Crystallogr. 1999, 32, 837.
40
Chapter 3:
A Copper Porphyrin for Sensing H2S in AqueousSolution via a “Coordinative-Based” Approach 3.1. Introduction
It is well known that H2S can bind to heme proteins, inducing different responses that in turn modulate its cytotoxic and cytoprotective activities.1 In a previous work of my research group was devised as a fluorescent H2S sensor by exploiting a coordination-based approach makes use of a heme protein. In particular, was employed myoglobin from horse skeletal muscle (Mb).2 A limitation of the Mb monitoring system was the low fluorescence enhancement in the presence of an excess of H2S. Furthermore, with the addition of H2S, Mb(Fe3+) was reduced to the ferrous from. Thus a mixture of Mb(Fe3+)–H2S, Mb(Fe2+)–H2S, and Mb(Fe2+) occurred in the cuvette samples that were measured. A similar reduction was observed by Scheidt et al. for the hydrosulfide (HS–) coordination in iron porphyrinates.3 Aiming at overcoming some of the limitations of this Mb-based H2S sensing system was used cobalt containing peptide deformylase (Co–PDF) for implementation in a H2S sensor by the same coordinative-based approach.4 The Co–PDF system operates as
1
R. Pietri, A. Lewis, R. G. Leon, G. Casabona, L. Kiger, S. R. Yeh, S. Fernandez-Alberti, M. C. Marden, C. L. Cadilla, J. Lopez-Garriga, Biochemistry 2009, 48, 4881.
2 M. Strianese, F. De Martino, C. Pellecchia, G. Ruggiero, S. D’Auria, Protein
Pept. Lett. 2011, 18, 282.
3 J. W. Pavlik, B. C. Noll, A. G. Oliver, C. E. Schulz, W. R. Scheidt, Inorg. Chem.
2010, 49, 1017.
4 M. Strianese, G. J. Palm, S. Milione, O. Kuhl, W. Hinrichs, C. Pellecchia, Inorg.
41
a “turn-off” devise, which is a limitation for real applications (Figure
3.1).
Figure 3.1. Mechanism of sensing of Co-PDF.
Recently Tang et al. exploited H2S binding to metal porphyrins with sensing purposes. More specifically, they reported a CuII-metalated 3D porous nanoscale metal–organic framework (nano-MOF) {CuL-[AlOH]2}n [PAC; H6L = meso-tetrakis(4-carboxyphenyl)porphyrin] as a heterogeneous fluorescence probe for H2S detection.5 Drawing upon these encouraging results and to improve an H2S sensors I focused on designing a simple copper porphyrin complex, which I reasoned could work by a coordinative-based approach.
3.2. Result and Discussion
3.2.1. Synthesis of Cu(II) Protoporphyrin IX
The target copper complex (Cu(II) Protoporphyrin IX, CuPPIX) was obtained in good yield by mixing an equimolar amount of
42
protoporphyrin IX and Cu(CH3COO)2 in glacial acetic acid by following a literature procedure (Scheme 3.1).6
Scheme 3.1. Synthesis of CuPPIX.
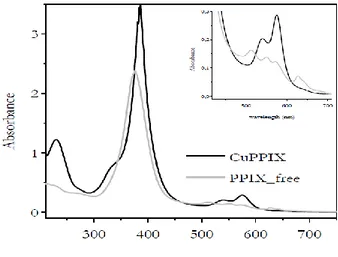
The stoichiometry was confirmed by ESI-MS where the major peak at 663.1 m/z units corresponds to the mononuclear [(CuPPIX)K]+ species. Less intense peaks at 647.2 and 623.7 were visible and were attributed to the species [(CuPPIX)Na]+ and [CuPPIX]+, respectively. No evidence for binuclear species in solution was found. Because of the paramagnetism of the copper center, the 1H NMR spectrum of CuPPIX showed featureless broad resonances. CuPPIX was further characterized by UV/Vis and fluorescence spectroscopy in MilliQ water solutions (see Figures 3.2 and 3.3). The UV/Vis spectrum was detected in basic water (pH 12.6) because of the poor solubility of the complex in pure water. Protoporphyrin IX bears two carboxylic moieties, which are deprotoneted in basic solution and, therefore, the related salt was soluble. The UV/Vis spectrum of CuPPIX (which
6 G. D. Dorough, J. R. Miller, F. M. Huennekens, J. Am. Chem. Soc. 1951, 73, 4315.
43
resembles those of similar metal porphyrin complexes7) exhibits the B-band (Soret band) at 385 nm with a shoulder at 343 nm. The Q-bands appear collapsed into two transitions at 538 nm and 575 nm, from an increase in symmetry of the molecule upon addition of the metal ion (Figure 3.3).
Figure 3.2. Electronic absorption spectra of CuPPIX and PPIX free in MilliQ water
(pH = 12.6; r.t.). [CuPPIX ] = [PPIX] = 3.5 ∙ 10-5 M. Insert = enlargement of the 400-700 nm zone.
7
44
Figure 3.3. A. Fluorescence emission spectra (λexc 230 nm) of CuPPIX and PPIX free in MilliQ water (pH = 12.6; r.t.). [CuPPIX ] = [PPIX] = 5.2 ∙ 10-5 M B. Fluorescence emission spectra (λexc 386 nm) of CuPPIX and PPIX free in MilliQ water (pH = 12.6 ; r.t.). [CuPPIX ] = [PPIX] = 5.2 ∙ 10-5 M.
The fluorescence spectrum displays intense fluorescence originating from the first (S1) excited singlet state (the Q state). The band with two peaks at 623 nm and 682 nm is mirror symmetric to the absorption spectrum in the Q region. The fluorescence originating from the second (S2) excited singlet state (the B state) is generally quenched in copper porphyrins because of an efficient relaxation pathway ending in a triplet state. The fluorescence spectrum of CuPPIX is consistently weaker than that of the free porphyrin ligand (Figure 3.3), which is most likely due to the coordination of the free ligand to the paramagnetic Cu2+ center.8
3.2.2. H2S Sensing
H2S binding to CuPPIX was first assessed by UV/Vis spectroscopy. When KSH (a commonly employed H2S donor) was added to a MilliQ water solution of CuPPIX a clear change of the initial spectrum was observed. Figure 3.4 shows a typical UV/Vis spectrum of a solution containing 2 ∙ 10–5 M of CuPPIX in which the hyperchromic shift of the Soret band is particularly evident. The system was then studied by fluorescence spectroscopy.
8
L. E. Santos-Figueroa, C. de la Torre, S. El Sayed, F. Sancenon, R. Martinez-Manez, A. M. Costero, S. Gil, M. Parra, Eur. J. Inorg. Chem. 2014, 41.
45
Figure 3.4. Electronic absorption spectra of CuPPIX free and upon addition of an excess of
KSH (r.t., MQ water, pH = 12.6). [CuPPIX] = 2 ∙ 10–5 M; [KSH] = 2 ∙ 10–4 M.
In the presence of KSH, a significant enhancement of the S2 fluorescence emission was observed. Figure 3.5 shows a typical fluorescence emission spectrum of a solution containing 2 ∙ 10–5 M of CuPPIX when excited at 386 nm.
Figure 3.5. Emission spectra of CuPPIX free (λex = 386 nm) and upon addition of an excess
46
To assess whether the amount of the fluorescence enhancement of CuPPIX varies with the concentration of the analyte, the fluorescence intensity of the system was monitored after the addition of increasing amounts of KSH solution. Figure 3.6 shows that there is a clear dependence of the fluorescence intensity displayed by the CuPPIX on the KSH concentration.
Figure 3.6. Emission spectra of CuPPIX (exc 386 nm) when titrated with KSH (rt, MQ
water, pH = 12.6). [CuPPIX] = 2 ∙ 10-5 M; end concentration of KSH varied in the range 4-200 ∙ 10-6 M.
To obtain an indication of the selectivity of the construct, the fluorescence intensity of CuPPIX in the presence of biologically relevant and potentially competing thiols [e.g., L-cysteine (L-cys) and glutathione (GSH)] or in the presence of a range of anions or of common oxidants was checked. Figure 3.7 shows the obtained results. For the species investigated we observed fluorescence trends
47
completely different from those found with KSH suggesting a good selectivity of our probe under the experimental conditions tested.
Figure 3.7. Relative fluorescence emission at 430 nm (λex = 386 nm) of CuPPIX (2.0 ∙ 10-5
M) in the presence of KSH (2.0 ∙ 10-5 M), glutathione (GSH), cysteine, Cl–, F–, CH3COO–,
H2O2, SCN–, SO42–, SO32–, S2O32–, alanine, and leucine (1.2 ∙ 10-3 M) in an aqueous solution.
Spectra were registered when the fluorescence reached the threshold value, which corresponds to the saturation point in our case.
Figure 3.8. Relative fluorescence emission at 430 nm (λex= 386 nm) of CuPPIX (2.0 ∙ 10-5
M) in the presence of KSH (2.0 ∙ 10-5 M), NaCl, KCl, NaSCN, KSCN, Na2SO4 , K2SO4 (1.2 ∙
48
We also studied whether there was any effect when substituting the potassium salts (as a source of anions) with the sodium ones. No significant effects were found (Figure 3.8).
To investigate the potential of the implemented devise we determined its sensitivity. We found that the sensor still gives an evident fluorescence enhancement with a concentration of 1 ∙ 10-6 M of KSH. Thus the detection limit for the implemented devise is in the sub-micromolar range (Figure 3.9).
Figure 3.9. Emission spectra of CuPPIX_H2S free (exc 386 nm) and in the presence of KSH
(rt, MQ water, pH = 12.6). [CuPPIX] = 2 ∙ 10-5 M; end concentration of KSH = 1 ∙ 10-6 M.
In order to gain independent evidence for the binding of H2S to CuPPIX we examined the reaction by NMR spectroscopy. At first we analyzed the 1H NMR spectrum of complex CuPPIX in the presence of excess H2S. No significant change in the initial 1H NMR spectrum was observed upon addition of H2S to a D2O solution of CuPPIX, excluding the fact that the excess of anion can extract the metal from
49
the complex causing the release of the porphyrin ligand. It is well known that metals can catalyze the oxidation of HS– to polysulfides and also that copper easily undergoes redox chemistry. To exclude the possible oxidation of HS– to HSSH9 (Figure 3.10), we tracked the reaction between the title complex and H2S by quantitative NMR spectroscopic analysis.
Figure 3.10. Possible oxidation CuPPIX-mediate of HS– to HSSH.
We followed a literature protocol for detecting and determining the possible presence of polysulfide species in solution, which consists of the alkylation of the polysulfide ions with dimethyl sulfate.10
The reaction was carried out in water with a complex/KSH molar ratio of 1:20 at room temperature under aerobic conditions. At the same time a control reaction (without complex) was also performed. No peaks ascribable to disulfides or polysulfides could be detected. Perfectly superimposable 1H NMR and 13C NMR spectra for the two
9
M. D. Hartle, S. K. Sommer, S. R. Dietrich, M. D. Pluth, Inorg. Chem. 2014, 53, 7800.
10
(a) I. Filpponen, A. Guerra, A. Hai, L. A. Lucia, D. S. Argyropoulos, Ind. Eng.
Chem. Res. 2006, 45, 7388; (b) D. S. Argyropoulos, Y. Hou, R. Ganesaratnam, D.
50
reactions were obtained (Figure 3.11). This clearly indicates that HS– is not oxidated to disulfides/polysulfides by the title complex. Then we studied the reaction between CuPPIX and H2S by electrospray ionization mass spectrometry in aqueous solution. No peaks ascribable to the free ligand could be detected, which confirms what we had already seen from NMR spectroscopy. The major peak at 679.24 m/z units is consistent with the mononuclear [(CuPPIX)NaHS]– species, which suggests analyte binding to the copper complex. To the best of our knowledge, this is the first example of such a reaction. Typically, in the presence of H2S, literature copper complexes undergo a demetalation reaction with concomitant release of the organic ligand.11 Coordination of organic bases to copper porphyrins have already been observed by Glazkov et al.12
11 L. E. Santos-Figueroa, C. de la Torre, S. El Sayed, F. Sancenon, R. Martinez-Manez, A. M. Costero, S. Gil, M. Parra, Eur. J. Inorg. Chem. 2014, 41.
12
(a) Y. Glazkov, A. I. Vrublevskii, E. K. Kruglik, T. F. Kachura, J. Appl.
Spectrosc. 1981, 35, 1254; (b) A. I. Vrublevskii, Y. Glazkov, T. F. Kachura, J. Appl. Spectrosc. 1984, 41, 1166.
51
Figure 3.11. 1H NMR spectra for the polysulfides determination experiment (see experimental part). The upper spectrum shows the sample without CuPPIX (control reaction); the lower spectrum is that of the sample in the presence of CuPPIX. Peaks assignment was made on the basis of reference 9.
52 3.2.3. Conclusions
In conclusion CuPPIX can be successfully used as a “turn on”, sensitive and selective fluorescence probe for the detection of H2S in aqueous environments via a coordinative-based approach. The probe can selectively and sensitively detect HS– anions in water over other anions, biothiols, and common oxidants such as H2O2. 1H NMR and ESI-MS experiments provide clear evidence that the turn-on response in the presence of H2S is ascribed to binding of the target analyte to the copper center. We are currently investigating the mechanism by which the S2 fluorescence in CuPPIX is prompted by the coordination of the hydrogen sulfide to the copper center.
3.3. Reference List
1. R. Pietri, A. Lewis, R. G. Leon, G. Casabona, L. Kiger, S. R. Yeh, S. Fernandez-Alberti, M. C. Marden, C. L. Cadilla, J. Lopez-Garriga, Biochemistry 2009, 48, 4881.
2. M. Strianese, F. De Martino, C. Pellecchia, G. Ruggiero, S. D’Auria, Protein Pept. Lett. 2011, 18, 282.
3. J. W. Pavlik, B. C. Noll, A. G. Oliver, C. E. Schulz, W. R. Scheidt, Inorg. Chem. 2010, 49, 1017.
4. M. Strianese, G. J. Palm, S. Milione, O. Kuhl, W. Hinrichs, C. Pellecchia, Inorg. Chem. 2012, 51, 11220.
5. Y. Ma, H. Su, X. Kuang, X. Li, T. Zhang, B. Tang, Anal. Chem.
2014, 86, 11459.
6. G. D. Dorough, J. R. Miller, F. M. Huennekens, J. Am. Chem. Soc. 1951, 73, 4315.
![Figure 2.4. COSY spectrum of a mixture of 1 and KSH in a 1/1 molar ratio ([1] = 34.5 mM,](https://thumb-eu.123doks.com/thumbv2/123dokorg/7193722.74992/25.748.249.471.104.403/figure-cosy-spectrum-mixture-ksh-molar-ratio-mm.webp)
![Figure 2.6. 1 H NMR spectrum of K[Co(dmgH) 2 (CH 2 CH 3 )(SH)] (2) in methanol-d 4 (rt, 400](https://thumb-eu.123doks.com/thumbv2/123dokorg/7193722.74992/29.748.124.597.407.692/figure-nmr-spectrum-dmgh-ch-ch-sh-methanol.webp)
![Figure 2.9. Electronic absorption spectra of [Co(dmgH) 2 (CH 2 CH 3 )(py)] (1) (rt, black line,](https://thumb-eu.123doks.com/thumbv2/123dokorg/7193722.74992/34.748.155.643.374.658/figure-electronic-absorption-spectra-dmgh-ch-black-line.webp)
![Figure 2.10. Electronic absorption spectra of [Co(dmgH) 2 (CH 2 CH 3 )(py)] (1) (rt, 3.2 x 10 -5](https://thumb-eu.123doks.com/thumbv2/123dokorg/7193722.74992/35.748.119.609.224.516/figure-electronic-absorption-spectra-dmgh-ch-ch-py.webp)
![Figure 2.12 . Relative Absorbance at 330 nm of [Co(dmgH) 2 (CH 2 CH 3 )(py)] (1) (3.2 x 10 -5](https://thumb-eu.123doks.com/thumbv2/123dokorg/7193722.74992/37.748.49.680.386.660/figure-relative-absorbance-nm-dmgh-ch-ch-py.webp)
![Figure 2.17. Emission spectra of [Co(dfgH) 2 (CH 2 CH 3 )(py)] (4) (λ exc = 280 nm, rt, 3.9 x 10 -6](https://thumb-eu.123doks.com/thumbv2/123dokorg/7193722.74992/41.748.186.542.101.396/figure-emission-spectra-dfgh-ch-ch-py-exc.webp)
![Figure 2.19. Aliphatic region of the 1 H NMR spectrum of [Co(dfgH) 2 (CH 2 CH 3 )(py)] (4)](https://thumb-eu.123doks.com/thumbv2/123dokorg/7193722.74992/42.748.117.663.409.673/figure-aliphatic-region-nmr-spectrum-dfgh-ch-ch.webp)
![Figure 2.21. Emission spectra of [Co(dmgH) 2 (ph)(py)] (4) (λ exc = 250 nm, rt, 2.7 x 10 -6 M,](https://thumb-eu.123doks.com/thumbv2/123dokorg/7193722.74992/43.748.184.541.601.881/figure-emission-spectra-dmgh-ph-py-λ-exc.webp)