40% tunneling magnetoresistance after anneal at 380 °C for tunnel
junctions with iron–oxide interface layers
Zongzhi Zhanga)
Instituto de Engenharia de Sistemas e Computadores (INESC), R. Alves Redol 9, 1000 Lisbon, Portugal
S. Cardoso and P. P. Freitas
Instituto de Engenharia de Sistemas e Computadores (INESC), R. Alves Redol 9, 1000 Lisbon
and Departamento de Fisica, Instituto Superior Tecnico (IST), Avenue Rovisco Pais, 1096 Lisbon, Portugal
X. Batlle
Departamento Fı´sica Fondamental, Universitat Barcelona, Avenue Diagonal 647, 08028 Barcelona, Catalonia, Spain
P. Wei, N. Barradas, and J. C. Soares
Insituto Tecnologico e Nuclear, E.N.10 Sacavem and Centro de Fisica Nuclear da Universidade de Lisboa, Campo Grande, Portugal
Spin tunnel junctions fabricated with one interposed Fe–FeOx layer between the Al2O3barrier and the top CoFe pinned electrode show large tunneling magnetoresistance共TMR兲 共40%兲 for anneals up to 380 °C. The annealing temperature TTMR* , where maximum TMR occurs, increases with the inserted Fe–FeOx layer thickness. For samples with thicker inserted layer, the pinned layer moment 共which usually starts to decay below 300 °C in the normal junctions兲 increases with annealing temperature up to 380 °C and remains at a maximum until 450 °C. The large TMR at high temperature is related with the diffusion of extra Fe 共from the Fe–FeOx layer兲 into the electrode interfacial region and the as-deposited paramagnetic FeOx decomposition into metallic Fe, and possibly the formation of some Fe3O4, which compensate the interface polarization loss associated with Mn interdiffusion. Rutherford backscattering spectrometry analysis confirms partial Fe diffusion into the top CoFe electrode after anneal. Meanwhile, x-ray photoelectron spectra for the Fe 2 p core level show that the FeOx contribution in the upper part of the inserted layer decreases upon annealing, while it increases in the inner part near the barrier, suggesting the FeOx decomposition and the oxygen diffusion toward the inner metallic Fe and Al barrier. The study of
R⫻A values and barrier parameters versus annealing temperature for samples with 7 and 25 Å
Fe–FeOx also reflects the above structural changes in the inserted layer. © 2001 American
Institute of Physics. 关DOI: 10.1063/1.1356712兴
Magnetic tunnel junctions 共MTJs兲 with tunneling mag-netoresistance signal共TMR兲 in excess of 40% and adjustable resistance-area products R⫻A from 106 to few hundred ⍀m2can now be fabricated. The present TMR signals and
R⫻A values are suitable for magnetic random access
memory applications. However, good thermal stability for the MTJs is required to cope with standard backend pro-cesses 关sintering: 400– 450 °C, plasma enhanced chemical vapor deposition oxide deposition: 350 °C兴 occurring during MTJ integration with a 共CMOS兲 wafer.1,2 The TMR signal usually decreases above 300 °C due to the polarization loss resulting from the Mn 共in Mn– X exchange layer兲 diffusion into the CoFe top electrode.3,4In this work, thermal stability for MTJs is improved up to 380 °C by the insertion of an iron–oxide layer with appropriate thickness between the AlOx barrier and the top CoFe pinned electrode. This brings MTJs one step closer to full CMOS backend compatibility.5,6 Junctions with structure of glass/Ta90 Å/ Ni80Fe2070 Å / Co80Fe2030 Å/Al9 Å⫹oxide / Fe (tFe)⫹oxide/ Co80Fe2040 Å/Mn76Fe24250 Å/Ti10W90共N兲150 Å were
pre-pared by ion beam deposition and oxidation using a Nordiko 3000 IBD tool, and then patterned down to 3⫻1m2 di-mensions with a self-aligned process.7,8 Magnetic measure-ments were done by a vibrating sample magnetometer in unpatterned parts of the sample. X-ray photoelectron spec-troscopy 共XPS兲 experiments were performed to analyze the Fe and FeOx spatial distribution. Since the XPS signal comes from an area within a distance of about 2–3 共 is the inelastic mean free path for electrons兲 from the sample surface, low-energy ion beam共4 keV, 45°兲 etch was carried out to obtain a depth profile. Steps 1 and 2 correspond to surface spectra, and step 6 is the spectrum taken after sput-tering for 6 s so that step n is taken after sputsput-tering for 6 •(n⫺2) s. The etch rate is around 6–10 nm/min. The inten-sities of the photoelectron lines were recorded using the Al K␣ emission line. All thermal treatments consist of 45 min anneals at each temperature, done in vacuum (10⫺6Torr), and followed by cooling in field applied along the common easy axis of the electrodes.
Figure 1 shows the pinned layer moments versus anneal-ing temperature for samples with tFe⫽0, 7, 10, 20, and 25 Å. The Fe and Al layers are oxidized by 10 s exposure to a remote oxygen plasma except for the Al barrier in the refer-a兲Author to whom correspondence should be addressed; electronic mail:
JOURNAL OF APPLIED PHYSICS VOLUME 89, NUMBER 11 1 JUNE 2001
6665
0021-8979/2001/89(11)/6665/3/$18.00 © 2001 American Institute of Physics
ence sample with tFe⫽0, which is oxidized for 20 s. There is a net increase in the moment of the pinned layer for increas-ing Fe thickness. For junctions with 7 and 10 Å Fe, there is a strong moment decrease starting around 300 °C, similar to the reference sample without Fe, corresponding to Mn diffu-sion into the CoFe top electrode. For 25 Å Fe, the pinned layer moment increases almost linearly with annealing temperature up to 380 °C, and remains at a maximum value up to 450 °C. RBS experiments on a special sample of Si/Al2O3500 Å/Co80Fe2030Å/Al9 Å⫹10 s oxide/Fe20 Å ⫹10 s oxide/Co80Fe2040 Å/Al2O315 Å shows that 16.5 ⫻10⫹15atom/cm2 of Fe are found in the as-deposited Fe– FeOx. After anneal at 385 °C, 7⫻10⫹15atom/cm2 of Fe have moved into the top CoFe electrode共about 8 Å increase in the top CoFe thickness, and an enrichment in Fe of the interfacial CoFe region兲. The remaining 9.5 ⫻10⫹15atom/cm2 of Fe either form a pure 11 Å thick Fe layer at the AlOx/CoFe interface, with the excess oxygen becoming incorporated into the AlOx barrier, or remaining as FeOx (Fe3O4). To check the magnetic nature of the FeOx grown in this experiment, a multilayer of glass /关Fe20 Å/10 s oxide兴8was made and was subject to the same annealing procedure described before. The inset shows the as-deposited M – H loop共characteristic from a paramagnetic FeOx兲 and loops annealed at 280 and 385 °C 共remanence and large coercivity suggest the formation of a ferromagnetic or ferrimagnetic oxide layer, possibly Fe3O4兲. This proves the nonmagnetic characteristic of the as-deposited FeOx layers. From the above analyses, the moment increase upon anneal comes from the as-deposited nonmagnetic or paramagnetic FeOx decomposition into pure Fe and/or Fe3O4, and partial Fe diffusion into the CoFe electrode. It is found that the moment decrease normally due to Mn interdiffusion has been pushed to high temperature for the samples with a thicker Fe–FeOx layer.
Figure 2共a兲 shows the TMR versus annealing tempera-ture for the samples discussed above. There are striking dif-ferences in the as-deposited TMR and annealing temperature
TTMR* where maximum TMR occurs, as shown in the inset for various Fe–FeOx thicknesses. In the as-deposited state,
full oxidation occurs for tFe⫽10 Å, and zero TMR results, consistent with formation of a nonmagnetic or paramagnetic Fe oxide. The 8% signal for 7 Å Fe is probably due to a discontinuous Fe layer. For thicker Fe layers, the as-deposited TMR signal is 10%, implying that incomplete oxi-dation occurs 共FeOx⫹Fe formed兲. TTMR* increases with the inserted Fe layer thickness, and reaches a maximum of 380 °C at tFe⫽20 Å. Upon annealing, the TMR signal starts to increase from 0% at 220 °C to 36% at 270 °C in the sample with 10 Å Fe, indicating that the FeOx decomposi-tion starts at 220 °C. For the thicker Fe layers (tFe⭓20 Å), TMR first decreases to zero as the annealing temperature increases to 360 °C, and then shows a sharp peak at 380 °C. The TMR decrease is related with the reduced interfacial polarization, occurring when the oxygen from the FeOx layer moves toward the inner metallic Fe, resulting in the para-magnetic FeOx formation near the barrier. The sharp peak at 380 °C is probably associated with the final decomposition of this interfacial FeOx. Figure 2共b兲 illustrates the stability of such junctions with tFe⫽25 Å upon reanneal. The sample was first annealed up to 380 °C and showed maximum TMR 共solid square兲. It was then reannealed up to 365 °C 共open square兲 maintaining the large TMR.
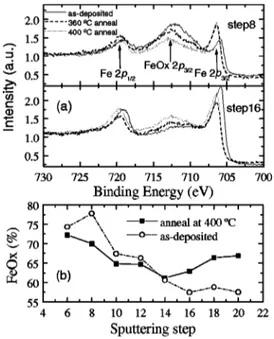
In order to clarify what is happening after anneal to the as-deposited Fe–FeOx layer, XPS measurements were per-formed on a special sample with a structure of Si /Al2O31000 Å/Co80Fe2030 Å/Al9 Å⫹10 s oxide/Fe20 Å ⫹10 s oxide/Co80Fe2040 Å/Ta30 Å. Normalized XPS spectra for the Fe 2 p core level 共2p3/2 and 2 p1/2兲 are displayed in
FIG. 1. Dependence of the normalized pinned layer moments on the anneal-ing temperature for various inserted Fe layer thicknesses. The inset shows hysteresis loops for a multilayer with structure of (Fe20 Å/10 s oxide)8 be-fore and after anneal.
FIG. 2. 共a兲 TMR vs annealing temperature for junctions with different in-terfacial Fe–FeOx layers. The inset shows the dependence of the as-deposited TMR value and TTMR* 共where maximum TMR value occurs兲 on the inserted layer thickness.共b兲 TMR and R⫻A values for junctions with 25 Å Fe, first annealed to get the maximum signal 共solid square兲 at 380 °C, then subject to further annealing starting at 180 °C共open square兲.
6666 J. Appl. Phys., Vol. 89, No. 11, 1 June 2001 Zhanget al.
Fig. 3共a兲, showing the metallic Fe and FeOx contributions, after different anneals. The two spectra shown here corre-spond to two different regions of the Fe–FeOx layer: the upper part near the top CoFe interface共step 8, 36 s sputter-ing兲, and the inner part near the barrier 共step 16, 84 s sput-tering兲, respectively. Figure 3共b兲 shows the relative intensity of the FeOx contribution in the as-deposited state and an-nealed at 400 °C, as a function of sputtering time. Near the CoFe interface 共step 8兲, the FeOx contribution decreases upon anneal, revealing the decomposition of the FeOx layer and oxygen moving into the inner Fe layer. Near the AlOx interface 共step 16兲, the relative intensity of the FeOx peak increases with annealing due to the oxygen coming from the decomposition of the initial 共outer兲 FeOx layer, while the intensity of the metal peak decreases.
Figure 4 shows R⫻A values and barrier parameters for two samples with tFe⫽7 and 25 Å. The current–voltage curves were fitted using the Simmons model. The as-deposited R⫻A value for 7 Å Fe is about 9.6 M⍀m2due to full oxidation of the Fe layer, 4 orders larger than that in the sample with 25 Å Fe which is only about 600⍀m2, but after anneal, both samples reach a similar value. In the as-deposited state, the sample with 7 Å Fe has an effective thickness of about 20 Å and barrier height of 0.5 eV. After anneal at 250 °C where the maximum TMR occurs, the bar-rier height increases up to 2.5 eV and barbar-rier effective thick-ness decreases to 10 Å. For 25 Å Fe the as-deposited barrier parameters and the R⫻A value are characteristic of pure 9 Å barrier junctions. Upon annealing, the barrier height
de-creases to 0.5 eV, but barrier thickness doubles to 20 Å at 360 °C, the barrier parameters at this temperature are similar to the sample of 7 Å Fe in the as-deposited state, indicating the possible same Fe and FeOx distribution existing in these two states. This can be caused by the oxygen migration from the FeOx toward the inner pure Fe near the barrier. Resis-tance drops at 380 °C where maximum TMR occurs, and at this point barrier height increases from 0.5 to 2.5 eV, and barrier thickness decreases to 10 Å due to the eventual FeOx decomposition at the Al2O3/Fe interface, in agreement with the XPS results.9
This work was supported by PRAXIS XXI Project No. P/CTM/10220/98 and Sapiens Project No. 34116/99. Z.Z. and S.C. are grateful for the support of post-doctoral Grant No. PRAXIS/BPD/22112/99 and PhD Grant No. PRAXIS/ BD/11533/97, respectively. X.B. is indebted to Dr. J. Alay 共University of Barcelona兲 for the XPS measurements. Finan-cial support from both the Spanish CICYT through Project No. MAT97-0404 and the Catalonian CIRIT through Project No. 1998SGR0048 are greatly appreciated.
1R. Scheurlein, W. Gallagher, S. S. Parkin, A. Lee, S. Ray, R. Robertazzi,
and W. Reohr, Proceedings of the 2000 IEEE International Solid-State Circuits Conference, San Francisco, Feb. 2000, paper TA 7.2.
2
S. Tehrani, J. M. Slaughter, E. Chen, M. Durlam, J. Shi, and M. De Herrera, IEEE Trans. Magn. 35, 2814共1999兲.
3S. Cardoso, P. P. Freitas, C. de Jesus, P. Wei, and J. C. Soares, Appl.
Phys. Lett. 76, 610共2000兲.
4S. Cardoso, R. Ferreira, P. P. Freitas, P. Wei, and J. C. Soares, Appl. Phys.
Lett. 76, 3792共2000兲.
5M. Sharma, C. Fery, S. X. Wang, T. C. Anthony, and J. H. Nickel, IEEE
Trans. Magn.共in press兲.
6R. Jansen and J. S. Moodera, Appl. Phys. Lett. 75, 400共1999兲. 7
S. Cardoso, V. Gehanno, R. Ferreira, and P. P. Freitas, IEEE Trans. Magn.
35, 2952共1999兲.
8Z. Zhang, S. Cardoso, P. Wei, N. Barradas, J. C. Soares, and P. P. Freitas,
Appl. Phys. Lett.共submitted兲
9T. S. Chin and N. C. Chiang, J. Appl. Phys. 81, 5250共1997兲.
FIG. 3.共a兲 Normalized intensity of the XPS spectra for the Fe 2p core level
共2p3/2and 2 p1/2兲 showing the metallic Fe and FeOx contributions near the FeOx/CoFe interface共step 8兲 and near the AlOx/Fe–FeOx interface 共step 16兲 after different anneals. 共b兲 Relative intensity of FeOx as a function of sputtering step for samples in the as-deposited state and annealed at 400 °C.
FIG. 4. Resistance–area products, effective barrier height, and barrier thick-ness for junctions with inserted Fe layers of 7 and 25 Å.
6667
J. Appl. Phys., Vol. 89, No. 11, 1 June 2001 Zhanget al.