Epigenetic stability in Saffron (Crocus sativus L.) accessions during four
consecutive years of cultivation and vegetative propagation under open field
conditions
Matteo Busconi1, Giovanna Soffritti1, Lorenzo Stagnati1, Adriano Marocco1, Javier Marcos Martínez2, Marcelino De Los Mozos Pascual2, José Antonio Fernandez3
1) Department of Sustainable Crop Production, Faculty of Agriculture, Food and Environmental Sciences. Università Cattolica del Sacro Cuore, Piacenza (Italy).
2) Centro de Investigación Agroforestal de Albaladejito, Instituto Regional de Investigación y Desartrollo Agroalimentario y Forestal. Cuenca (Spain).
3) IDR-Biotechnology and Natural Resources, Universidad de Castilla−La Mancha, Albacete (Spain).
Declarations of interest: none Keywords
epigenetics; MS-AFLP; Crocus sativus; epigenetic stability Abstract
Saffron (Crocus sativus L.) is a sterile species that is vegetatively propagated in the field, year by year, via the production of new corms. While Saffron’s genetic variability is extremely low, phenotypic variation is frequently observed in the field and epigenetics could be a possible origin of these alternative phenotypes. Present day knowledge on Saffron epigenetics is very low or absent. In the present paper, to deepen existing knowledge, we focused on the epigenetic differences and stability among 17 Saffron accessions, of different geographic origin, during four consecutive years of vegetative propagation under open field conditions. Before the analysis, the selected accessions have been cultivated in the same field for at least three consecutive years. Despite the low genetic variability and the prolonged co-cultivation in the same environment, Methylation-Sensitive Amplified Fragment Length Polymorphism (MS-AFLP) analysis revealed a very high epigenetic difference among accessions, making it possible to discriminate them based on the epigenetic profiles. During the four years of the study, a little variation has been observed within accessions following different patterns, slightly modifying the accession epigenotypes but not enough to even them to a more uniform profile. These results confirm that, under natural conditions, Saffron epigenotypes are highly stable, supporting a role for epigenetics in phenotypic variability.
1. Introduction 1 1 2 3 4 5 6 7 8 9 10 11 12 13 14 15 16 17 18 19 20 21 22 23 24 25 26 27 28 29 30 31 32 33 34 1
Saffron (Crocus sativus L.) is an allotriploid species (2n = 3x = 24) with a very big genome whose size has been calculated to be about 10.5 Gbases by flow cytometry. Despite a very long cultivation history, Saffron domestication dates back to at least 3,500 years ago, its botanical origin is still not clear. C. cartwrightianus Herb. is presently recognized as the donor of the diploid genome. Because of its genetic constitution, Saffron is sterile and, since the first cultivations, it has been obligatorily propagated vegetatively, year by year, via the production of new corms replacing the old ones [1]. Corm multiplication does not generate genetic variations with the exception of some spontaneous mutations and, consequently, the presence of any genetic variability has been debated for years [2, 3, 4]. Contrary to this, phenotypic variation is frequently observed in the field and, interestingly, such variability can be occasionally unstable and change from one growing season to another [1]. In a preliminary characterization of 50 saffron accessions of the WSCC (World Saffron and Crocus Collection, created through the second European Community Programme on the Conservation, Characterization, Collection and Utilization of Genetic Resources in Agriculture 2006−2011, and located in the Bank of Plant Germplasm of Centro de Investigación Agroforestal de Albadalejito, Cuenca, Spain), characters related to phenology, floral morphology and saffron production were measured highlighting a large variability [5]. Agayev et al. [6] evidenced a rapid and stable response of Saffron to clonal selection and this efficacy, in the absence of a significant genetic variability, supported the presence of something different from solely genetics in determining the different phenotypes. These observations raise the question about the possible origin of such variability and, considering that gene expression can be influenced by both genetic and epigenetic changes, epigenetics could be a possible origin of these alternative phenotypes.
Epigenetic marks are defined as a series of chemical modifications of both DNA and histones, however the majority of studies has been focused on DNA methylation because of the presence of mechanisms of inheritance and due to the relative simplicity of investigating it at a genome-wide level [7]. The most frequent mark of DNA methylation is represented by 5-methylcytosine (5-mC), which in plants can be present at different sites having CG, CHG and CHH (H represents any base but G) sequences [8].
Many species of high economic and agricultural interest are propagated in a vegetative way and this is carried out to propagate and preserve ideal varieties. Many fruit crops are the outcome of the clonal propagation, through grafting or in vitro culture, of a single founder plant. Several studies detected that prolonged vegetative propagation can result in the formation of epigenetic variants that can heavily affect the phenotype of the regenerated plants. Ong-Abdullah et al. [9] were able to evidence that a differentially methylated region is responsible for the appearance of the mantled trait in trees propagated through tissue culture. The mantled trait is an aberrant phenotype evident just in the adult phase that destroys the production of the trees. The presence of epigenetic variations following in vitro culture has been frequently detected by using MS-AFLP (MSAP – methylation-sensitive amplified polymorphism) markers in many plant species, such as pea [10], agave [11], grapevine [12], coffee [13], freesia [14]. Contrary to these species that are propagated in a vegetative way mainly to preserve a genotype of interest, the vegetative propagation of Saffron is forced because of its sterility. Further,
2 35 36 37 38 39 40 41 42 43 44 45 46 47 48 49 50 51 52 53 54 55 56 57 58 59 60 61 62 63 64 65 66 67 68 69 3
the majority of these studies considered methylation changes arose consequently the tissue culture for one or several generations. However, tissue culture represents a very unnatural environment [15], despite its use for plant breeding, and the consequences on methylation can be different compared to open field propagation, which is the classical way to propagate Saffron. To fully understand the possible connection between epigenotype and phenotype, researches generating high-resolution data sets from plants in the field, sampled under the prevailing environmental conditions are highly recommended [7]. For vegetatively propagated crops, epigenetic variations could represent an added value for breeding but in order to use epigenetic information for breeding it is mandatory to better understand the stability of epigenomic patterns in an organism [15], especially under natural conditions. If DNA methylation patterns could be stable through development, then the epigenome could be considered to accurately describe the epigenetic profile of an organism and to predict traits [15]. Currently, only a little knowledge about Saffron epigenetics is available [4, 16] but no information concerning the stability of the Saffron epigenome can be retrieved from scientific literature.
In the present study, to gain further information regarding Saffron epigenetics with a particular focus on epigenetic stability, we decided to follow the epigenetic stability of 17 accessions of Saffron, during four consecutive years of cultivation and propagation under open field conditions at the WSCC, by using MS-AFLP markers. Before the analysis, the selected accessions had been cultivated very closely for at least three consecutive years (in some cases even more) in the same field to make uniform as much as possible the epigenetic constitution. Despite this, all the accessions were characterized by a different epigenotype both at the beginning and at the end of the study, suggesting that despite some small variations, under open field conditions the epigenotype of Saffron is very stable in consecutive years.
2. Materials and Methods
2.1 Plant material and DNA extraction
Seventeen accessions (Table 1) from the WSCC germplasm have been selected for the study. All the accessions, except 1697 and 2930, were previously analysed at the genetic level [4] evidencing an extremely low genetic variability. Accessions 1697 and 2930 were analysed independently without any significant difference from the other 15 accessions. The different accessions, characterized by very different geographic origin, were received in different years at the germplasm, starting from 2005 and going up to 2010 but they were cultivated in the same field for at least three consecutive years before the analysis. The experimental farm of Centro de Investigación Agroforestal de Albadalejito (Cuenca, Spain) is located at an altitude of 950-1,000 meters above the sea level. The edaphic characteristics of the fields are the common for the area, with sandy loams, alkaline pH (7.6-8.4), normal electric conductivity (<400 mmhos/cm) and a low content of organic matter (1-2.5%). The analysis of the epigenetic stability was carried out on DNA extracted from leaves. For each accession, leaves of ten independent plants were pooled during the samples to obtain a global epigenetic profile of the accession and not
3 70 71 72 73 74 75 76 77 78 79 80 81 82 83 84 85 86 87 88 89 90 91 92 93 94 95 96 97 98 99 100 101 102 103 104 5
of single plants. After sampling, leaves were lyophilized and preserved at room temperature until the analysis. To maximize the uniformity of the samples, leaves were sampled within the same day for each single year and the same plant vegetative stage in different years, just in the beginning of leaf senescence which occurs during the last days of April or the first days of May depending on the climatic conditions. All along the four growing seasons of the experiment, temperatures and rainfall were continuously measured, being this the normal activity of Centro de Investigación Agroforestal.
The DNA (17 accessions x 4 consecutive years) was extracted, for all the samples, at the end of the sampling step, during the summer of 2016. Leaves were ground and stored at -20 °C until DNA extraction. Then, 200 mg of tissue powder was weighed and DNA extractions were carried out using the commercial kit GeneElute Plant Genomic DNA Miniprep Kit (Sigma-Aldrich) according to the manufacturer’s instructions, with just a minor modification. In detail, to each sample we added 4% w/w of PVP (polyvinylpyrrolidone) directly during the DNA extraction to facilitate the removal of secondary metabolites, such as polyphenols, and to provide a more pure DNA for the subsequent analysis [16]. Taking into account the large size of the Saffron genome (bigger than 10 Gb), 250 ng of total DNA was used in the subsequent MS-AFLP analyses.
2.2 MS-AFLP analyses
MS-AFLP analyses were performed as reported by Marconi et al. [17]. The classic MS-AFLP approach involves the use of the isoschizomers MspI and HpaII in order to better investigate the variation in the methylation state of the restriction site cytosines. Both enzymes cut the DNA if the restriction site is not methylated, but they cut in a different way in the presence of cytosine methylation. The two enzyme combinations used were EcoRI/MspI and EcoRI/HpaII. Preselective PCRs were carried out using E01 and HM0 primers. Three different selective primer combinations were used: E38/HM2; E32/HM3; E37/HM1. The main characteristics of the primers are reported in Table 2. PCR amplifications were performed as reported in the literature [17], 2% PVP was added to the PCR mix to counteract the presence of inhibitors [18]. The selective EcoRI primers were labelled with fluorescent dyes, and the amplified products from selective amplifications were visualized in an ABI Prism 3130xl Genetic Analyser (Life Technologies) and analysed using the GeneMapper Analysis software (Life Technologies). The electrophoretic patterns were visually inspected in the search for polymorphisms and the presence or absence of peaks was scored and compiled in a binary matrix.
2.3 Statistical analysis
The binary matrix of the detected MS-AFLP signals was analysed by using the software GenAlEx 6.5 [19, 20]. The software was used to (i) obtain a pairwise, individual-by-individual (N x N) genetic distance matrix among epigenotypes based on the binary matrix; ii) carry out the principal coordinate analysis (PCoA), a multivariate
4 105 106 107 108 109 110 111 112 113 114 115 116 117 118 119 120 121 122 123 124 125 126 127 128 129 130 131 132 133 134 135 136 137 138 139 7
technique that allows to find and plot the major patterns within a multivariate data set; iii) perform an analysis of the molecular variance (AMOVA) [21] at the accession level, in order to evaluate the significance of epigenetic differentiation within and between accessions.
Further data manipulation and visualization, to graphically visualize the changes in the methylation profile of the accessions in the four years of the study, were performed with R software [22].
3. Results
3.1 Growing condition of the accessions in the four consecutive growing seasons.
The 17 accessions selected for the study were cultivated in close proximity in the same field for at least three consecutive years, some of them even more, to standardize as much as possible the epigenome before the analysis. In all the years, the accessions were vegetatively propagated under open field conditions. During the four growing seasons, temperatures and rainfall were measured and the collected values were reported in in table 3. During the four involved “Saffron Growing Seasons” (from June to May of the following year in 2012-2013, 2013-2014, 2014-2015 and 2015-2016) there were no important differences in the average temperatures, which could be considered as “normal” and close to the general average values of the area that are between 11.5 and 12.0 °C. The average temperatures of the four growing seasons were very similar and comprised between 11.6 and 12.2 °C without important differences (Table 3). No stressing periods associated with prolonged extremely low or high temperatures were evidenced all along the experiment. The situation was different concerning rainfall. The global amount of rain that was measured in the four growing seasons was clearly different ranging from a maximum value of 589.0 mm (from June 2012 and May 2013) and a minimum value of 366.1 mm (from June 2013 and May 2014). With just the exception of the third growing season (437.1 mm) all the other values were definitely higher or lower than the average value for the area that is comprised between 450 and 500 mm. As expected, precipitations were mainly concentrated from September until April, while lower values were measured during summer months. Despite these differences, and despite months characterised by high or low precipitation, globally no stressing periods because of a prolonged excess or scarcity of water able to significantly influence Saffron growth were evidenced.
3.2 MS-AFLP analysis and trends of methylation variation
For all the samples, DNA extraction and methylation-sensitive analysis were carried out at the end of the survey independently by the date of sampling.
The protocol adopted for MS-AFLP analyses was able to provide high reproducibility (higher than 99%) in preliminary independent reactions. Globally, 68 samples (17 accessions x 4 years) were digested by using both EcoRI/MspI and EcoRI/HpaII combinations for a total of 136 digestions. All the samples were subsequently
5 140 141 142 143 144 145 146 147 148 149 150 151 152 153 154 155 156 157 158 159 160 161 162 163 164 165 166 167 168 169 170 171 172 173 174 9
analysed by using three primer combinations that allowed a high level of polymorphism to be detected both among and within accessions in the four consecutive years of the experiment. Two hundred and forty-four peaks (Table 4) were initially chosen by comparing, for each primer combination, all the profiles obtained with the two independent digestions. Sixty-seven well-defined peaks were selected for the primer combination E37/HM1, 99 for E38/HM2 and 78 for E32/HM3. Once the peaks to be scored were chosen, the evaluation of the polymorphisms was carried out. Globally, 143 (58.6 %) and 166 (68.03%) peaks, out of the 244 scored, were polymorphic at least in a single sample, for the enzymes MspI and HpaII, respectively (Table 4). The three combinations were able to detect a different level of polymorphism, E32/HM3 and E37/HM1 being the most polymorphic for MspI and HpaII, respectively. The most polymorphic combination for MspI was the least variable with HpaII. Globally, the digestion with HpaII resulted in the detection of more polymorphisms than with MspI.
The global trend associated with the epigenetic variability in the four consecutive years is reported in Figure 1. To evaluate the global trend of variability, we considered the whole number of peaks detected, year by year, with the three combinations of primers in the different accessions. The general trend was more evident in the last panel (MspI + HpaII) where it was possible to evidence, from 2013 to 2015, an increment in the global number of peaks followed by an evident reduction in 2016. Globally, the number of peaks scored was: 3,665 (1,790 MspI and 1,875 HpaII) in 2013; 3,671 (1,788 and 1,883) in 2014; 3,680 (1,794 and 1,886) in 2015; 3,657 (1,785 and 1,872) in 2016. The same trend was also evident for HpaII alone, while for MspI a very small difference was noted, the number of peaks detected in 2014 being smaller (but only two peaks less) than the number of peaks in 2013.
The behaviour of the single samples in the four years is reported in Figure 2 where the variation accession x accession is represented in the number of peaks evidenced with the two enzymes. While the general trend was clear, considering samples separately the situation was more variable and without a single trend explaining how the epigenotype could vary in the different accessions and in different years. Just three accessions (BCU001783, BCU001806 and BCU002479), with MspI, maintained constant the epigenetic profile over the four years, without any detectable variation with the three primer combinations; all the other accessions, with both MspI and HpaII, evidencing more or less big changes. The most common aspect was that the number of peaks detected was usually higher with HpaII than with MspI. Further, it was possible to evidence that epigenetic changes appeared in different years in the various samples. Some accessions had changes in 2013 while others in 2014, 2015 or 2016. Some accession had changes in a single year while others in more consecutive years. For each accession, the profiles of the changes detected by the two methylation-sensitive enzymes (green and blue lines in Figure 1) were characterized by different trends. In some cases (e.g. BCU001619, BCU001672, BCU002479, BCU002930) the number of polymorphic peaks varied in a similar way in the four years for both the enzymes, while in others the variation was completely different (e.g. BCU001782, BCU001783, BCU002874). The general trend for the single accessions has been evaluated too (dashed line, Figure 2). Considering, for each
6 175 176 177 178 179 180 181 182 183 184 185 186 187 188 189 190 191 192 193 194 195 196 197 198 199 200 201 202 203 204 205 206 207 208 209 11
accession, the whole number of peaks, and that differences among consecutive years were frequently very small, it was possible to identify 4 main patterns: Pattern A (BCU001584, BCU001619; BCU001747 and BCU002476) characterised by a higher number of peaks in 2013 and 2015 and a lower number of peaks in 2014 and 2016; Pattern B (BCU001672, BCU001754, BCU001782 and BCU001783) characterised by a higher number of peaks in the central growing seasons (2014 and 2015); Pattern C (BCU001687, BCU001698 and BCU002930) characterised by an increasing number of peaks going from 2013 to 2016; Pattern D (BCU001649, BCU001806 and BCU002874) characterised by a reduction of peaks going from the second to the third season and a constant number of peaks in the last two seasons.
3.3 Epigenetic variability among and within accessions
To better understand and visualize the epigenetic changes among and within accessions in the four years of the experiment, a principal coordinate analysis (PCoA) was carried out by considering separately the digestions carried out with the two methylation-sensitive enzymes (Figure 3 and Figure 4). As evident from both the figures, the 17 accessions already had, in 2013, and maintained at the end of the survey in 2016, clearly different epigenotypes and this despite the “at least” three years of co-cultivation, in the same field and under similar environmental conditions, before the study. The first three coordinates were able to explain a cumulative percentage of variation of 36.43% for MspI and the 36.81% for HpaII. Some variability within accession was evident but not enough to uniform the epigenotypes of the samples to a common, or highly similar, epigenetic profile.
3.3.1 EcoRI/MspI
Concerning the intra-accession variation, with MspI (Figure 3) it was possible to evidence three main attitudes: 1) accessions with the same epigenetic profile during the four years of the experiment (for example BCU001783, BCU001806 and BCU002479); 2) accessions showing variability in just one year out of four (for example BCU001619, BCU001687 and BCU001747); 3) accessions characterized by variability in more than a single year (for example BCU002476, BCU002874, and BCU002930). The most variable accession was 2874, whose epigenetic profile was different each year. It was evident that, despite growing in the same field, the different accessions respond to the environment in a different way, with some epigenotypes highly stable and others more variable. Concerning the variability among accessions, it was evident that the different samples, despite a very low level of genetic variability, had a characteristic and different epigenetic constitution that was not completely lost as a consequence of the prolonged cultivation in the same environment. Further, considering the years of the first cultivation in Cuenca, it was possible to evidence that: the accessions firstly received in 2005 and 2006 (blue circles) were mainly placed in the sector of the PCoA corresponding to positive values for the first
7 210 211 212 213 214 215 216 217 218 219 220 221 222 223 224 225 226 227 228 229 230 231 232 233 234 235 236 237 238 239 240 241 242 243 244 13
coordinate; the last ones (green triangles), from 2008 to 2010, were placed in the sector corresponding to negative values for the first coordinate; the accessions received in 2007 (red crosses) were mainly located in an intermediate position.
The analysis of the molecular variance evidenced that the variation among accessions (Table 5) was responsible for the 96% of the variance detected by the digestion with EcoRI and MspI, with just the 4% of the variance due to the variability within accessions in the four years of observation.
The average percentage of intra-accession polymorphisms, detected with MspI in the four years (Table 6), ranges between 0% (BCU001783, BCU001806 and BCU002479) and 9.69% (BCU002874). Some accessions presented epigenetic variability during the four years detectable just by one (e.g. BCU001584), two (e.g. BCU001619) or three (e.g. BCU002874) primer combinations, respectively. As an example, in the four years of the study, the epigenotype of BCU001584 was characterized by a little variation detected just by the combination of primers E37/HM1 while the other two combinations were not able to evidence any variation. Different combinations of primers were able to detect a different level of intra-accession variability in the samples under investigation (Table 6). As an example, for BCU001672 the only combination of primers able to detect the presence of variability in the four years was E38/HM2 and not E37/HM1 as for BCU001584. Considering all the accessions, it was clear that they responded differently to the three combinations of primers supporting an independent way to change in response to the environment. The combination most able to detect the presence of intra-accession variability was E37/HM1 (average percentage of polymorphisms of 3.69%), followed by E38/HM2 and E32/HM1. The global average percentage of intra-accession variability detected by MspI was 2.58 %.
3.3.2 EcoRI/HpaII
Concerning intra-accession variability, with HpaII no accessions maintained a constant epigenotype during the four years of the study. All the samples were characterized by a small or large variability that was observed in at least two years out of four. Very frequently, the samples underwent changes during all the four years, as visible in BCU001672, BCU001697, BCU001747 and so on. As for MspI, also in this case it was evident that the co-cultivation in the same environment for consecutive years was not enough to uniform the epigenotypes to a more common profile and that all the accessions, despite some variations, maintained a characteristic and very distinctive epigenetic profile that they had had since the beginning of the study. At the same time, it was also evident that the stability of the epigenotypes can vary in different accessions. Further, considering the years of the first cultivation in Cuenca, it was possible to evidence that: the accessions firstly received in 2005 and 2006 (blue circles) were mainly placed in the sector corresponding to negative values for the first coordinate and positive values for the second coordinate; the last ones (green triangles), from 2008 to 2010, were placed in the sector corresponding to positive values for the first coordinate; the accessions received in 2007 (red crosses) were mainly located in the lower part, in the sector corresponding to negative values for the second coordinate.
8 245 246 247 248 249 250 251 252 253 254 255 256 257 258 259 260 261 262 263 264 265 266 267 268 269 270 271 272 273 274 275 276 277 278 279 15
The analysis of the molecular variance evidenced once again that the variation among accessions is the main factor responsible for the observed variability (Table 5). Specifically, for HpaII the variation among accessions was responsible for the 92% of the variance detected by the digestion with EcoRI and HpaII, with just the 8% of the variance due to the variability within accessions in the four years of observation.
The average percentage of intra-accession polymorphisms, detected with HpaII during the four years (Table 6), ranges between 0.55% (BCU002479) and 12.49% (BCU001698). Contrary to MspI, where eight accessions out of seventeen did not present or presented epigenetic variability detectable with just one primer combination, with HpaII the detectable variability was higher and the majority of the accessions, 16 out of 17, were detected variable with two or three combinations of primers (Table 6). Just two accessions resulted more variable with MspI than with HpaII (BCU002874 and BCU002930), all the others resulted more polymorphic with HpaII. Accessions BCU001806, BCU002476 and BCU002479 that had highly stable epigenotypes with MspI were also highly stable with HpaII. Accession BCU001783, previously identified as highly stable with MspI (0% variability) resulted more variable with HpaII (4.96% average variability in the four years). Different combinations of primers were able to detect different levels of variability in the samples under investigation but, contrary to MspI, the combination most able to detect intra-accession variability was E38/HM2 (average level of polymorphisms of 8.09%), followed by E37/HM1 and E32/HM3 (which was always the least polymorphic combination for intra-accession variability detection). The global average percentage of intra-accession variability detected by HpaII was 5.6%. Again, it was evidenced that HpaII was able to detect more variation than MspI.
4. Discussion
Despite an extremely high economic value − the price of Saffron spice can be upper to 15,000 €/kg − Saffron is presently considered as a neglected and minor crop. Consequently, Saffron research is presently very far behind research on other crops or model plants and the amount of information available, concerning important aspects such as genetics and epigenetics, is very limited. Only recently [4] we provided clear evidence of the presence of a small genetic variability, likely arose in consequence of spontaneous mutation arose consequently the prolonged vegetative propagation, to end the debate concerning the presence, or absence, of genetic variability among Saffron accessions. At the moment, there is no evidence concerning a possible link between this small genetic variability and the high frequency of alternative phenotypes frequently observed in the field.
Taking these aspects into account, and that some of these alternative phenotypes are stable across the years while others are unstable, changing from a growing season to the subsequent one, deepening current knowledge concerning Saffron epigenetics is of high interest. Recently, as reviewed by Springer and Schmitz [15], several studies are underway to evidence the possible use of epigenetics in breeding and this could be especially important for a species like Saffron for which vegetative propagation is obligatory and not carried out to
9 280 281 282 283 284 285 286 287 288 289 290 291 292 293 294 295 296 297 298 299 300 301 302 303 304 305 306 307 308 309 310 311 312 313 314 17
preserve genotypes of interest. Consequently, classical breeding cannot be taken into consideration and epigenetic-based phenotypes could represent an interesting way to improve the crop. Obviously, in order to do this, other than the demonstration of the possible epigenetic base of interesting phenotypes, similarly to that observed by Ong-Abdullah et al. [9], an important step is the evaluation of the stability of Saffron epigenotypes in the field. Contrary to many other plants that are vegetatively propagated by tissue, in vitro, culture and using greenhouses or growth chambers, propagation in the field is the norm for Saffron.
To evaluate epigenetic variability and stability among and within Saffron accessions 17 accessions were selected because of their different geographic origin and because of the small genetic variability previously detected [4]. We considered accessions received in the Saffron germplasm collection in different years ranging from 2005 and 2010 to highlight whether the epigenotypes may somehow be influenced by the longer or shorter time of co-cultivation in the same field and by the environmental conditions. All the accessions were cultivated in close proximity excluding possible effects, because of different soil compositions, on the epigenetic profile of the samples. During the four growing seasons, no biotic stresses were detected in the experimental field. Concerning climatic conditions, a continuous monitoring of temperatures and rainfall was carried out during the vegetative growth (from September to May) and during the aestivation period. No evident signals of abiotic stresses influencing the normal growth of Saffron were detected. Regarding temperature, Saffron can tolerate cold up to -10, -15 °C without big problems and, during the experiment, temperatures never fell below these values for prolonged period to damage the accessions. Measured temperatures, all along the four growing seasons, were the typical of the area and close to the typical average values. No big differences were evidenced among the growing seasons making difficult to hypothesise an effect of temperature on the detected epigenetic variation within accessions in the four years. Concerning water necessity, Saffron is a plant very well adapted to arid and semi-arid lands. Its growth starts with the beginning of the rainy season in autumn, and the vegetative growth stops with the end of the rain in spring and water provided by rainfall is effectively used. Despite big differences in total precipitation among the four seasons, with alternation of more (2012-2013 and 2014-2015) and less (2013-2014 and 2015-2016) rainy seasons, the amount of available water was enough to sustain a normal development of the plant and of the new corms. The first season, as well as some single months, was characterised by precipitations higher than the average values. Also in this case, we detected no signals of suffering because of possible water stagnation, experimental fields drained well water avoiding stagnation. Despite the absence of evident stresses, contrary to temperature, precipitations were very different in the four seasons and we can not exclude a possible influence of this parameter on the within accession epigenetic variability evidenced with the analyses. The MS-AFLP analysis was carried out by using the two methylation-sensitive isoschizomeres MspI and HpaII, also used in several studies focused on similar topics [10, 11, 13]. With respect to these interesting studies, the main differences of our work are: 1) the focus on a sterile species; 2) the propagation in a natural environment while in vitro culture is considered an unnatural environment [7, 15]. Just three combinations of primers have been used because they proved to be very effective in analysing and
10 315 316 317 318 319 320 321 322 323 324 325 326 327 328 329 330 331 332 333 334 335 336 337 338 339 340 341 342 343 344 345 346 347 348 349 19
detecting epigenetic variability both among and within accessions [4]. The methylation-sensitive analysis highlighted a very high number of epigenetic polymorphisms (Table 1). As also reported in other papers [11], we cannot exclude that some of these polymorphisms, especially those among accessions, could have a genetic base. In this case, these polymorphisms could be the consequence of previously existing differences or base mutations at the restriction sites of the enzymes, but this possibility is likely to be infrequent and the percentage of genetic polymorphisms is undoubtedly low. This statement can be supported considering that: 1) previous analyses [4] evidenced the very low genetic variability among the selected accessions; 2) we do not follow the progeny of single plants, where results of genetic mutations can be evidenced more easily but, each year, we always sampled leaves from ten plants of the accessions in order to have the general epigenetic profile of the accession. All the analyses evidenced that the digestion with HpaII resulted in a greater number of detectable polymorphisms with respect to MspI. This is true both for the total polymorphisms − the percentage of polymorphisms is more or less 58% and 68% with MspI and HpaII, respectively − and for intra-accession variability.
The general trend of methylation changes (Figure 1) is represented by an increment in the number of detected peaks followed by a fast decrement in the last year. This can be explained by a progressive increment of demethylation from 2013 up to 2015 followed by an increment in methylation passing from 2015 to 2016. Going into the details of the single accessions (Figure 2), the situation is different and no obvious trends could be identified, the variability being more accession-dependent. Different accessions had different trends supporting a different way to interact and to respond to the environment, probably dependent on the starting epigenotypes they had at the beginning of the study. Considering the global trend for each single accession, four main trends can be recognised including 14 accessions out of 17. Among the four main patterns, pattern A, present in four accessions, is interesting, in fact we can evidence that the number of peaks follows the level of precipitation being higher in the more (2012-2013 and 2014-2015) than in the less (2013-2014 and 2015-2016) rainy seasons. One accession BCU001697 has exactly an opposite pattern: more peaks in the less rainy seasons. We can not exclude that these pattern can be a consequence of the adaptation of the accessions to the different level of precipitations. Other recurrent patterns can be detected but for them it is more difficult to try finding a connection with the climatic parameters that have been measured. Also in this case, two quite opposite patterns can be evidenced, pattern C and D. The number of peaks increases from the second season to the last one in pattern C while it decreases from the second season to the last one in pattern D. A possible explanation is that in pattern C the number of peaks increases going from the driest season to seasons having higher precipitation while in pattern D is the opposite. The fact that opposite patterns are present can support different ways for the accessions to interact with the environment despite a very similar genetic constitution.
All the analyses supported an important aspect: the different accessions were characterized by extremely different epigenotypes. Epigenetic variations, contrary to genetic variations, are influenced by environmental conditions, so it is very likely that samples from cultivation areas under different climates can be characterized
11 350 351 352 353 354 355 356 357 358 359 360 361 362 363 364 365 366 367 368 369 370 371 372 373 374 375 376 377 378 379 380 381 382 383 384 21
by different epigenomes. To reduce this effect, despite their geographical origin and after being received at the germplasm collection, samples were grown under open field conditions in the same field for at least three consecutive years to reduce, if possible, epigenetic differences between accessions before the analysis. In fact, although epigenetic states are stable by definition, they can revert at certain frequencies [23]. What we observed was that, despite the co-cultivation before the study and despite the continuous co-cultivation in the four years of the experiment, all the accessions maintained, with just minor changes, a characteristic epigenotype clearly different from the other accessions (Figure 3 and Figure 4), supporting a high stability of the epigenetic structure in Saffron. It is reported that the vast majority of environmentally induced DNA methylation changes are reset during generational transitions [24, 7] but this is mainly true for sexually reproducing species. The obligatory vegetative reproduction of Saffron is likely important to maintain stable, for several consecutive years, the big part of the epigenotype despite the environmental conditions. At the same time, it was possible to see that the accessions could be somehow grouped according to the year of the first cultivation in the germplasm collection. While this trend is not so strong, it could support a partial tendency for the accession toward a more uniform profile, at least in relation to reversible, and not stable, epigenetic changes. Indeed, according to some authors, those reversible changes, while having an epigenetic base, must just be considered as part of the phenotypic plasticity while a true epigenetic mark should be stable and stably transmitted to the progeny through cellular divisions (meiosis and mitosis) for several cycles [25].
Concerning intra-accession variability, it was possible to note that, during the four years of the project, all the considered accessions underwent a small number of epigenetic changes altering the epigenotype of each accession. The amount of changes varied with the accession but it was generally quite low and the average percentage of intra-accession changes was 2.58% with MspI and 5.6% with HpaII (table 5). Further, the analysis of the molecular variance evidenced that because of the intra-accession variability, the variance was smaller than the among accession variability, explaining a percentage of the 4%, MspI, and 8%, HpaII, of the total variance (Table 4). Some accession resulted in being more stable than others during the four years, having extremely little variation (Table 5): this could be a consequence of an epigenetic state more adapted to the environmental conditions the accessions faced in the field from 2013 to 2016.
This again supports a high stability of the larger part of the Saffron epigenotype with the intra-accession variability being very low. The presence of a small level of intra-accession variability, which was observed in this experiment, could be a consequence of the phenotypic plasticity and may be reversible. It is not possible to exclude the hypothesis that such reversible polymorphisms could determine some of the reversible phenotypes observed in the field.
Despite the intra-accession variability, all the accessions maintain a characteristic epigenotype clearly distinct with respect to the other accessions. As written above, alternative phenotypes in Saffron can be both, stable or unstable in subsequent growing seasons. Stable phenotypes could be a consequence of stable epigenetic marks that are transmitted to the progeny through mitosis, while unstable phenotypes could be a consequence of
12 385 386 387 388 389 390 391 392 393 394 395 396 397 398 399 400 401 402 403 404 405 406 407 408 409 410 411 412 413 414 415 416 417 418 419 23
reversible changes being part of Saffron’s phenotypic plasticity. To confirm this, detailed studies must be planned to consider accessions with alternative phenotypes and to adopt high throughput epigenomic approaches. As reported by Springer and Schmitz [15], if the inheritance of DNA methylation is very stable, any epialleles will be faithfully inherited. On the contrary, if DNA methylation patterns are unstable, then the rapid formation, or loss, of epialleles within populations is expected. In the first case, for Saffron, epigenetics could be important for breeding purposes while in the second case this is not so.
In conclusion, by following 17 accessions of Saffron in the field for four consecutive years, from 2013 up to 2016, we have been able to follow the stability of the epigenotypes in this vegetative propagated plant species characterized by an extremely reduced genetic variability. We clearly evidence that the epigenotypes of the selected accessions were very different and they were highly stable in subsequent years despite the environmental conditions and independently by the year of the first cultivation in the germplasm. At the same time, a small intra-accession variability was detected, slightly changing the epigenotypes in consecutive years and probably increasing the adaptability of single accessions to different environmental conditions. While a general trend could be identified, the single accessions were characterized by a specific trend of epigenetic variation in response to the environment. Studies considering accessions with alternative phenotypes are presently underway to deepen our epigenetic knowledge of Saffron.
Acknowledgments
This work has been partially supported by the European Union COST FA1101 Action “Omics Technologies for Crop Improvement, Traceability, Determination of Authenticity, Adulteration and Origin in Saffron” ” and the Spanish project INIA RFP2014-00012 “Conservation and management of germplasm collections of the Spanish Network in Bank of Plant Germplasm of Cuenca”.
References
1. J.A. Fernández, Biology, biotechnology and biomedicine of saffron, in: S.G. Pandalai, (Eds.), Recent Research Developments in Plant Science, Vol. 2, Research Signpost, 2004, pp. 127-159.
2. Rubio Moraga, R. Castillo López, L. Gómez Gómez, O. Ahrazem, Saffron is a monomorphic species as revealed by RAPD, ISSR and microsatellite analyses, BMC. Res. Notes. 2 (2009) 189.
13 420 421 422 423 424 425 426 427 428 429 430 431 432 433 434 435 436 437 438 439 440 441 442 443 444 445 446 447 448 449 450 451 452 25
3. L. Siracusa, F. Gresta, G. Avola, E. Albertini, L. Raggi, G. Marconi, G.M. Lombardo, G. Ruberto, Agronomic, chemical and genetic variability of saffron (Crocus sativus L.) of different origin by LC-UV–vis-DAD and AFLP analyses, Genet. Resour. Crop. Evol. 60 (2013) 711-721.
4. M. Busconi, L. Colli, R.A. Sánchez, M. Santaella, M. De-Los-Mozos Pascual, O. Santana, M. Roldán, J.A. Fernández, AFLP and MS-AFLP Analysis of the Variation within Saffron Crocus (Crocus sativus L.) Germplasm, PLoS ONE. 10(4) (2015) e0123434.
5. M. De Los Mozos Pascual, O. Santana Méridas, M.F. Rodríguez Conde, R. Sánchez Vioque, T. Pastor Férriz, J.A. Fernández, M. Santaella, R.A. Sánchez, T. Verwulgen, M. Palacios, B. Renau Morata, E. Sanchís, A. García Luis, J.L. Guardiola, R.V. Molina, A preliminary Characterisation of Saffron germplasm from the Crocusbank collection. Acta. Hortic. 850 (2010) 35-40.
6. Y.M. Agayev, J.A. Fernandez, E. Zarifi, Clonal selection of saffron (Crocus sativus L.): the first optimistic experimental results. Euphytica. 169 (2009) 81-99.
7. D.K. Seymour, C. Becker, The causes and consequences of DNA methylome variation in plants. Curr. Opin. Plant. Biol. 36 (2017) 56-63.
8. E. Wischnitzki, E.M. Sehr, K. Hansel-Hohl, M. Berenyi, K. Burg, S. Fluch, How to Isolate a Plant’s Hypomethylome in One Shot. BioMed. Res. Int. (2015) 12.
9. M. Ong-Abdullah, J.M. Ordway, N. Jiang, S.E. Ooi, S.Y. Kok, N. Sarpan, N. Azimi, A.T. Hashim, Z. Ishak, S. K. Rosli, F.A. Malike, N.A.A. Bakar, M. Marjuni, N. Abdullah, Z. Yaakub, M.D. Amiruddin, R. Nookiah, R. Singh, E.T. Leslie Low, K.L. Chan, N. Azizi, S.W. Smith, B. Bacher, M.A. Budiman, A. Van Brunt, C. Wischmeyer, M. Beil, M. Hogan, N. Lakey, C.C. Lim, X. Arulandoo, C.K. Wong, C.N. Choo, W.C. Wong, Y.Y. Kwan, S.S.R.S. Alwee, R. Sambanthamurthi, R.A. Martienssen, Loss of Karma transposon methylation underlies the mantled somaclonal variant of oil palm, Nature. 525 (2015) 533-537.
10. P. Smykal, L. Valledor, R. Rodriguez, M. Griga, Assessment of genetic and epigenetic stability in long-term in vitro shoot culture of pea (Pisum sativum L.), Plant. Cell. Rep. 26 (2007) 1985-1998.
14 453 454 455 456 457 458 459 460 461 462 463 464 465 466 467 468 469 470 471 472 473 474 475 476 477 478 479 480 481 482 483 484 485 27
11. M. Díaz-Martínez, A. Nava-Cedillo, J.A. Guzmán-López, R. Escobar-Guzmán, J. Simpson, Polymorphism and methylation patterns in Agave tequilana Weber var. ‘Azul’ plants propagated asexually by three different methods. Plant Sci. 185-186 (2012) 321-330.
12. P. Schellenbaum, V. Mohler, G. Wenzel, W. Bernard, Variation in DNA methylation patterns of grapevine somaclones (Vitis vinifera L.). BMC. Plant. Biol. 8 (2008) 78.
13. R. Bobadilla Landey, A. Cenci, F. Georget, B. Bertrand, G. Camayo, E. Dechamp, J. C. Herrera, S. Santoni, P. Lashermes, J. Simpson, H. Etienne, High Genetic and Epigenetic Stability in Coffea arabica Plants Derived from Embryogenic Suspensions and Secondary Embryogenesis as Revealed by AFLP, MSAP and the Phenotypic Variation Rate, PLoS ONE. 8(2) (2013) e56372.
14. X. Gao, D. Yang, D. Cao, M. Ao, X. Sui, Q. Wang, J.N. Kimatu, l. Wang, In Vitro Micropropagation of Freesia hybrida and the Assessment of Genetic and Epigenetic Stability in Regenerated Plantlets. J. Plant. Growth. Regul. 29 (2010) 257-267.
15. N.M. Springer, R.J. Schmitz, Exploiting induced and natural epigenetic variation for crop improvement, Nat. Rev. Genet. 18 (2017) 563-575.
16. G. Soffritti, M. Busconi, R.A. Sánchez, J.M. Thiercelin, M. Polissiou, M. Roldán, J.A. Fernández, Genetic and epigenetic approaches for the possible detection of adulteration and auto-adulteration in saffron (Crocus sativus L.) spicem Molecules. 21 (2016) 343.
17. G. Marconi, R. Pace, A. Traini, L. Raggi, S. Lutts, M. Chiusano, M. Guiducci, M. Falcinelli, P. Benincasa, E. Albertini, Use of MSAP markers to analyse the effects of salt stress on DNA methylation in rapeseed (Brassica napus var. oleifera). PLoS ONE. 8 (2013) e75597.
18. L. Stagnati, G. Soffritti, A. Lanubile, M. Busconi, Comparison of six methods for the recovery of PCR-compatible microbial DNA from an agricultural biogas plant, Appl. Microbiol. Biotechnol. 101 (2017) 3907.
19. R. Peakall, P.E. Smouse, GenAlEx 6.5: genetic analysis in Excel. Population genetic software for teaching and research. Mol. Ecol. Notes. 6 (2006) 288-295.
15 486 487 488 489 490 491 492 493 494 495 496 497 498 499 500 501 502 503 504 505 506 507 508 509 510 511 512 513 514 515 516 517 518 519 29
20. R. Peakall, P.E. Smouse, GenAlEx 6.5: genetic analysis in Excel. Population genetic software for teaching and research – an update, Bioinformatics. 28 (2012) 2537-2539.
21. L. Excoffier, P. Smouse, J. Quattro, Analysis of molecular variance inferred from metric distances among DNA haplotypes: application to human mitochondrial DNA restriction data. Genetics. 131 (1992) 479-491.
22. R Core Team R: A language and environment for statistical computing. R Foundation for Statistical Computing, Vienna, Austria. (2017) URL https://www.R-project.org/.
23. J. Paszkowski, U. Grossniklaus, Selected aspects of transgenerational epigenetic inheritance and resetting in plants. Curr. Opin. Plant. Biol. 14 (2011) 195-203.
24. Wibowo, C. Becker, G. Marconi, J. Durr, J. Price, J. Hagmann, R. Papareddy, H. Putra, J. Kageyama, J. Becker, D. Weigel, J. Gutierrez-Marcos, Hyperosmotic stress memory in Arabidopsis is mediated by distinct epigenetically labile sites in the genome and is restricted in the male germline by DNA glycosylase activity, Elife. (2016) 5.
25. E.J. Richards, Natural epigenetic variation in plant species: a view from the field. Curr. Opin. Plant. Biol. 14 (2011) 204-209. 16 520 521 522 523 524 525 526 527 528 529 530 531 532 533 534 535 536 537 538 539 540 541 542 543 544 545 546 547 548 549 550 551 552 553 554 555 556 557 31
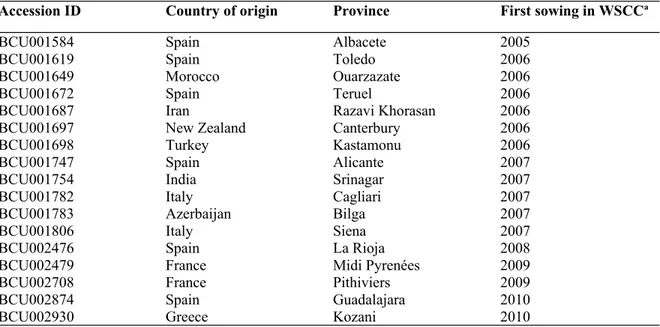
Table 1. Information concerning the identification and geographic origin (country and province or Region) has been reported. The last column reports when the accessions have been received and cultivated for the first time in the experimental field of the WSCC in Cuenca (Spain).
Accession ID Country of origin Province First sowing in WSCCa
BCU001584 Spain Albacete 2005
BCU001619 Spain Toledo 2006
BCU001649 Morocco Ouarzazate 2006
BCU001672 Spain Teruel 2006
BCU001687 Iran Razavi Khorasan 2006
BCU001697 New Zealand Canterbury 2006
BCU001698 Turkey Kastamonu 2006
BCU001747 Spain Alicante 2007
BCU001754 India Srinagar 2007
BCU001782 Italy Cagliari 2007
BCU001783 Azerbaijan Bilga 2007
BCU001806 Italy Siena 2007
BCU002476 Spain La Rioja 2008
BCU002479 France Midi Pyrenées 2009
BCU002708 France Pithiviers 2009
BCU002874 Spain Guadalajara 2010
BCU002930 Greece Kozani 2010
a: World Saffron and Crocus Collection.
17 558 559 560 561 562 563 564 565 566 567 568 569 570 571 572 573 574 575 576 577 578 579 580 33
Table 2. List of primers used for MS-AFLPs markers
Primer Analysis Typology Primer Sequence
E01a MS-AFLP Preselective GACTGCGTACCAATTCAc
HM0b MS-AFLP Preselective ATCATGAGTCCTGCTCGGT
E32 MS-AFLP Selective GACTGCGTACCAATTCAAC
E38 MS-AFLP Selective GACTGCGTACCAATTCACT
E40 MS-AFLP Selective GACTGCGTACCAATTCAGC
HM1 MS-AFLP Selective ATCATGAGTCCTGCTCGGTAA
HM2 MS-AFLP Selective ATCATGAGTCCTGCTCGGTCC
HM3 MS-AFLP Selective ATCATGAGTCCTGCTCGGTTC
a) International code for AFLP primers from the Standard List for AFLP Primer Nomenclature; b) Custom codes for MS-AFLP MspI/HpaII preselective and selective primers; c) The selective nucleotides are shown underlined in bold. 18 581 582 583 584 585 586 587 588 589 590 591 592 593 594 595 596 597 598 599 600 601 602 603 604 605 606 607 608 609 610 35
Table 3. Meteorological information (period from June 2012 to May 2016) collected at the Centro de Investigación Agroforestal de Albadalejito. Concerning temperatures, the average temperature of the months and of the growing seasons are provided. Concerning rainfall, the monthly precipitations and the cumulative values of gthe growing seasons are provided. Growing season is considered from June until May of the subsequent year even the length of the vegetative growth is smaller starting on September and ending on May. In bold are reported: the period, the average temperature for the season, the global amount of rain for the season.
Period MATa (ºC) ATSb (ºC) MTPc (mm) CPSd (mm) Period MATa (ºC) ATSb (ºC) MTPc (mm) CPSd (mm) 2012-06 19,7 11,7 11,5 11,5 2014-06 17,7 11,6 38,0 38,0 2012-07 22,1 17,1 28,6 2014-07 19,8 8,0 46,0 2012-08 23,4 0,0 28,6 2014-08 20,8 0,0 46,0 2012-09 17,6 43,5 72,1 2014-09 17,7 46,3 92,3 2012-10 12,3 85,1 157,2 2014-10 13,6 33,7 126,0 2012-11 7,5 88,2 245,4 2014-11 7,7 115,0 241,0 2012-12 3,8 14,6 260,0 2014-12 3,0 36,7 277,7 2013-01 3,5 53,6 313,6 2015-01 2,3 47,4 325,1 2013-02 3,5 30,5 344,1 2015-02 2,2 35,5 360,6 2013-03 6,8 151,5 495,6 2015-03 7,1 32,4 393,0 2013-04 9,3 56,0 551,6 2015-04 10,1 26,3 419,3 2013-05 11,0 37,4 589,0 2015-05 16,9 17,8 437,1 2013-06 17,6 12,0 3,2 3,2 2015-06 19,8 12,2 15,6 15,6 2013-07 22,4 0,8 4,0 2015-07 25,4 5,8 21,4 2013-08 22,0 39,6 43,6 2015-08 22,6 10,0 31,4 2013-09 17,9 14,4 58,0 2015-09 16,7 14,3 45,7 2013-10 13,7 30,5 88,5 2015-10 12,1 35,2 80,9 2013-11 5,9 16,4 104,9 2015-11 7,0 17,7 98,6 2013-12 3,3 41,4 146,3 2015-12 5,3 1,0 99,6 2014-01 4,7 71,7 218,0 2016-01 4,5 41,1 140,7 2014-02 3,9 91,7 309,7 2016-02 5,1 87,7 228,4 2014-03 7,0 28,9 338,6 2016-03 5,9 41,5 269,9 2014-04 12,0 19,4 358,0 2016-04 9,3 77,8 347,7 2014-05 13,0 8,1 366,1 2016-05 13,0 50,1 397,8
a: Monthly Average Temperature; b: Average Temperature in Saffron Growing Season (June to May); c: Monthly Total Precipitation; d: Cumulative Precipitation in Saffron Growing Season (June to May).
19 611 612 613 614 615 616 617 618 619 620 621 622 623 624 625 626 627 628 629 37
Table 4. Polymorphisms highlighted by the different classes of molecular markers Primer
combination
Polymorphic/total
MspI
% polymorphism Polymorphic/total HpaII %
polymorphism E37/HM1 39/67 58.21 56/67 83.58 E38/HM2 55/99 55.56 76/99 76.77 E32/HM3 49/78 62.82 34/78 43.59 Total 143/244 58.61 166/244 68.03 20 630 631 632 633 634 635 636 637 638 639 640 641 642 643 644 645 646 647 648 649 650 651 652 653 654 655 656 657 658 659 660 39
Table 5. Analysis of molecular variance (AMOVA) for the two methylation-sensitive enzymes
Enzyme Source of
variation
Degrees of
freedom Sumsquares of Meansquares of Variancecomponent Partition %
MspI Among Accessions 16 1151,235 71,952 17,823 96% Within Accessions 51 33,750 0,662 0,662 4% Total 67 1184,985 18,484 100% HpaII Among Accessions 16 1375,441 85,965 21,021 92% Within Accessions 51 96,000 1,882 1,882 8% Total 67 1471,441 22,903 100% 21 661 662 663 664 665 666 667 668 669 670 671 672 673 674 675 676 677 678 679 680 681 682 683 684 685 686 41
Table 6. For each combination of enzymes (EcoRI/MspI and EcoRI/HpaII) is reported the datum (percentage) of the intra-accession variability during the four years of observation (2013, 2014, 2015 and 2016) with the three combinations of primers that were employed. As an example, in the four years of the study, the epigenotype of BCU001584 was characterized by a small variation
EcoRI/MspI EcoRI/HpaII
Accessions % intra-accession polymorphic signals with different combination of primers
E37/HM1 E38/HM2 E32/HM3 Averagea E37/HM1 E38/HM2 E32/HM3 Average
BCU00158 4 4.35 0 0 1.45 8.69 5.36 0 4.68 BCU00161 9 6.67 2.94 0 3.2 5.56 4.55 0 3.37 BCU00164 9 4.55 0 0 1.52 4 5.36 3.85 4.44 BCU00167 2 0 19.44 0 6.48 4.76 16.67 0 7.14 BCU00168 7 5 0 2.08 2.36 7.69 4.41 8 6.7 BCU00169 7 5.26 0 0 1.75 10.71 14 0 8.24 BCU00169 8 0 2.86 2.08 1.65 16.67 10.45 10.34 12.49 BCU00174 7 0 3.23 2.27 1.83 15.15 9.43 6.9 10.49 BCU00175 4 3.85 0 2.04 1.96 2.7 12.73 3.7 6.38 BCU00178 2 8 3.03 0 3.68 2.44 15.09 0 5.84 BCU00178 3 0 0 0 0 5.26 9.61 0 4.96 BCU00180 6 0 0 0 0 0 4.55 4.35 2.97 BCU00247 6 0 2.86 0 0.95 3.03 5.66 0 2.9 BCU00247 9 0 0 0 0 0 1.64 0 0.55 BCU00270 8 0 3.23 2.22 1.06 16.28 7.58 2.78 8.88 BCU00287 4 24.14 3.12 1.82 9.69 2.56 5.36 0 2.64 BCU00293 0 5.71 8.89 1.96 5.52 2.56 5.08 0 2.55 Averageb 3.97 2.92 0.85 / 6.36 8.09 2.35 /
Global average MspIc 2.58 Global average HpaIIc 5.6
a: the average percentage of polymorphic signals, out of the total of signals scored with that primer combination, for each accession; b) the average percentage of polymorphic signals detected in the 17 accessions by each primer combination; c) the global average percentage of polymorphic signals detected with the two methylation-sensitive enzymes (MspI and HpaII) .
22 687 688 689 690 691 692 693 694 695 696 697 43
Figure 1. Global trend of the methylation changes detected with the two enzymes during the four years of the study (from 2013 to 2016). For each year, we consider all the peaks that have been detected. It is possible to see that, while the two independent trends are slightly different, the general trend (MspI + HpaII) is characterized by an increment of peaks from 2013 to 2015 and a following decrement from 2015 to 2016.
Figure 2. Different patterns of variation in the number of peaks during the four years of the study for the single accessions. Each accession is reported in a single panel. For each accession, the X-axis shows the four different years while the Y-axis reports: on the left, the number of peaks detected with the three primer combinations in the accessions by the single enzymes (HpaII (×) and MspI (●)); on the right, the global number of peaks (HpaII + MspI, dashed line) to visualise the global trend of the accession in the consecutive growing season.. Usually HpaII provides a higher number of peaks as visible in 11 accessions. In four accessions, the number of peaks is higher with MspI and in two accessions, BCU001584 and BCU002476, the number of peaks is quite similar with both enzymes.
Figure 3. Principal coordinate analysis of the epigenetic variation detected among and within accessions with the MS-AFLP analysis. The digestion was carried out using, as methylation-sensitive enzyme, MspI. The different accessions were highlighted based on the year they were received at the germplasm. Three main groups were defined. 1) the accessions received in years 2005 and 2006; 2) the accessions received in 2007; 3) the accessions received in years 2008, 2009 and 2010.
Figure 4. Principal coordinate analysis of the epigenetic variation detected among and within accessions with the MS-AFLP analysis. The digestion was carried out using, as methylation-sensitive enzyme, HpaII. The different accessions were highlighted based on the year they were received at the germplasm. Three main groups were defined. 1) the accessions received in years 2005 and 2006; 2) the accessions received in 2007; 3) the accessions received in years 2008, 2009 and 2010.
23 698 699 700 701 702 703 704 705 706 707 708 709 710 711 712 713 714 715 716 717 718 719 720 721 722 723 724 725 726 727 728 729 730 731 732 45
Figure 1. 24 733 734 735 736 47
Figure 2. 25 737 738 739 740 49
Figure 3. 26 741 742 743 744 745 746 747 748 749 750 751 752 753 754 755 756 757 758 759 760 761 762 51
Figure 4.
27 763
764