INSTRUMENT
A
TION VIE
WPOINT
Sessions
109
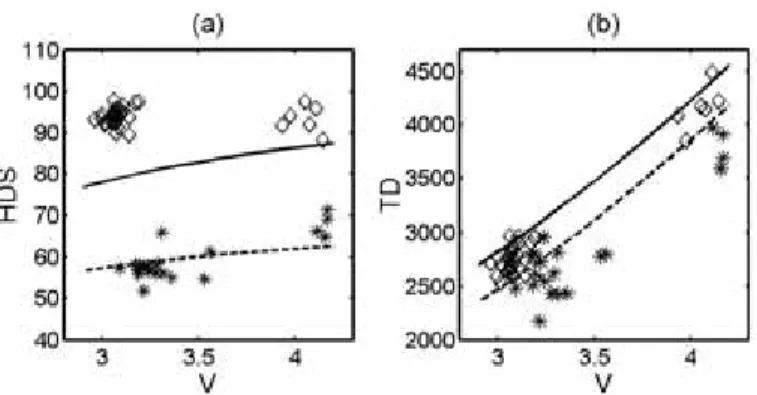
Central Adriatic Sea (Sala et al. 2007). Due to the high cost of suchtrials we chose to use sea trials carried out at two diff erent bottom depths at which two diff erent towing speeds were tested (named WL450 and WL200 the fi rst and the second cruise respectively). Then we applied the computer-based simulation program to make a pre-liminary comparison with experimental results collected. In order to set up the model it is fi rst necessary to characterize the net resistance and the horizontal net opening for this particular gear (see PREMECS-II 2006; Sala et al. 2007). As a starting point we have compared the horizontal door spread and the total gear drag with experimental data (see Figure 1). Preliminary results of the model suggest a cor-relation with general behaviour of experimental data. The model results reacted in a similar way when the warp lenght/depth or tow-ing speed was changed. We found the average relative diff erence to be less than 11% between model results and experimental data. The
principal sources of discrepancies in our opinion are the model as-sumptions and the use of a diff erent trawl door.
In summary, we have shown the potential of the model to analyze a bottom trawl fi shing gear. A relevant feature of the model is that it skips a detailed simulation of the net and hence provide approxi-mate results at negligible computational cost. The model results ob-tained are considered satisfactory, and we think that at present com-puter simulation methods for fi shing dynamics can estimate fi shing net shape confi gurations and loads in as much detail as fl ume tank tests. We are aware, however, that further comparison with data is necessary before reaching defi nitive conclusions.
Acknowledgements: This research has been developed under the Spanish PETRI project “Optimización informática para el diseño, con-strucción y prueba de artes de pesca de arrastre” (PTR1995-0735-OP). We wish to thank to J. Fernández from MAPSA S.L. for his invaluable collaboration.
References
[1] Fiorentini L., A. Sala, K. Hansen, G. Cosimi, and V. Palumbo (2004). Compari-son between model testing and full-scale trials of new trawl design for italian bottom fi sheries. Fisheries Science 70, 349–359.
[2] Folch, A., J. Prat, J. Antonijuan, A. Manuel, A. Sala, F. Sardà (2007). Accepted to be Published at book from IMAM07 meeting edited by Taylor and Francis co.
[3] Sala, A., A. Lucchetti, and G. Buglioni (2007). The infl uence of twine thick-ness on the size selectivity of polyamide codends in a mediterranean bottom trawl. Fisheries Research 83, 192–203.
[4] PREMECS-II (2006). Development of predictivemodel of cod-end selectiv-ity. Final report to the european commission of the RTD project Q5RS-2002-01328. pp. 265.
Figure 1: Horizontal door spread HDS (m) and total drag TD (kg) as a function of towing speed V (kn). Solid line/dashed line from results of the model and diamonds/stars from experimental data (WL450/WL200 resp.).
LINKING SHAPE, TAXONOMY AND FUNCTION IN TELEOST
FISH: A MACHINE LEARNING APPROACH
F. Antonucci (1), C. Costa (1-2), M. Scardi (1), S. Cataudella (1)
(1) University of Rome Tor Vergata, Dept. Biology, Via della Ricerca Scientifica – 00188 Roma – ITALY Tel:
+39-06-7259-5972 e-mail: [email protected]
(2) Agritech Lab CRA-I.S.M.A. Via della Pascolare, 16 - 00016 Monterotondo (Roma) – ITALY
1. Introduction
Teleosts, with an estimated 23,600 extant species [1], are the most di-verse group of vertebrates. Teleosts have a great taxonomic diversity which is accompanied by a wide variety of morphological patterns and adaptations to diff erent freshwater, brackish, and marine habi-tats all over the world [2]. The form constrains the use of resources through performance of important tasks and resource availability helps in constructing the form. This occurs via the evolution by de-termining which tasks are the most important for the increase of the fi tness [3]. A method to predict the habitat use based solely on the fi sh morphology may be based on the ecomorphological approach [4]. To overcome sparse or absent habitat use information in deter-mining suitable habitat criteria, especially for rare fi shes or communi-ties, a statistical approach can be used to obtain a generalized model that share similar morphological, physiological and behavioural con-straints. The aim of this study is to fi nd a model to predict ecology and phylogeny of Teleosts only from their external body shape. Finally, a sensitivity analysis of the neural network model was conducted to evaluate the relative importance of each predictive variable.
2. Results and Discussion
The morphological traits of 1203 selected species were analysed
with two types of statistical comparative and quantitative analysis: the geometric morphometry and the artifi cial neural networks (ANN) (Multilayer Perceptron). The ANN training was performed using the most common training algorithm, i.e. the error back-propagation al-gorithm. The best architecture of the ANN was empirically defi ned after a set of test runs in which diff erent numbers of hidden layers nodes were used. The fi nal ANNs, had 38+n input nodes (19 x y land-marks coordinates + n grouping variables), 20 nodes in the hidden layer and n output nodes (n grouping variables) [5]. For each species a total number of 19 landmarks were identifi ed (Fig. 1) as reported by Costa and Cataudella (2006). Landmarks are defi ned as homologous points which bear information on the geometry of biological forms [6]. Points were digitized using the software TPSdig [7] applied to the left side of each specimen.
Results on the relationship between body shape and phylogeny show their co-variation according to morpho-functional aspects de-scribed by Webb [8]. ANN sensitivity analysis on the taxonomical or-der suggests that this variable is especially infl uenced by the relative position of three morphological characters: the pectoral, the dorsal and the anal fi ns (Fig.2).
INSTRUMENT
A
TION VIE
WPOINT
Sessions
110
Figure 1: Landmark’s pattern.
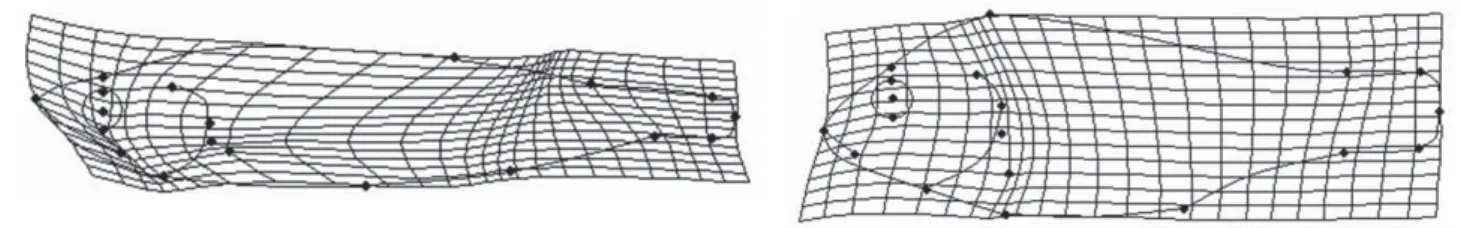
Body shape diff erences between groups were visualized and de-scribed through the deformation grids (splines). Figure 3 shows the splines of the extreme values of CAN1 of Canonical Variates Analysis (CVA) of the Ecology variable The spline of the negative side of CAN1 axis (left side of Fig.3) corresponds to a pelagic fi sh: this shape has a narrower and longer body, a larger mouth gap and a longer and nar-rower caudal peduncle. The spline of the positive side of CAN1 (right side of Fig.3) corresponds to a reef-associated fi sh with a shorter body, a narrower mouth gap and a shorter caudal peduncle.
Figure 2: Sensitivity analysis of the variable “Taxonomical Order” with the three most perturbed landmarks (Sparus aurata in the ex-ample).
3. Conclusions
This study suggests: 1) the use of new tools to understand phylo-genetic relationships of Teleosts based on a morpho-functional ap-proach. 2) at a larger scale a non phylogenetically based relation-ships between shape and ecology in Teleosts. Among the potential applications of this study the most promising is probably the auto-matic recognition of fi sh shapes in fi led conditions, e.g. for monitor-ing fi sh assemblage composition.
4. References
[1] J.S. Nelson, Fishes of the World, J. Wiley & Sons, Inc., New York, Third edition, 600 pp., 1994.
[2] G. Arratia, Phylogenetic relationships of Teleostei. Past and present, In-stitut für paláontologie, museum für naturkunde der humboldt universitát. Invalidenstr 43, d- 10115 Berlin, Germany, 2000.
[3] M.D. Chan, Fish ecomorphology: predicting habitat preferences of stream fi shes from their body shape, Blacksburg, Virginia 24061-0321, 2001. [4] T.W. Schoener, Mechanistic approaches to community ecology: a new re-ductionism, Amer. Zool. 26:81-106, 1986.
[5] C. Costa, A. Loy, S. Cataudella, D. Davis and M. Scardi, Extracting fi sh size using dual underwater cameras, Aquacultural Engineering, 35:218-227, 2006.
[6] F.L. Bookstein, Morphometric tools for landmark data: geometry and biol-ogy, Cambridge: Cambridge Univ. Press, 1991.
[7] F.J. Rohlf, TpsSuper, ver. 1.40, Dept. of Ecology and Evolution. State Univ. of New York SUNY ay Stony Brook, 2004.
[8] P.W. Webb, Form and function in fi sh swimming, Sci. Am. 251(1): 72–82, 1984.
Figure 3: Splines of the extreme values of CAN1 of the CVA on the Ecology variable. On the left side: spline relative to the negative part of CAN1. On the right side: spline relative to the positive part of CAN1.