Nd
3+:Ga-Ge-Sb-S glasses and fibers for
luminescence in mid-IR: synthesis, structural
characterization and rare earth spectroscopy
R. C
HAHAL,1F.
S
TARECKI,1,2J.-L.
D
OUALAN,2P.
N
ĚMEC,3A. T
RAPANANTI,4C.
P
RESTIPINO,1G.
T
RICOT,5C.
B
OUSSARD-P
LEDEL,1K. M
ICHEL,6A.
B
RAUD,2P.
C
AMY,2J.-L.
A
DAM,1B.
B
UREAU,1ANDV. N
AZABAL1,*1ISCR, UMR-CNRS 6226 Université de Rennes 1, 35042 Rennes, France
2CIMAP, UMR 6252 CEA-CNRS-ENSI Caen, Université de Caen, 14050 Caen, France 3Faculty of Chemical Technology, University of Pardubice, 53210 Pardubice, Czech Republic 4CNR-IOM-OGG c/o ESRF, F-38043 Grenoble, France
5UCCS, UMR 8181, ENSCL-C7, Université de Lille 1 – 59655 Villeneuve d’Ascq, France 6Bureau de Recherches Géologiques & Minières, F – 45060 Orléans, France
Abstract: With high refractive indices, appropriate solubility of rare earth, low phonon
energy and transparency from the visible to 10 µm, a Ga-Ge-Sb-S system allows emission
from Nd3+ ions in the near- and mid-IR spectral ranges. The glass transition temperature,
density, expansion coefficient, and near and mid-IR refractive indexes were measured on bulk samples. Their glass network structures were analyzed by Raman scattering spectrometry,
NMR of 71Ga and extended X-ray absorption fine structure (EXAFS, K-edge of Ga, Ge, Sb, S
and Nd). The absorption and emission spectra of neodymium doped sulfide glasses were recorded from the visible to the mid-IR. Excited state lifetimes were measured for several transitions. The lifetimes decrease with the concentration of Nd3+, especially for the 4I
13/2 and 4I
11/2 levels. The spectroscopic parameters were determined by the Judd-Ofelt method,
allowing the calculation of cross-section emissions and the evaluation of quantum yields. Optical attenuation and emission measurements of fiber were also performed with a broad 4.7-5.7 µm emission band in the mid-IR.
© 2018 Optical Society of America under the terms of the OSA Open Access Publishing Agreement
OCIS codes: (160.2290) Fiber materials; (160.2540) Fluorescent and luminescent materials; (160.2750) Glass and
other amorphous materials; (160.5690) Rare-earth-doped materials; (300.1030) Absorption; (300.2140) Emission; (300.6280) Spectroscopy, fluorescence and luminescence.
References and links
1. J. S. Sanghera and I. D. Aggarwal, “Active and passive chalcogenide glass optical fibers for IR applications: a review,” J. Non-Cryst. Solids 257, 6–16 (1999).
2. M. F. Churbanov, I. V. Scripachev, V. S. Shiryaev, V. G. Plotnichenko, S. V. Smetanin, E. B. Pyrkov, and Y. N. Galagan, “Chalcogenide glasses doped with Tb, Dy and Pr ions,” J. Non-Cryst. Solids 326, 301–305 (2003). 3. J. Heo, “Rare-earth doped chalcogenide glasses for fiber-optic amplifiers,” J. Non-Cryst. Solids 326-327, 410–
415 (2003).
4. T. Schweizer, D. W. Hewak, B. N. Samson, and D. N. Payne, “Spectroscopy of potential mid-infrared laser transitions in gallium lanthanum sulphide glass,” J. Lumin. 72–74, 419–421 (1997).
5. J. S. Sanghera, L. B. Shaw, L. E. Busse, V. Q. Nguyen, P. C. Pureza, B. C. Cole, B. B. Harbison, I. D. Aggarwal, R. Mossadegh, F. Kung, D. Talley, D. Roselle, and R. Miklos, “Development and infrared applications of chalcogenide glass optical fibers,” Fiber Integr. Opt. 19(3), 251–274 (2000).
6. D. J. Lee, J. Heo,and S. H. Park, “Energy transfer and 1.48 mu m emission properties in chalcohalide glasses
doped with Tm3+ and Tb3+,” J. Non-Cryst. Solids 331, 184–189 (2003).
7. M. Ichikawa, Y. Ishikawa, T. Wakasugi, and K. Kadono, “Near- and mid-infrared emissions from Dy3+ and
Nd3+-doped Ga
2S3-GeS2-Sb2S3 glass,” Opt. Mater. 35(11), 1914–1917 (2013).
8. H. Sakr, Z. Tang, D. Furniss, L. Sojka, S. Sujecki, T. M. Benson, and A. B. Seddon, “Promising emission
behavior in Pr3+/In selenide-chalcogenide-glass small-core step index fiber (SIF),” Opt. Mater. 67, 98–107
(2017).
#326232 https://doi.org/10.1364/OME.8.001650 Journal © 2018 Received 19 Mar 2018; revised 6 May 2018; accepted 7 May 2018; published 30 May 2018
9. B. J. Park, H. S. Seo, J. T. Ahn, Y. G. Choi, J. Heo, and W. J. Chung, “Dy3+ doped Ge-Ga-Sb-Se glasses and
optical fibers for the mid-IR gain media,” J. Ceram. Soc. Jpn. 116(1358), 1087–1091 (2008). 10. B. J. Park, H. S. Seo, J. T. Ahn, Y. G. Choi, D. Y. Jeon, and W. J. Chung, “Mid-infrared (3.5-5.5 µm)
spectroscopic properties of Pr3+-doped Ge-Ga-Sb-Se glasses and optical fibers,” J. Lumin. 128(10), 1617–1622
(2008).
11. F. Starecki, N. Abdellaoui, A. Braud, J.-L. Doualan, C. Boussard-Plédel, B. Bureau, P. Camy, and V. Nazabal,
“8 μm luminescence from a Tb3+ GaGeSbSe fiber,” Opt. Lett. 43(6), 1211–1214 (2018).
12. R. Chahal, F. Starecki, C. Boussard-Plédel, J.-L. Doualan, K. Michel, L. Brilland, A. Braud, P. Camy, B. Bureau, and V. Nazabal, “Fiber evanescent wave spectroscopy based on IR fluorescent chalcogenide fibers,” Sens. Actuators B Chem. 229, 209–216 (2016).
13. F. Starecki, S. Morais, R. Chahal, C. Boussard-Plédel, B. Bureau, F. Palencia, C. Lecoutre, Y. Garrabos, S.
Marre, and V. Nazabal, “IR emitting Dy3+ doped chalcogenide fibers for in situ CO
2 monitoring in high pressure
microsystems,” Int. J. Greenh. Gas Control 55, 36–41 (2016).
14. F. Starecki, F. Charpentier, J. L. Doualan, L. Quetel, K. Michel, R. Chahal, J. Troles, B. Bureau, A. Braud, P.
Camy, V. Moizan, and V. Nazabal, “Mid-IR optical sensor for CO2 detection based on fluorescence absorbance
of Dy3+:Ga
5Ge20Sb10S65 fibers,” Sens. Actuators B Chem. 207, 518–525 (2015).
15. M. Ichikawa, Y. Ishikawa, T. Wakasugi, and K. Kadono, “Mid-infrared emissions from Er3+ in Ga(
2)S(3)-GeS2
-Sb2S3 glasses,” J. Mater. Res. 25(11), 2111–2119 (2010).
16. A. Belykh, L. Glebov, C. Lerminiaux, S. Lunter, M. Mikhailov, A. Plyukhin, M. Prassas, and A. Przhevuskii, “Spectral and luminescence properties of neodymium in chalcogenide glasses,” J. Non-Cryst. Solids 213-214, 238–244 (1997).
17. H. Takebe, T. Ishibashi, T. Ichiki, and K. Morinaga, “Nd solubility in RS-Ga2S3 (R = Sr, Ba) glasses,” J. Ceram.
Soc. Jpn. 111(1298), 755–757 (2003).
18. B. G. Aitken, C. W. Ponader, and R. S. Quimby, “Clustering of rare earths in GeAs sulfide glass,” C. R. Chim.
5(12), 865–872 (2002).
19. L. Bodiou, F. Starecki, J. Lemaitre, V. Nazabal, J.-L. Doualan, E. Baudet, R. Chahal, A. Gutierrez-Arroyo, Y. Dumeige, I. Hardy, A. Braud, R. Soulard, P. Camy, P. Nemec, G. Palma, F. Prudenzano, and J. Charrier,
“Mid-infrared guided photoluminescence from integrated Pr3+-doped selenide ridge waveguides,” Opt. Mater. 75, 109–
115 (2018).
20. G. Le Caer, B. Bureau, and D. Massiot, “An extension of the Czjzek model for the distributions of electric field gradients in disordered solids and an application to NMR spectra of Ga-71 in chalcogenide glasses,” J. Phys.-.Condes. Matter 22, 17 (2010).
21. Y. Ledemi, B. Bureau, G. Le Caer, L. Calvez, C. Roiland, G. Tricot, P. Florian, V. Nazabal, and D. Massiot, “Ga-71 NMR in chalcogenide and chalco-halide glasses,” J. Non-Cryst. Solids 383, 216–221 (2014). 22. B. R. Judd, “Optical absorption intensities of rare earth ions,” Phys. Rev. 127(3), 750–761 (1962). 23. G. S. Ofelt, “Intensities of crystal spectra of rare earth ions,” J. Chem. Phys. 37(3), 511–520 (1962). 24. J. Kobelke, J. Kirchhof, K. Schuster, and A. Schwuchow, “Effects of carbon, hydrocarbon and hydroxide
impurities on praseodymium doped arsenic sulfide based glasses,” J. Non-Cryst. Solids 284(1-3), 123–127 (2001).
25. M. F. Churbanov, I. V. Scripachev, G. E. Snopatin, V. S. Shiryaev, and V. G. Plotnichenko, “High-purity glasses based on arsenic chalcogenides,” J. Optoelectron. Adv. Mater. 3, 341–349 (2001).
26. P. Nemec, M. Olivier, E. Baudet, A. Kalendova, P. Benda, and V. Nazabal, “Optical properties of (GeSe2)
(100-x)(Sb2Se3)(x) glasses in near- and middle-infrared spectral regions,” Mater. Res. Bull. 51, 176–179 (2014).
27. K. Jinguji, M. Horiguchi, and T. Manabe, “Spectral loss measurement system for IR optical fibers,” Appl. Opt.
21(4), 571–572 (1982).
28. R. W. G. R. Shuker and R. W. Gammon, “Raman-scattering selection-rule breaking and the density of states in amophous materials,” Phys. Rev. Lett. 25(4), 222–225 (1970).
29. C. Julien, S. Barnier, M. Massot, N. Chbani, X. Cai, A. M. Loireaulozach, and M. Guittard, “Raman and Infrared Spectroscopic Studies of Ge-Ga-Ag Sulfide Glasses,” Materials Science and Engineering B-Solid State Materials for Advanced Technology 22(2-3), 191–200 (1994).
30. K. V. Klementev, “Extraction of the fine structure from X-ray absorption spectra,” J. Phys. D Appl. Phys. 34(2), 209–217 (2001).
31. A. L. Ankudinov, B. Ravel, J. J. Rehr, and S. D. Conradson, “Real-space multiple-scattering calculation and interpretation of X-ray-absorption near-edge structure,” Phys. Rev. B 58(12), 7565–7576 (1998).
32. Y. Nakane, H. Nasu, J. Heo, T. Hashimoto, and K. Kamiya, “Second harmonic generation from thermally poled Ge-S glass system,” J. Ceram. Soc. Jpn. 113(1323), 728–732 (2005).
33. J. Chovanec, M. Chromcikova, M. Liska, J. Shanelova, and J. Malek, “Thermodynamic model and viscosity of Ge-S glasses,” J. Therm. Anal. Calorim. 116(2), 581–588 (2014).
34. J. Malek, J. Chovanec, R. Svoboda, Y. Taniguchi, and H. Kawaji, “Heat capacity of vitreous GeS2,” J. Chem.
Thermodyn. 81, 101–108 (2015).
35. J. Troles, Y. Niu, C. Duverger-Arfuso, F. Smektala, L. Brilland, V. Nazabal, V. Moizan, F. Desevedavy, and P. Houizot, “Synthesis and characterization of chalcogenide glasses from the system Ga-Ge-Sb-S and preparation of a single-mode fiber at 1.55 µm,” Mater. Res. Bull. 43(4), 976–982 (2008).
36. J. L. Z. Adam, Chalcogenide Glasses, Preparation, Properties and Applications (Woodhead Publishing Limited, 2014).
37. A. B. Seddon, “Chalcogenide Glasses - a Review of Their Preparation, Properties and Applications,” J. Non-Cryst. Solids 184, 44–50 (1995).
38. Y. Yang, Z. Yang, P. Lucas, Y. Wang, Z. Yang, A. Yang, B. Zhang, and H. Tao, “Composition dependence of physical and optical properties in Ge-As-S chalcogenide glasses,” J. Non-Cryst. Solids 440, 38–42 (2016). 39. A. Bytchkov, G. J. Cuello, S. Kohara, C. J. Benmore, D. L. Price, and E. Bychkov, “Unraveling the atomic
structure of Ge-rich sulfide glasses,” Phys. Chem. Chem. Phys. 15(22), 8487–8494 (2013).
40. H. Takebe, T. Hirakawa, T. Ichiki, and K. Morinaga, “Thermal stability and structure of Ge-Sb-S glasses,” J. Ceram. Soc. Jpn. 111(1296), 572–575 (2003).
41. L. Petit, N. Carlie, F. Adamietz, M. Couzi, V. Rodriguez, and K. C. Richardson, “Correlation between physical, optical and structural properties of sulfide glasses in the system Ge-Sb-S,” Mater. Chem. Phys. 97(1), 64–70 (2006).
42. A. M. Loireau-Lozach, F. Keller-Besrest, and S. Bénazeth, “Short and medium range order in Ga-Ge-S glasses: An X-ray absorption spectroscopy study at room and low temperatures,” J. Solid State Chem. 123(1), 60–67 (1996).
43. P. Masselin, D. Le Coq, A. Cuisset, and E. Bychkov, “Spatially resolved Raman analysis of laser induced refractive index variation in chalcogenide glass,” Opt. Mater. Express 2(12), 1768–1775 (2012).
44. A. Povolotskiy, T. Ivanova, A. Manshina, Y. Tver’yanovich, S. K. Liaw, and C. L. Chang, “Er3+ as glass
structure modifier of Ga-Ge-S chalcogenide system,” Appl. Phys., A Mater. Sci. Process. 96(4), 887–891 (2009). 45. J. H. Song, Y. G. Choi, and J. Heo, “Ge and GaK-edge EXAFS analyses on the structure of Ge-Ga-S-CsBr
glasses,” J. Non-Cryst. Solids 352(5), 423–428 (2006).
46. M. R. Davolos, A. Garcia, C. Fouassier, and P. Hagenmuller, “Luminescence of Eu2+ in strontium and barium
thiogallates,” J. Solid State Chem. 83(2), 316–323 (1989).
47. A. Garcia, F. Guillen, and C. Fouassier, “Charge-transfer excitation of the Nd3+, Sm3+, Dy3+, Ho3+, Er3+, and Tm3+
emission CaGa2S4,” J. Lumin. 33(1), 15–27 (1985).
48. R. E. Youngman and B. G. Aitken, “Structure and properties of GeGaP sulfide glasses,” J. Non-Cryst. Solids
345-346, 50–55 (2004).
49. A. W. Mao, B. G. Aitken, R. E. Youngman, D. C. Kaseman, and S. Sen, “Structure of Glasses in the
Pseudobinary System Ga2Se3-GeSe2: Violation of Chemical Order and 8-N Coordination Rule,” J. Phys. Chem.
B 117(51), 16594–16601 (2013).
50. G. Lucovsky, J. P. deNeufville, and F. L. Galeener, “Study of optic modes of Ge0.30S0.70 glass by infrared and Raman spectroscopy,” Phys. Rev. B 9(4), 1591–1597 (1974).
51. S. Sugai, “Stochastic random network model in Ge and Si chalcogenide glasses,” Phys. Rev. B Condens. Matter
35(3), 1345–1361 (1987).
52. S. D. Pangavhane, P. Němec, V. Nazabal, A. Moreac, P. Jóvári, and J. Havel, “Laser desorption ionization time-of-flight mass spectrometry of erbium-doped Ga-Ge-Sb-S glasses,” Rapid Commun. Mass Spectrom. 28(11), 1221–1232 (2014).
53. B. Liu, Z. T. Song, T. Zhang, S. L. Feng, and B. M. Chen, “Raman spectra and XPS studies of phase changes in
Ge2Sb2Te5 films,” Chin. Phys. 13(11), 1947–1950 (2004).
54. W. H. Wei, L. Fang, X. Shen, and R. P. Wang, “Transition threshold in GexSb10Se90-x glasses,” J. Appl. Phys.
115(11), 113510 (2014).
55. M. Guignard, V. Nazabal, F. Smektala, J. L. Adam, O. Bohnke, C. Duverger, A. Moreac, H. Zeghlache, A. Kudlinski, G. Martinelli, and Y. Quiquempois, “Chalcogenide glasses based on germanium disulfide for second harmonic generation,” Adv. Funct. Mater. 17(16), 3284–3294 (2007).
56. T. S. Kavetskyy, “Radiation-induced structural changes in chalcogenide glasses as revealed from Raman spectroscopy measurements,” Semiconductor Physics, Quantum Electronics & Optoelectronics 16(1), 27–36 (2013).
57. V. Nazabal, P. Nemec, A. M. Jurdyc, S. Zhang, F. Charpentier, H. Lhermite, J. Charrier, J. P. Guin, A. Moreac,
M. Frumar, and J. L. Adam, “Optical waveguide based on amorphous Er3+-doped Ga-Ge-Sb-S(Se) pulsed laser
deposited thin films,” Thin Solid Films 518(17), 4941–4947 (2010).
58. H. Higuchi, R. Kanno, Y. Kawamoto, M. Takahashi, and K. Kadono, “Local structures of Er3+ containing Ga
2S3
-GeS2-La2S3 glass,” Phys. Chem. Glasses 40, 122–125 (1999).
59. I. D. Brown, “The bond-valence method: an empirical approach to chemical structure and bonding,” Structure and Bonding in Crystals II, 1–30 (1981).
60. M. Fabian, E. Svab, V. Pamukchieva, A. Szekeres, K. Todorova, S. Vogel, and U. Ruett, “Reverse Monte Carlo modeling of the neutron and X-ray diffraction data for new chalcogenide Ge-Sb-S(Se)-Te glasses,” J. Phys. Chem. Solids 74(10), 1355–1362 (2013).
61. F. Charpentier, F. Starecki, J. L. Doualan, P. Jóvári, P. Camy, J. Troles, S. Belin, B. Bureau, and V. Nazabal,
“Mid-IR luminescence of Dy3+ and Pr3+ doped Ga
5Ge20Sb10S(Se)65 bulk glasses and fibers,” Mater. Lett. 101,
21–24 (2013).
62. Q. H. Yang, S. Z. Lu, B. Zhang, H. J. Zhang, J. Zhou, Z. J. Yuan, Y. F. Qi, and Q. H. Lou, “Preparation and laser performance of Nd-doped yttrium lanthanum oxide transparent ceramic,” Opt. Mater. 33(5), 692–694 (2011). 63. A. K. Mairaj, A. M. Chardon, D. P. Shepherd, and D. W. Hewak, “Laser performance and spectroscopic analysis
of optically written channel waveguides in neodymium-doped gallium lanthanum sulphide glass,” IEEE J. Sel. Top. Quantum Electron. 8(6), 1381–1388 (2002).
64. W. T. Carnall, P. R. Fields, and K. Rajnak, “Electronic energy levels in trivalent lanthanide aquo ions. I Pr3+
Nd3+ Pm3+ Sm3+ Dy3+ Ho3+ Er3+ and Tm3+,” J. Chem. Phys. 49(10), 4424–4442 (1968).
65. K. Kadono, M. Shojiya, M. Takahashi, H. Higuchi, and Y. Kawamoto, “Radiative and non-radiative relaxation
of rare-earth ions in Ga2S3–GeS2–La2S3 glasses,” J. Non-Cryst. Solids 259(1-3), 39–44 (1999).
66. S. Tanabe, “Optical transitions of rare earth ions for amplifiers: how the local structure works in glass,” J. Non-Cryst. Solids 259(1-3), 1–9 (1999).
67. A. L. Pelé, A. Braud, J. L. Doualan, R. Chahal, V. Nazabal, C. Boussard-Plédel, B. Bureau, R. Moncorgé, and P.
Camy, “Wavelength conversion in Er3+ doped chalcogenide fibers for optical gas sensors,” Opt. Express 23(4),
4163–4172 (2015).
68. J. L. Adam, J. L. Doualan, L. Griscom, S. Girard, and R. Moncorge, “Excited-state absorption at 1.3 µm in Nd3+
-doped fluoride and sulfide glasses,” J. Non-Cryst. Solids 256-257, 276–281 (1999).
69. A. D. Sontakke and K. Annapurna, “Spectroscopic properties and concentration effects on luminescence
behavior of Nd3+ doped Zinc-Boro-Bismuthate glasses,” Mater. Chem. Phys. 137(3), 916–921 (2013).
70. A. D. Sontakke, K. Biswas, A. K. Mandal, and K. Annapurna, “Concentration quenched luminescence and
energy transfer analysis of Nd3+ ion doped Ba-Al-metaphosphate laser glasses,” Appl. Phys. B-Lasers Opt.
101(1-2), 235–244 (2010).
71. V. Moizan, V. Nazabal, J. Troles, P. Houizot, J. L. Adam, J. L. Doualan, R. Moncorge, F. Smektala, G. Gadret,
S. Pitois, and G. Canat, “Er3+-doped GeGaSbS glasses for mid-IR fibre laser application: Synthesis and rare earth
spectroscopy,” Opt. Mater. 31(1), 39–46 (2008).
1. Introduction
Chalcogenide glasses are interesting materials due to their wide glass formation region, optical transparency window and high refractive indices. They are also well known as host
materials for rare earth ions [1–4]. They possess low phonon energy (~300-450 cm−1 for
sulfides, ~200-350 cm−1 for selenides and 150-250 cm−1 for tellurides) that limits the
non-radiative multiphonon relaxation rates. All these properties result in high quantum efficiencies for rare earth ion transitions in chalcogenide and chalcohalide glasses.
Many radiative transitions in the near-IR or middle-IR (mid-IR) have been observed in bulk chalcogenide glasses doped, for instance, with Pr3+, Tb3+, Dy3+, Ho3+, Er3+, Nd3+ and
Tm3+ ions [5–15]. Usually, Ge-Ga-As(Sb)-S sulfide systems are selected for enabling
efficient fluorescence of rare earth ions. The quaternary Ga-Ge-Sb-S glass system doped with
Nd3+ ions was selected to avoid the presence of arsenic. This system contains gallium, which
allows a better solubility of RE3+ ions than other chalcogenide matrices without gallium [16–
19]. Among this quaternary system, the nominal composition of Ga5Ge20Sb10S65 was
especially preferred for its stability against crystallization and suitable thermo-mechanical properties favoring fiber drawing. The major interest of neodymium resides in its relatively distant and very wide emission in the mid-IR expected to occur between 4.7 and 5.7 µm relevant for the development of IR sensors. In spite of that the studies on the Nd3+ emissions
in the mid-IR are not frequent [7]. In this study, influence of concentration of RE3+ on the
photoluminescence of Nd3+-doped Ga
5Ge20Sb10S65 glasses is investigated. With the variation
of chemical composition in this system, the band-gap can be shifted to lower wavelength
which could allow a better pumping at 815 nm required for Nd3+ ions. This optical band-gap
blue-shift should decrease the optical losses in the pumping spectral range specifically important in the case of fiber use. Thus, in order to blue-shift the optical band-gap, several compositions of the Ga-Ge-Sb-S quaternary system were fabricated and their physicochemical and optical properties have been studied.
The gallium and rare earths combination, their structural environment and resulting interactions, have been assumed to play a fundamental role in the luminescence effectiveness and optical losses of these glass materials and fibers. Thus structural properties have been
investigated by Raman spectroscopy, 71Ga NMR and EXAFS at K-edge of Ga, Ge, Sb, S and
Nd. Raman spectroscopy is regarded as a standard and non-destructive technique used for chalcogenide glass network analysis; although in the case of a quaternary system not to result
in a misleading interpretation is not so straightforward. Whereas 71Ga NMR, rare earths and
Ga K-edge EXAFS complementary structural characterizations are much less accessible and only few references are available in the literature [20, 21].
Moreover, absorption and emission spectra were recorded, fluorescence lifetimes for 4F 3/2, 4I
13/2 and 4I11/2 energy levels were measured and will be discussed considering spectroscopy
parameters obtained by Judd-Ofelt method and structural organization [22, 23].
2. Experimental
2.1 Glass synthesis and physicochemical characterizations
The selected sulfide glass composition for studying the effect of growing introduction of Nd3+
is the following: Ga5Ge20Sb10S65 doped with Nd3+ ions from 500 to 7500 ppmw. Several other
compositions of the Ga-Ge-Sb-S system were also investigated. These glasses were prepared by conventional melting and quenching methods. Ga, Ge, Sb and S elements with high purity
(≥ 5N) and neodymium sulfide with 3N purity were used. The commercial sulfur was purified
by successive distillations to remove carbon (CO2, CS2, COS) and hydrates or sulfides
hydrides (H2O, OH, SH) impurities [24]. Then, chemical reagents were put in silica tubes and
pumped under vacuum (10−4 mbar). After sealing, the chemical reagents were melted with
slow heating to 850°C for 10h in a rocking furnace to ensure homogenization. The ampoule was quenched into water, following by annealing at 290°C for 3h. Single index fibers with 350 µm diameter were obtained by drawing Ga5Ge20Sb10S65 and Ga5Ge20Sb5S70 preforms of
10 mm diameter and 100 mm length. Bulk glass samples were cut and polished for absorption and fluorescence measurements. Glass transition temperature was determined by using a TA Instrument differential scanning calorimeter DSC 2010, with a heating rate of 10°C/min between room temperature and 450°C. Thermodilatometric analyses were carried out on cylinders of glass approximately 5 mm high in the temperature range of 25 to 250°C by using a thermomechanical analyzer. The measurements were performed at a heating rate of 2
°C/min-1 with an applied force of 0.05 N. Density of glass was determined by using a Mettler
Toledo XS64. The composition of the different samples was checked by using scanning
electron microscopy with an energy-dispersive X-ray analyzer (X Max 80mm2 Oxford
Instruments). The [S-H] content in glasses, which was controlled by the refinement degree of the sulfur purification process, was estimated considering the experimental absorption coefficient from IR-spectra and the extinction coefficient at 4.01 µm (ε = 2.3 dB/m/ppm) [25].
2.2 Optical characterizations
Refractive indices of bulk samples in visible and near-IR were determined by prism coupling technique (Metricon-2010 instrument). A laser beam at several wavelengths (λ = 633, 825, 1064, 1311 and 1551 nm) and a rutile prism were used. Variable angle spectroscopic ellipsometer with rotating compensator (IR-VASE, J. A. Woollam Co., Inc., Lincoln, NE, USA) was employed for the optical characterization of studied materials in ~1.7-15 µm spectral range measuring 50 scans, 15 spectra per revolution at angles of incidence of 50°, 60°, and 70°. To extract optical parameters from VASE data in the 1.7-15 µm spectral region, suitable MIR refractive index spectral dependence function is necessary. In this work, Sellmeier equation in the form n2(λ) = A + (Bλ2/(λ2-C)) + (Dλ2/(λ2-E)), where λ is wavelength,
A, B, C, D, and E are empirical coefficients, was exploited setting extinction coefficient in
first approximation to zero [26].
Absorption spectra were measured with Perkin Elmer spectrometer Lambda-1050 in the wavelength range 500-3200 nm and a resolution of 1 nm. Transmission spectra in the IR region were measured with a Bruker Tensor 37 Fourier Transformed Infrared Spectrometer (FTIR) from 2.5 to 15 µm. Fiber attenuation measurements were performed by using the cut-back technique with a Bruker FTIR spectrometer modified with fiber coupling ports [27].
For room-temperature photoluminescence measurements on bulk samples, the pump source was a Ti: Sapphire laser operating at 815 nm. Emission spectra were recorded using an InSb photodiode cooled with liquid nitrogen. The beam was focused on the detector by a
CaF2 lens and filters for each emission band. As the spectral response of these detectors is
wavelength-dependent, the emission spectra were calibrated by using a tungsten-halogen lamp source and a heat source with emission spectra similar to a black-body source. To record fluorescence signals in the mid-IR spectral region without being perturbed by parasitic absorptions, the monochromator was flushed with dry nitrogen. Fluorescence decays were
measured for Nd-doped Ga5Ge20Sb10S65 by using a Nd:YAG-pumped OPO laser at 815 nm
delivering 5 ns pulses at 10 Hz with an output energy of ~5 mJ/pulse.
2.3 Structural characterizations
The structure of Ga-Ge-Sb-S glasses was investigated by means of several techniques. The
71Ga NMR experiments have been performed under static conditions at 244.04 MHz with a
18.8 T spectrometer using a 3.2 mm probe-head. The spectra have been recorded using a static 45-τ-45-τ spin echo sequence with 20-50 k accumulations, a recycle delay of 1 s, a full echo delay (2τ) of 400 µs and a 45° pulse length of 1.25 µs. It has been checked that the
experimental conditions allowed recording the whole 71Ga NMR signal. The chemical shifts
have been referred to Ga(NO3)3 solution (1 M) at 0 ppm. The Raman spectroscopy was used
at ambient temperature on glass samples with an HR800 (Horiba–Jobin-Yvon) unpolarized confocal micro-Raman spectrophotometer with 785 nm laser diode at room temperature using low power density. Reduced Raman intensity of glasses Raman spectra were calculated
considering the following equation Ired(ω) = I(ω)ω/[n(ω) + 1] [28, 29]. The term I(ω)
represents the experimental Raman intensity at ω frequency, and n(ω) is the Bose–Einstein factor, defined as n(ω) = (exp[(ħω/kT)-1])-1, where ħ is Planck’s constant.
Extended X-ray absorption fine structure (EXAFS) measurements were performed on Nd3+:Ga
5Ge20Sb10S65 glasses. EXAFS of powdered glass and bulk were recorded at K-edge of
Ga, Ge, Sb, S and Nd at the Italian beamline at ESRF Grenoble. The EXAFS measurements were recorded at room temperature in both, transmission and fluorescence modes. Raw intensities were converted into χ(k) curves by the Viper program [30]. Coordination numbers, bond lengths and Debye-Waller factors were obtained by fitting the χ(k) curves with the Viper program. Backscattering and amplitudes and phases needed to calculate the model curves were obtained by the Feff program [31].
3. Results and discussion
3.1 Nd3+ doped Ga-Ge-Sb-S bulk glasses characterization
Several compositions were synthetized with an objective of blue-shift of the band-gap by changing the concentration between the different chemical elements. The aim of this shift of the band-gap is to get higher transparency in the visible and near infrared for a better pumping of neodymium ions. Physicochemical properties like glass transition temperature, density, etc. were measured for several compositions from Ga-Ge-Sb-S system.
Table 1. Glass transition temperature, density, Ge/S ratio, stoichiometry deviation R and average coordination number Z for studied compositions
Composition Tg ( ± 2°C) Density (± 0.01g/cm3) Ratio Ge/S R Z Ga1Ge29Sb5S65 372 3.00 0.44 0.96 2.65 Ga5Ge25Sb5S65 360 3.10 0.38 0.96 2.65 Ga1Ge24Sb5S70 300 2.89 0.34 1.22 2.55 Ga5Ge20Sb10S65 296 3.21 0.30 1 2.6 Ga10Ge15Sb10S65 292 3.26 0.23 1 2.6 Ga5Ge20Sb5S70 286 2.94 0.28 1.22 2.55 Ga5Ge15Sb10S70 265 3.15 0.21 1.27 2.5
The average coordination number Z and the stoichiometry deviation R was calculated for each composition. For a glass composition GawGexSbySz, the average coordination number Z
is defined by the Eq. (1):
( ) ( ) ( ) ( ),
c c c c
Z =wN Ga +xN Ge +yN Sb +zN S (1)
with Nc(A), the coordination number of atom A; Nc(Ga) = 4, Nc(Ge) = 4, Nc(Sb) = 3 and
Nc(S) = 2; w, x, y and z, the molar fraction (w + x + y + z = 1).
The R parameter helps to determine the stoichiometry deviation of the chalcogen atoms compare to the other metalloid and metal atoms and is defined in the Eq. (2):
( ) . ( ) ( ) ( ) c c c c zN S R wN Ga xN Ge yN Sb = + + (2)
All the data concerning Ga-Ge-Sb-S glasses, glass transition temperature (Tg), density,
[Ge/S] ratio, stoichiometry deviation R and average coordination number Z for studied compositions are shown in Table 1.
Concerning temperature of glass transition, we observed that the increase of the [Ge/S]
ratio is correlated with an increase of the Tg. We can find in the literature some studies
showing the correlation between germanium amount and glass transition temperature of GexS1-x system [32–34]. In these papers, Tg is increasing with the [Ge/S] ratio when it is
below 0.5. When the ratio is equal to 0.5, it corresponds to an exact stoichiometry for GeS2,
composed of [GeS4/2] tetrahedra linked mainly by their corners and probably by edges in a
lesser extent. This 3D structure producing a highly cross-linked glass network leads to a maximal temperature of glass transition in the binary Ge-S system. In other cases, some weaker (Ge-Ge) or (S-S) homopolar bonds appear that decrease the glass transition temperature. In studied Ga-Ge-Sb-S glasses, all the glasses have a ratio [Ge/S] lower than 0.5
and the Tg is increasing following the ratio, except for the richest one in Ga
(Ga10Ge15Sb10S65), which presents Tg little bit higher than expected. This anomaly can be
explained by its thermal history. We can also notice that, as expected by a previous study, the
substitution of gallium for germanium is decreasing the Tg even if both atoms are expected to
occupy tetrahedra entities preserving similar cross-linked glass network. The difference in
bond energies between Ge-S and Ga-S may explain at least partly Tg changes [35]. The R
parameter helps to distinguish over-stoichiometric compositions with more (S-S) bonds and sub-stoichiometric compositions with more (Ge(Ga, Sb)-Ge(Ga, Sb)) or to simplify M-M bonds. Overall, the glass transition temperature increases with the average coordination number Z when R is still around 1, representative of a glass network mainly composed of Ge-S, Ga-S and Sb-S bonds more energetic than M-M bonds.
The expansion coefficient was also measured for studied glasses. A clear tendency appears, with a value of this coefficient around 13-15x10−6 K−1 for glasses with 65 mol. % of sulfur with R close to 1 (Z = 2.6-2.65) and around 17-18x10−6 K−1 for glasses with 70 mol. % of sulfur with R close to 1.2-1.3 (Z = 2.5-2.55). The expansion coefficient is clearly lower for higher glass transition temperature. A lower expansion coefficient reflects a higher cross-linked glass network and more energetic bonds.
3.2 Optical properties
Optical band-gap and refractive index for five wavelengths in the visible and near infrared are referenced in Table 2. The Fig. 1 graphically presents the optical band-gap shift for glass compositions studied.
520 560 600 640 680 720 760 800 0 2 4 6 8 10 12 14 16 18 20 A b sorpt ion c oeff ic ient [c m -1] Wavelength [nm] Ga1Ge24Sb5S70 Ga1Ge29Sb5S65 Ga5Ge29Sb5S65 Ga5Ge25Sb5S65 Ga5Ge20Sb10S65 Ga5Ge15Sb10S70 Ga10Ge15Sb10S65
Fig. 1. Absorption coefficient around optical band-gap for several glass compositions.
Concerning the optical band-gap, as expected, a shift is observed with the change of composition. The electronic absorption edge governs the short wavelength limit of the optical transmission window. Chalcogenide glasses are generally considered as amorphous
semiconductors with a characteristic optical gap, Egopt. Incident photons with energy
exceeding this gap, hν > Egopt, will excite an electron from the valence to the conduction band
creating an electron-hole pair and are absorbed during the process. Recombination of the electron-hole pair occurs in multiple non radiative steps generating phonons rather than photons. The electronic band-gap mainly depends on the electronic configuration and structural arrangement of the atoms in the material. Concerning Ga-Ge-Sb-S glasses, with introducing antimony and gallium elements, there might be an increase of delocalization of nonbonding electrons of sulfur atoms. That could decrease the gap between valence and conduction band and shift the band-gap to longer wavelengths [36]. Consequently, reducing the amount of gallium and antimony leads to the shift of the cut-off wavelength from 601 nm (Ga10Ge15Sb10S65) to 542 nm (Ga1Ge24Sb5S65). The lower electronegativity of gallium,
compare to the other elements constituting the glass, rules the band-gap shifting. Four glasses with 5 mol. % of gallium present a shift to lower wavelength; i.e. an increase of their band-gap energy compare to the glass with highest content of gallium (10 mol. %). Considering these four glasses with the same amount of gallium, two glasses with higher content of antimony (Ga5Ge15Sb10S70 and Ga5Ge20Sb10S65) present a really comparable band-gap (589
and 581 nm for the cut-off wavelength, respectively) but also smaller than the two others (560 nm for Ga5Ge20Sb5S70 and 575 nm for Ga5Ge25Sb5S65). Keeping gallium and antimony at
fixed values, the difference concerns the amount of germanium and sulfur. We could expect that the glass containing more sulfur will have a lower cut-off wavelength compare to the other considering the higher electronegativity of sulfur compare to germanium (χ(S) = 2.58 and χ(Ge) = 2.01). The only glass in contradiction with this rule is the Ga5Ge15Sb10S70 glass
for which R coefficient is the highest (R = 1.27) and its band-gap energy is likely affected by the presence of (S-S) bonds in the glass network. The formation of (S-S) bonds, generally expected in case of glass with rich amount of sulfur, will introduce localized levels at the upper part of valence band modifying the electronic structure of the glass and in this specific composition, could decrease the band-gap energy. Finally, glasses with lowest content of gallium (1 mol. %) present a lower band-gap energy with cut-off wavelength of 553 nm for Ga1Ge29Sb5S65 and of 542 nm for Ga1Ge24Sb5S70 due to their small content of antimony and
Table 2. Overview of some optical properties for several compositions in Ga-Ge-Sb-S system concerning the cut-off wavelength at α = 10 cm−1, refractive index and Abbe
number in the 3-5 µm range.
Glass composition
Optical band-gap
(nm)
Refractive index ( ± 5 x 10⁻⁴) Abbe number
in 3-5 µm range ( ± 2) 633 nm 825 nm 1064 nm 1311 nm 1551 nm Ga10Ge15Sb10S65 601 2.388 2.325 2.294 2.279 2.271 126 Ga5Ge15Sb10S70 589 2.373 2.308 2.277 2.262 2.254 147 Ga5Ge20Sb10S65 581 2.368 2.302 2.272 2.258 2.251 155 Ga5Ge25Sb5S65 575 2.284 2.234 2.208 2.196 2.189 197 Ga5Ge20Sb5S70 560 2.254 2.205 2.180 2.168 2.161 164 Ga1Ge29Sb5S65 553 2.239 2.192 2.169 2.157 2.151 216 Ga1Ge24Sb5S70 542 2.233 2.180 2.155 2.145 2.139 198
Comprehensively, the low content of gallium and antimony in sulfide glasses rule the band-gap shift to lower cut-off wavelength. To increase the content of sulfur in these glasses is generally also a good way to shift the band-gap to lower wavelength.
Antimony and gallium are also involved in the change of the refractive index for Ga-Ge-Sb-S glasses (Table 2, Fig. 2). Firstly, the glasses containing 10 mol. % of antimony have higher refractive index than other glasses with 5 mol. % of antimony. The antimony is known for clearly increase of the refractive index [37]. Secondly the refractive index increases with the content of gallium inside our glasses. For example, at 1551 nm (far from the absorbing spectral range), the glass Ga1Ge24Sb5S70, with 1 mol. % of gallium, has a refractive index
about 2.139 while the glass Ga5Ge20Sb5S70, with 5 mol. % of gallium, has a refractive index
about 2.161. At 1551 nm, the contrast of refractive index (Δn) ranging from 0.022 to 0.04 can be obtained by substituting gallium for germanium atoms of about 5-10 mol. % in good agreement with Troles et al. [35]. The contrast Δn is slightly lower and ranging from 0.003 to 0.028 by substituting sulfur for germanium atoms of about 5 mol. % depending on composition. Finally, the contrast Δn is the highest by substituting antimony for germanium or antimony for sulfur of 5 mol. % with maximum Δn of 0.09. Antimony possesses a highly polarizing effect, related to its electronic density and ionic radius, higher than the other elements contained in the glass. Regarding the glass density, it can be emphasizing the classical almost linear increase of the refractive index with the density [38]. We can easily understand the predominant role of antimony. Therefore, antimony and to a lesser extent gallium have an important influence on refractive index of studied glasses.
Another way to determine refractive index, especially in mid-infrared, is to use ellipsometry showing the normal dispersion of the refractive index from near- to mid-infrared spectral range (Fig. 2). Optical dispersion has been evaluated in the 3-5 µm range by using the modified Abbe number as follows:
4 3 5 3 5 1 , n V n n − = − − (3)
where V3-5 is the Abbe number for the 3-5 µm atmospheric windowand nx is the refractive
index at different wavelengths (in µm). The results are shown in Table 2. A higher Abbe number means a lower chromatic dispersion. Globally, the Abbe number decreases when the content of germanium decreases and the content of gallium increases.
1000 10000 2.0 2.1 2.2 2.3 2.4 2.5 2.6 Refr ac tive index Wavelength [nm] Ga10Ge15Sb10S65 Ga5Ge15Sb10S70 Ga5Ge20Sb10S65 Ga5Ge25Sb5S65 Ga5Ge20Sb5S70 Ga1Ge29Sb5S65 Ga1Ge24Sb5S70
Fig. 2. Refractive index obtained by prism coupling (dots) and ellipsometry (line) for several compositions of Ga-Ge-Sb-S system.
From these optical measurements results, one composition was selected due to the interesting shift of the cut-off wavelength to lower wavelength (560 nm versus 581 nm for Ga5Ge20Sb10S65 glass) and also the thermo-mechanical properties suitable for a fiber drawing.
This composition, Ga5Ge20Sb5S70 has been used for spectroscopic comparison to
Ga5Ge20Sb10S65 glass.
3.3 Structural characterization of glasses from Ga-Ge-Sb-S quaternary system
The Ge-S glass system is known to be mainly formed by [GeS4/2] tetrahedra linked by their
corners and also partly by edges in the case of stoichiometric glass GeS2. For sulfur deficient
glasses, the germanium atoms can be linked by Ge-Ge homopolar bonds forming GeS4-xGex
(x = 1, 2, 3 or 4) or S3Ge-GeS3 ethane-like structural units. For sulfur rich glasses, tetrahedra
are linked each other by sulfur dimers or short chains and even rings, generating (S-S) bonds [39]. Ga-Ge-Sb-S system comes from the two ternary Ge-Sb-S and Ge-Ga-S systems well
described in literature. The Ge-Sb-S system is formed by [GeS4/2] tetrahedra linked by their
corners and edges equivalent to what can be observed in the Ge-S binary system and presenting also (S-S) bonds for compositions with an excess of sulfur, according to Raman
spectroscopy [40], and (Ge(Sb)-(Sb)Ge) bonds for sulfur deficient glasses. Only Sb3+ species
seem to exist in this Ge-Sb-S matrix and can form [SbS3/2] pyramidal units [40, 41].
Considering Ge-Ga-S system, the glass network is constituted of [GeS4/2] and [GaS4/2]
tetrahedra linked by corners and edges, according to X-ray absorption spectroscopy [42, 43].
Revealed by Raman scattering spectroscopy, (S3Ge(Ga)-(Ga)GeS3) units are proposed to exist
[44, 45]. The aim of this study is to better describe the glass network based on Ga-Ge-Sb-S
system by means of 71Ga NMR, Raman spectroscopy and EXAFS.
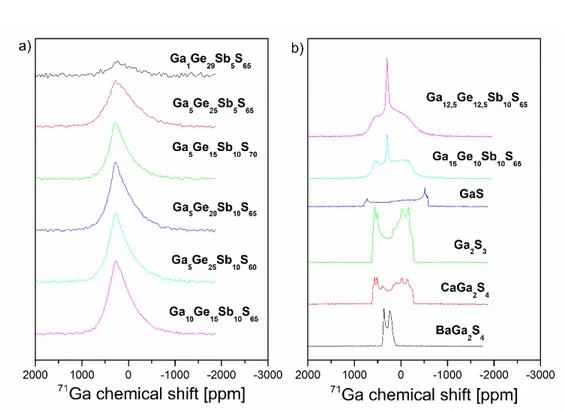
Concerning 71Ga NMR, spectra given in Fig. 3(a) have been recorded for several
compositions. Some NMR spectra of crystallized samples, like BaGa2S4 and CaGa2S4 both
well-known for rare earth doping [46, 47], GaS or Ga2S3 and glass-ceramics such as
Ga12.5Ge12.5Sb10S65 and Ga15Ge10Sb10S65 are proposed to compare the signal of known
Fig. 3. 71Ga NMR spectra for glasses of the Ga-Ge-Sb-S system (a) and for some
glass-ceramics and crystals (b).
First, when considering the whole spectrum, the line shape looks strongly structured by the quadrupolar interaction for both the glasses and the crystals. The shape observed for
BaGa2S4 is characteristic of single environment for gallium, in agreement to its structure
indicating only one crystallographic site. This crystal is composed of tridimensional [GaS4]
tetrahedra connected by their corners [21, 48, 49]. The small line width is in agreement with the high symmetry of the crystal. For CaGa2S4, Ga2S3 and GaS, their line shapes are much
larger and result from an overlap of several contributions (two at least). Effectively, CaGa2S4
presents two crystallographic sites for the gallium, with tetrahedron arrangement in layers corresponding to a 2D structure. These tetrahedra are linked by their corners and also by their edges forming dimers. In that case, sulfur is coordinated by two or three atoms of gallium. Its spectrum shows more than two contributions and could be attributed to parasites due to
pollution by oxides. The line shape of Ga2S3 spectra is very close to the previous one
observed, CaGa2S4. The most common variety of Ga2S3 presents also two Ga crystallographic
sites and it is generally described as a 3D network of tetrahedra linked only by their corners but where sulfur can be three-fold coordinated. The local symmetry around gallium is also
very similar to CaGa2S4. Layer structuration is probably the reason why the two spectra are
very similar, even if it happens to find three Ga crystallographic sites, especially in α-Ga2S3
phase. Concerning GaS, a particular shape can be observed showing good crystallization and quadrupolar interaction in axial symmetry. It is common to observe this axial symmetry as the environment of gallium is strongly conditioned by the unidirectional Ga-Ga bond. Moreover, the line shape is significantly larger than previous ones, and particularly than the line shape observed for glasses consequent to a distribution of quadrupolar parameters. From these observations, we can conclude that quadrupolar parameters specific to an environment associated to homopolar bonds were not found even if they are expected in low proportions.
The two last spectra of Fig. 3(b) concern glass-ceramics, with an amorphous phase and crystallized phases. The amorphous and crystalline components are well defined in each NMR spectrum, with a large structured contribution and a fine contribution in the center. The
large contribution of the spectrum was attributed to Ga crystallized phase, which could seem paradoxical. The line shape looks like the other line shapes observed for previous crystals, BaGa2S4 and Ga2S3. It is necessary to remind that for quadrupolar nuclei like 71Ga, the line
shape width corresponds to the site symmetry and not to the structural disorder. The fine contribution that emerges in the center corresponds in fact to gallium in crystallographic sites of high symmetry, typically cubic sites. It is very common to find this situation in amorphous materials in which quadrupolar parameters are distributed by local disorder corresponding to high symmetry situations. The largest part of the line shape, corresponding to low symmetry sites, is hidden through the crystalline phase contribution.
Line shapes coming from continuous distribution of quadrupolar parameters are observed in Fig. 3a. This line shape is very common and systematically observed for highly quadrupolar nuclei as 71Ga, 27Al, 23Na, for example, in glasses. For this type of materials, the
expected distribution of quadrupolar parameters has been determined by Czjzek [20]. Line shapes observed here perfectly matches these distributions. Very little changes were observed between spectra of investigated glasses. Widths and positions are the same as those observed in crystals and glass-ceramics. This confirms that in these amorphous materials, gallium is
coordinated with four sulfur atoms forming GaS4 tetrahedra. Moreover, for compositions
containing less sulfur, no signature of Ga-Ga homopolar bond is clearly observed. This information is important for discussion concerning Raman spectra analysis. Finally, it can be noted that spectrum of 5% antimony glass is slightly wider than the others, showing the higher disorder of gallium environment. It is in agreement with the important role of antimony for the glass forming.
Several compositions studied in this paper have been investigated with Raman spectroscopy (Fig. 4(a), Tab. 3). The Raman spectra of Ga-Ge-Sb-S glasses are dominated by
the presence of the band peaking at 340 cm−1 related to the ν1(A1) symmetric stretching
modes of tetrahedral [GeS4/2] [50] as it can be seen for illustration in Fig. 4(b). A shoulder is
observed at 370 cm−1, corresponding to a companion mode of the ν1 mode linked to vibrations
of tetrahedra bound by their edges [51]. A widening of the dominant peak is visible for composition with high amount of gallium (10%) attributed to symmetric stretching mode of
[GaS4/2] tetrahedra, around 320 cm−1. A shoulder located at 296 cm−1 is attributed to the
symmetric stretching vibration modes of [SbS3/2] pyramids [52]. In the Raman spectra
corresponding to glasses with an excess of sulfur (typically compositions with 70% of sulfur),
we observe two bands located at 474 and 218 cm−1 (Fig. 4(c)). These bands are attributed to
the stretching and bending vibrations mode of S-S homopolar bonds, respectively which can form dimers, small chains or S8 rings [51]. A small peak at 152 cm−1 could be assigned to the
Sb-Sb bonds vibrations [53, 54] but are more probably due to the presence of S8 rings, the
main vibration bands of which are centered at 151, 218 and 476 cm–1 [55]. Moreover, in the
Fig. 4(d), a weak band is observed at 258 cm−1. This band can be associated to vibrations
modes of Ge-Ge homopolar bonds (usually at 250-258 cm−1), existing in S3Ge-GeS3 units
[41]. It can be also Ga-Ge(Ga) bonds (expected around 268 cm−1 for Ga-Ga(Ge)) but it is
quite difficult to distinguish them due to their very close atomic weight. Fortunately, 71Ga
NMR gives information about gallium bonds and shows that there are no homopolar Ga-Ga
bonds. A weak band observed at 205 cm−1 could be attributed to the presence of clusters
SGe3-S6/3 presents in GeS2 [56] or likely to the presence of Ge-Sb bonds [57]. A band at 430
cm−1 is assigned to the vibrations of S3Ge-S-GeS3 units where the tetrahedra are connected by
100 150 200 250 300 350 400 450 500 550 600 100 150 200 250 300 350 400 450 500 550 600 100 150 200 250 300 350 400 450 500 550 600 50 100 150 200 250 300 350 400 450 500 550 600 b) d) c) Ga5Ge20Sb10S65 Ga 1Ge29Sb5S65 Ga5Ge25Sb5S65 Ga10Ge15Sb10S65 Ga5Ge15Sb10S70 Ga1Ge24Sb5S70 Wavenumber [cm-1 ] Ga5Ge20Sb5S70 a) Wavenumber [cm-1] Ga5Ge20Sb10S65 Wavenumber [cm-1] Ga1Ge29Sb5S65 Wavenumber [cm-1] Ga5Ge15Sb10S70
Fig. 4. Raman spectra of several glass compositions of Ga-Ge-Sb-S system (a), deconvoluted Raman spectrum of Ga5Ge20Sb10S65 (b), Ga5Ge15Sb10S70 (c) and Ga1Ge29Sb5S65 (d).
Table 3. Characteristic vibration mode observed in Ga-Ge-Sb-S system by Raman spectroscopy
Wavenumber Signal Attribution References
145-150 cm−1 large band distortion mode of [GeS
4/2] tetrahedra [58]
152 cm−1 band vibration mode of homopolar Sb-Sb bond [53,54]
190 cm−1 band bending vibration mode of S-S bonds in S
8 rings [51]
205 cm−1 weak band vibration mode of presence of Ge-Sb bonds or Ge-S
bond in SGe3-S6/3 cluster
[57] [56]
218 cm−1 band bending vibration mode of S-S bonds in S
8 rings [59]
258 cm−1 weak band stretching mode of Ge-Ge homopolar bonds [41]
296 cm−1 shoulder symmetric stretching mode of [SbS
3/2] pyramid units [52]
320 cm−1 shoulder symmetric stretching mode of [GaS
4/2] tetrahedra [52]
340 cm−1 band symmetric stretching mode ν
1 (A1) of [GeS4/2]
tetrahedra
[50]
370-375 cm−1 shoulder companion mode (A
c), vibration mode of Ge-S bond for
[GeS4/2] tetrahedra linked by edge
[51]
405 cm−1 band asymmetric bending mode of [GeS
4/2] tetrahedra [50]
425-430 cm−1 band vibration mode of S
3Ge-S-GeS3 units with [GeS4/2]
tetrahedra linked by their corner
[60]
474 cm−1 weak band vibration mode of S-S homopolar bonds [51]
The Fig. 5 presents EXAFS spectra and radial distribution function not corrected by the phase shift. The results (Table 4) show that the gallium is surrounded by 4.10 sulfur atoms with a Ga-S bond distance of 2.28 Å. Higuchi et al. obtained similar results for Ga2S3-GeS2
-La2S3 system with a Ga-S bond distance of 2.31 Å and Ga coordination number of 4.2 [58].
Information confirm conclusion of Raman spectroscopy and NMR: these glasses are
constituted by GaS4 tetrahedra. The value obtained by EXAFS is in good agreement with the
bond valence sum (BVS) [59]. This theory predicts for a [GaS4/2] tetrahedron, a Ga-S bond
distance of 2.27 Å and a coordination number equal to 4.12.
Fig. 5. EXAFS spectrum showing oscillations (left) and radial distribution function
non-corrected of phase shift (right) for Nd3+ ions in Ga
5Ge20Sb10S65 glass.
The germanium is surrounded by 4.14 sulfur atoms with a Ge-S bond distance of 2.23 Å.
These results confirm the four-coordination of germanium and the presence of [GeS4/2]
tetrahedra. The values are close to values from the literature (Ge-S = 2.21 Å with a coordination number of 4.2 for Ga2S3-GeS2-La2S3 system [58]) and in good agreement with a
Ge-S bond distance of 2.23 Å and a coordination number (Nc = 4.14) predicted with the BVS
for a [GeS4/2] tetrahedron.
The antimony is surrounded by 3.0 sulfur atoms with a Sb-S bond distance of 2.47 Å. The
good agreement with the BVS (2.47 Å and Nc = 2.97 for SbS3) is in line with the presence of
[SbS3/2] pyramids units. Nevertheless, the value of bond distance is different from several
studies giving a Sb-S bond distance of 2.34 Å.
The neodymium is surrounded by 10.83 sulfur atoms and the Nd-S bond distance is about 2.95 Å. The literature is very poor concerning data on local structure of Nd in sulfide glasses. However, coordination of neodymium seems to be overrated if we refer to estimations of
BVS (Nc = 8.63 and Nd-S = 3.03 Å). One reason of this overrating could be due to the quality
of the recorded data. The dilution of neodymium in the matrix and the difficulty to work at high energy are two problems leading to such low quality. In general, coordination number is the most affected parameter when the data are not presenting a high-quality.
Table 4. Coordination numbers (N), bond distances (R) and Debye-Waller factors (σ2) of
Ga-S, Ge-S, Sb-S, and Nd-S bonds in Ga5Ge20Sb10S65 glass, with R-factor showing the
validity of fitting
Bond N Ncalc R (Å) Rcalc (Å) σ2 (Å2) R-factor
Ga-S 4.10 4 2.28 (0.01) 2.27 0.0077 (0.002) 0.014
Ge-S 4.14 4 2.23 (0.01) 2.22 0.0034 (0.001) 0.004
Sb-S 2.97 3 2.47 (0.01) 2.47 0.0051 (0.001) 0.008
Nd-S 10.83 8.63 2.95 (0.01) 3.03 0.0121 (0.002) 0.008
The different methods used for structural characterization give us information about the glass network organization of some Ga-Ge-Sb-S host matrices. These glass matrices are
composed of [GaS4/2] and [GeS4/2] tetrahedra with probably weak proportion of Ge,
Ge-Sb bonds but not Ga-Ga bonds. These Ge-Ge(Ge-Sb) bonds can form S3Ge-Ge(Sb)S3 units.
[SbS3/2] pyramids units are also present with maybe few Sb-Sb bonds for rich antimony
glasses. It cannot be absolutely excluded that antimony is present in higher coordination like
SbS4 or SbS5 entities. Some clues suggest that further study is needed to investigate this
hypothesis. S-S bonds forming chains and S8 rings have been observed for Ga-Ge-Sb-S
glasses with an excess of sulfur. Concerning the rare earth, neodymium was found to be surrounded by 10.8 sulfur atoms. This coordination is probably overrated compared to other rare earth already studied in sulfide matrix as the Nd3+ ionic radius, that is about 2.95 Å, is
relatively close to these other rare earths [52, 61].
3.4 Spectroscopy of Nd3+ in Ga5Ge20Sb10S65 and Ga5Ge20Sb5S70 glass
The study was carried out on bulk glasses with the selected composition Ga5Ge20Sb10S65
(thereinafter 2S2G) doped with different neodymium concentrations (500, 2400, 3900, 5000 and 7500 ppmw.). Several dopant concentrations were tested to investigate the energy transfer rates between neighboring ions, which could lead to the quenching of the luminescence. In the absorption spectra, the intensities of Nd3+ absorption bands increase linearly with the Nd3+
concentration (Fig. 6).
Considering a pumping at 814 nm (Fig. 7), the near-IR transitions arise mainly from the
4F
3/2 emitting manifold, while the mid-IR transitions (wavelength longer than 2 µm), arise
only from the lower 4I
J manifolds. 600 700 800 900 1000 1100 0 5 10 15 20 25 4G5/2, 2 G7/2 4 F3/2 4 F5/2 4 F7/2,4 S3/2 Abs or p tio n Coeff ic ie nt [c m -1 ] Wavelength [nm] 2400ppm 3900ppm 5000ppm 7500ppm 4 F9/2 2000 3000 4000 5000 6000 7000 8000 2 4 6 8 A bsor p tion coe ffi ci en t [ cm -1] Concentration [ppm]
Fig. 6. Evolution of absorption coefficient for several Nd3+ concentrations in 2S2G glass, with
the inset showing the absorption coefficient for the 4F
5/2 level.
Judd-Ofelt (JO) calculations and spectroscopic characterization have been done within Ga5Ge20Sb10S65 (2S2G) and the other composition selected, Ga5Ge20Sb5S70 (GaGeSbS-S70).
Eight absorption bands of Nd3+ ions, shown in Fig. 8 for Ga
5Ge20Sb10S65 (2S2G) and
GaGeSbS-S70, corresponding to 4I
9/2→4G5/2 + 2G7/2, 4I9/2→4F9/2, 4I9/2→4F7/2 + 4S3/2, 4I9/2→ 4F
5/2 + 2H9/2, 4I9/2 → 4F3/2, 4I9/2 → 4I15/2, 4I9/2 → 4I13/2 and 4I9/2 → 4I11/2 transitions can be
observed at 595, 691, 757, 813, 893, 1572 to 1798, 2316 to 2794 and 4397 to 6321 nm respectively. Energy diagram was also determined from experimental data as presented in Fig. 7.
600 800 1000 1200 1400 1600 1800 2000 2200 2400 5000 0 1000 2000 3000 4000 5000 6000 7000 8000 9000 10000 11000 12000 13000 14000 15000 16000 17000 4 G5/2+2 G7/2 5149nm 2524nm 4951nm 2485nm 4988nm 1676nm 1892nm 1373nm 1203nm 1074nm 967nm 889nm 4 F7/2+4 S3/2 4 F9/2 4 F5/2+2 H9/2 4 F3/2 4 I15/2 4 I13/2 4 I11/2 E n er g y [c m -1 ] 4 I9/2 814nm Wavelength [nm]
Fig. 7. Energy diagram of Nd3+ ion in 2S2G glass matrix.
Intensities of absorption bands of Nd3+ ions increase with the concentration of Nd3+. In the
Fig. 6, the evolution of the absorption coefficient at a given wavelength depending on the concentration is shown. This change of absorption coefficient is linear with the concentration of rare earth and provides to check easily the real concentration for other samples. It can be noted that absorption cross section is not changing with increasing the rare earth concentration. In oxides matrices, absorption cross-section for the transition 4I
9/2 → 4F5/2 + 2H
9/2 is 2.5x10⁻²⁰ cm2 [62]. In Ga-La-S sulfide matrices, absorption cross-section for the same
transition is 3.79x10⁻²⁰ cm2 [63]. In comparison, the absorption cross-section, which is about
7.2x10⁻²⁰ cm2 in Ga
5Ge20Sb10S65 (2S2G) and 7.7x10⁻²⁰ cm2 in Ga5Ge20Sb5S70
(GaGeSbS-S70), is higher in our host glass matrices, moreover exhibiting a lower phonon energy than
oxides or Ga-La-S matrices. Nevertheless, it must be noticed that for 20GaS3/2-50GeS2
-30SbS3/2-3NdS3/2 glass, a lower value of about 2.2x10⁻²⁰ cm2 [7] was recorded. Using the
integrated absorption cross-sections, a Judd-Ofelt analysis had been performed to estimate the radiative lifetimes and the branching ratios for the infrared transitions. Using the matrix elements from Carnall et al. [64], a standard calculation has been used for determining the phenomenological Judd-Ofelt parameters: Ω2 = 9.2 x10⁻²⁰; Ω4 = 9.1 x10⁻²⁰; Ω6 = 4.7 x10⁻²⁰
for 2S2G and Ω2 = 6.9 x10⁻²⁰; Ω4 = 11.7 x10⁻²⁰; Ω6 = 4.4 x10⁻²⁰ for GaGeSbS-S70. The value
of Ω2 parameter is relatively similar to those for other sulfide glasses and other rare earth [7,
65]. It is known that Ω2 is affected by the local symmetry of ligand field or covalency of
chemical bond between rare earth and ligand atoms; Ω2 sulfide > Ω2 oxide > Ω2 fluoride [66]. The
sulfur richest composition of the glass matrix seems to affect the symmetry of the Nd3+ or
likely could decrease its chemical bond covalency. The compositional variation of Ω6 is
expected to present an opposite tendency to a lesser extent. The results presented in Table 5 and 6 for 2S2G and GaGeSbS-S70, respectively, only concern the cascade transitions
occurring after a 815 nm optical pumping (4I
9/2 → 3F5/2), which correspond to the highest
600 700 800 900 1500 2000 2500 0.00E+000 4.00E-020 8.00E-020 1.20E-019 1.60E-019 4G5/2, 2G7/2 4 F3/2 4 F5/2 4F7/2, 4S3/2 GaGeSbS-S70:Nd3+ 4F9/2 4500 4750 5000 5250 5500 5750 6000 0.00E+000 2.00E-021 4.00E-021 6.00E-021 8.00E-021 1.00E-020 1.20E-020 4 I11/2 4 I13/2 4 I15/2 A b so rp tion cr o ss se ct io n [cm 2] Wavelength [nm] 600 700 800 900 1000 0.00E+000 4.00E-020 8.00E-020 1.20E-019 1.60E-019 2.00E-019 2.40E-019 2.80E-019 4 G5/2, 2G7/2 4 F3/2 4 F5/2 4F7/2, 4S3/2 2S2G:Nd3+ 4F9/2 1000 2000 3000 4000 5000 6000 7000 0.00E+000 2.00E-021 4.00E-021 6.00E-021 8.00E-021 1.00E-020 4 I11/2 4 I13/2 4 I15/2 A bs orp tio n C ro ss S e ct io n [c m 2] Wavelength (nm)
Fig. 8. Absorption cross-section of Nd-doped 2S2G glass (a) and Nd-doped GaGeSbS-S70 glass (b).
Table 5. Radiative parameters of Nd3+ ions in 2S2G glass calculated using Judd-Ofelt
analysis. transition λ (nm) ΔE (cm-1) β (%) τ (µs) 4I 11/2 4I9/2 5208 1920 100 26424 4I 13/2 4I11/2 4943 2023 33 7654 4I 9/2 2536 3943 67 4I 15/2 4I13/2 4908 2038 28 6978 4I 11/2 2463 4061 54 4I 9/2 1672 5981 18 4F 3/2 4I15/2 1917 5217 0 70 4I 13/2 1378 7255 6 4I 11/2 1078 9278 39 4I 9/2 893 11198 55 4F 5/2, 2H9/2 4F3/2 9740 1027 0 59 4I 15/2 1602 6244 5 4I 13/2 1207 8282 17 4I 11/2 970 10305 14 4I 9/2 818 12225 63
For 2S2G and GaGeSbS-S70 sulfide glass, the average phonon energy can be estimated
from Raman spectroscopy about 340 cm−1. Considering that for transitions energies exceeding
five times the phonon energy, the radiative decay is quenched, so that the 4F
5/2 pumping is
leading to an efficient population of the 4F
3/2 manifold, from the small 1027 cm−1 energy gap.
The non-radiative transfer is not excluding some radiative transitions in the near-IR spectral range (Fig. 9 inset). Considering the 4F
3/2 emitting manifold, only radiative transitions can
occur, as the energy gap is higher than 5000 cm−1. The measured luminescence properties are
reported in Fig. 9. From this spectrum, the emission intensities could be integrated for the experimental branching ratios determination, following Eq. (4):
, ji ji ji jk jk k I I λ β λ × = ×
(4)In recorded spectra, the 4F
3/2 → 4I9/2 emission is strongly affected the radiation
reabsorption, explaining the difference between the calculated and measured 4F
3/2 → 4I9/2
branching ratio. These experiments have been performed on bulk glasses, so that that this zero-line phonon radiation could be reabsorbed on the optical path, resulting in an experimental 4I
11/2 branching ratio lower than the Judd-Ofelt calculations, and thus making the
remaining experimental branching ratios (4I
11/2, 4I13/2 and 4I15/2) higher than the calculated
ones, but confirming the rate between the 4I
13/2 and 4I11/2.
Table 6. Radiative parameters of Nd3+ ions in GaGeSbS-S70 glass calculated using
Judd-Ofelt analysis. transition λ (nm) ΔE (cm-1) β (%) τ (µs) 4I 11/2 4I9/2 5190 1927 100 31039 4I 13/2 4I11/2 5052 1979 33 9669 4I 9/2 2560 3906 67 4I 15/2 4I13/2 4845 2064 30 8520 4I 11/2 2473 4044 52 4I 9/2 1675 5970 18 4F 3/2 4I15/2 1885 5305 0 69 4I 13/2 1357 7273 5 4I 11/2 1070 9346 35 4I 9/2 887 11274 60 4F 5/2, 2H9/2 4F3/2 9890 1011 0 61 4I 15/2 1583 6317 6 4I 13/2 1193 8382 17 4I 11/2 965 10363 15 4I 9/2 814 12285 62
The emission spectra were obtained by pumping the samples at 815 nm (4F
5/2 and 2H9/2
levels) to populate 4F
3/2 level. This wavelength provides an efficient absorption (Fig. 8). Fig. 9
shows the emission spectra of Nd3+-doped samples with several concentrations. Here, the
bands are corresponding to transitions from 4F
3/2 to the lower 4I9/2, 4I11/2 and 4I13/2 levels. The 4F
3/2 → 4I9/2 emission, at 915 nm, is very interesting to be transmitted by a classical silica
fiber. The neodymium presents an absorption band around 5 µm. The emission of the praseodymium could be absorbed by the neodymium, reemitted at 915 nm and then transmitted by a classical silica fiber. It could open new way to detect molecules absorbing in mid-IR with a full optic sensor [67].
Although the 4F
3/2 emissions are clearly attributed (1.4 and 2.0 µm), the 2.5 µm emission
band should be discussed. The energy levels display of the four 4I
J levels can lead to
potentially three distinctive 5 µm emissions lines, and two at the wavelength of 2.5 µm (Fig. 7). As the 4I
15/2 → 4I9/2 line could be observed at 1550 nm and considering the Judd Ofelt
calculations, the 4I
15/2→4I11/2 line will also be observed at 2.5 µm. This band results mainly
from the 4I
13/2→4I9/2 fluorescence, but the 4I15/2→4I11/2 contribution could be estimated to be
roughly six times lower, from (JO – branching ratio) Table 5 and 6. For the 5 µm emission,
three radiative schemes are possible, but the 4I
11/2 → 4I9/2 line brings the strongest
contribution, by more than one order of magnitude, based on the branching ratios calculations. Assuming that the observed fluorescence is due to the 4I
11/2→4I9/2 emission, this
emission band could be cross-section calibrated using the Füchtbauer-Ladenburg formula (Eq. (5)):
5 2 ( ) ( ) 8 ( ) e if i c n i d λ β λ σ λ τ π λ λ λ = ⋅ ⋅ ⋅
⋅ ⋅ (5).The integration is performed on the full transition bandwidth, denoted ij.
900 1000 1100 1200 1300 1400 1500 0.0000 0.0005 0.0010 0.0015 0.0020 0.0025 0.0030 0.0035 0.0040 0.0045 0.0050 4 I13/2 4I 11/2 4I 9/2 4F 3/2 4F 3/2 4 F3/2 F luo re sc enc e i nte ns ity [a .u. ] Wavelength [nm] 500ppm 2400ppm 3900ppm 5000ppm 7500ppm 1000 1200 1400 4I 13/2 4 F5/2,2H9/2 4F 5/2, 2H 9/2 4I 11/2
Fig. 9. Emission spectra of Nd3+ doped 2S2G glass with different concentrations of rare earth.
The 4F
3/2 emission cross-section calculations are reported in Table 7. Usually, the
calibration is calculated using the predicted β and τ from the Judd-Ofelt calculations. Here, most of the expected transitions fluorescence signals and radiative lifetimes were recorded, so that the cross-section could be calculated for 2S2G glass. Emission cross section are quite
higher compare to Ga-Ge-S-CsCl system which is about 0.5x10⁻²⁰ cm2 for the 4F
3/2→4I13/2
transition [68], and a bit lower compare to Zn-Bi borate system (4x10⁻²⁰ cm2) for the 4F 3/2→ 4I
11/2 transition [69].
Table 7. Experimental and calculated 4F
3/2 branching ratios and emission cross-sections
for 2S2G and 2S2G-S70
final level λ (nm)
2S2G 2S2G-S70
β (exp) β (JO) Emission cross-section [cm2] β (exp) β (JO) Emission cross- section [cm2]
4I 9/2 916 0.21 0.55 1.2 x10⁻²⁰ - - -4I 11/2 1095 0.67 0.39 1.3 x10⁻¹⁹ - - -4I 13/2 1387 0.1 0.06 2.6 x10⁻²⁰ 0.08 0.05 1.82 x10⁻²⁰ 4I 15/2 1982 0.02 0 7.2 x10⁻²¹ - -
-With pulsed excitation of the 4I
11/2, 4I13/2 and 4F3/2, respective fluorescence decay curves at
0.0 0.2 0.4 0.6 0.8 40 60 80 100 120 140 160 180 200 220 240 260 Li fet ime [ µ s] Nd concentration [wt%] 2S2G 5µm 2S2G 2,6µm 2S2G 1,3µm GaGeSbS-S70 1,3µm GaGeSbS-S70 2,6µm GaGeSbS-S70 5µm 4F 3/2 4I 13/2 4I 11/2 4I9/2 4I 13/2 4 I9/2
Fig. 10. Fluorescence lifetimes measured for Nd3+ ions in 2S2G and GaGeSbS-S70 glasses.
For these levels, lifetimes were determined by an exponential fit of the fluorescence decay curves. The fluorescence lifetime of the 4F
3/2 level, for the lowest Nd3+ concentration, is found
very close to the Judd-Ofelt prediction 70 µs (Table 5,6). For the 4I
J transitions, the time
constant is dramatically decreasing with the concentration. Concerning these transitions, it can be noted that for GaGeSbS-S70 matrix, lifetimes are lower than for 2S2G matrix. Moreover, the measured fluorescence lifetimes do not match the Judd-Ofelt predictions, as it shows millisecond ranged radiative lifetimes. This behavior suggests the presence of hopping
migration assisted energy transfer between Nd3+ ions, increasing the cross relaxation rate
[69,70], which leads to more radiation trapping by the glass impurities.
3.5 Fluorescence of Nd3+ions doped Ga5Ge20Sb10S65 and Ga5Ge20Sb5S70 fibers
Attenuation has been recorded for an Nd3+-doped 1000 ppmw. Ga
5Ge20Sb10S65 fiber. In the
Fig. 11, absorption bands corresponding to energy levels 4I
15/2, 4I13/2 and 4I11/2 can be
observed. The vibration of S-H bonds ([S-H] = 25 ppm, content determined from the bulk
preform) gives absorption bands at 3.1 and 4.0 µm. Band at 4.2 µm is attributed to CO2
vibrations [71]. It can be noted that C-S vibrations band appears generally at 4.95 µm. This band is probably covered by the large band corresponding to the 4I
11/2 level. 1.5 2.0 2.5 3.0 3.5 4.0 4.5 5.0 5.5 6.0 6.5 5 10 15 20 25 A ttenuat ion [dB/m] Wavelength [µm] 2S2G:Nd3+ 1000 ppm Nd3+ O-H S-H CO2 Nd3+
Fig. 11. Attenuation of Nd3+-doped 2S2G fiber (Ø
fiber = 350 µm).
Fluorescence emissions were recorded on 4 cm length fibers for several transitions (Fig.
12). We observed six main emission bands corresponding to 4F