1
UNIVERSITY OF CALABRIA
Department of Mechanical, Energy and Management Engineering
Ph.D. in
Operational ResearchCYCLE XXVII
INTELLECTUAL CAPITAL AND FIRMS’ PERFORMANCES: THEOR ETICAL AND EMPIRICAL APPLICATIONS
Scientific Disciplinary Sector: ING-IND/35
Coordinator: Prof. Lucio Grandinetti
Signature _____________________________
Supervisor/Tutor: Prof. Gianpaolo Iazzolino
Signature______________________________
Candidate : Giuseppe Migliano, MEng.
To my Brother Gabriele,
a bright light in my life
CONTENTS
INT RODUCT ION: KNOWLEDGE RE SOU RCE S A S “ST RAT EGIC A SSET S”...5
CHAPTER 1: THEORET ICAL BACK GROUND ON INT ELLECT UAL CAPIT AL AND FIRMS’ PERFORMANCE S ... 10
1.1 Intellectual Capital ... 10
1.2 Intellectual Capital: the VAIC approach ... 22
1.3 Firms’ performances... 25
1.4 Intellectual Capital and firms’ performances evaluation ... 45
CHAPTER 2:MET HODOLOGIE S T O DESIGN RE SEA RCHE S ... 51
2.1 Introduction to research methodologies ... 51
2.2 Measures of relationships ... 55
2.3 Measures of classification ... 61
CHAPTER 3:EVALUAT ING INT ELLECT UAL CAPIT AL FOR SUPPORT ING CREDIT RISK ASSE SSMENT 76 Abstract ... 76
3.1 Introduction ... 76
3.2 Research Methodology ... 77
3.3 Dataset ... 80
3.4 Empirical research: the application of the models ... 82
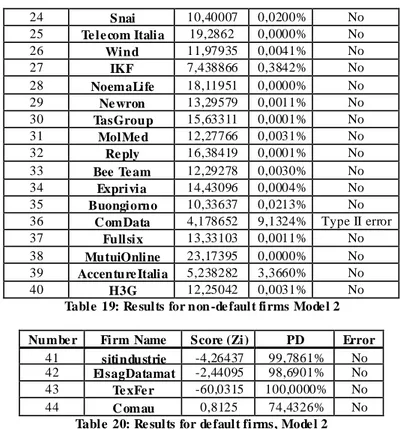
3.5 Results and Discussions ... 84
3.6 Conclusions and further works ... 88
CHAPTER 4:CAPIT AL EFFICIENCY AND MARKET VALUE IN KNOWLED GE A ND CAPIT AL INT ENSIVE FIRMS ... 90
Abstract ... 90
4.1 Introduction ... 90
4.2 Methodology of research ... 91
4.3 Analysis ... 96
4.4 The impact of Intellectual and Physical Capital on Market Value... 98
4.5 Discussions ... 104
4.6 Conclusions ... 106
CHAPTER 5:VALUE CREAT ION BY DIFFERENT PERSPECT IVES ... 107
Abstract ... 107
5.1 Introduction ... 107
5.2 VAIC and EVA: theoretical inequality ... 109
5.3 VAIC and EVA: the empirical study ... 109
5.4 Discussions ... 112
5.5 Conclusions ... 113
CHAPTER 6:EVALUAT ING A FIRM U SIN G NEW RELAT IVE MEA SURE S ... 115
Abstract ... 115
6.1 Introduction ... 115
6.2 Research design issue ... 116
6.4 Conclusions ... 128
6.5 Limitations and future research ... 129
CHAPTER 7:INT ELLECT UAL CAPIT AL AND IT S MARKET IMPACT ... 131
Abstract ... 131
7.1 Introduction ... 131
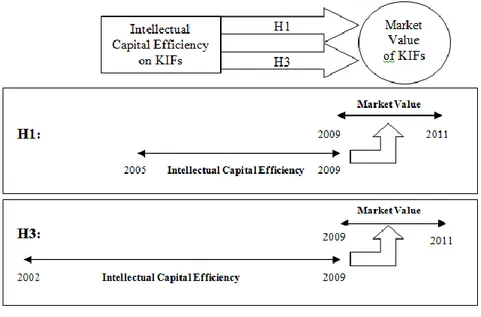
7.2 Research Framework ... 132
7.3 The empirical analysis ... 135
7.4 Discussions ... 150
7.5 Conclusions and future researches ... 154
CHAPTER 8:A NEW BU SINE SS PERFO RMAN CE SPACE WHERE POSIT IONING COMPANIES ... 156
Abstract ... 156
8.1 Introduction ... 157
8.2 Research design methodology ... 158
8.3 The new Positioning tool... 160
8.4 Findings ... 164
8.5 Discussions ... 174
8.6 Conclusions ... 179
DISCU SSION S AN D CONCLU SION S ... 181
REFERENCE S ... 185
LIST OF FIGURE S... 199
LIST OF TABLES ... 199
ANNEXE S... 201
I
NTRODUCTION:
KNOWLEDGE RESOURCES AS“
STRATEGIC ASSETS”
The economy has been changing quickly over the last few years, moving from an industrial economic base, where the economic growth was thought to be chiefly determined by the usage of tangible resources such land, capital and labour, to a knowledge economic base, in which the economic growth is considered to be mostly determined by the employment of knowledge resources that are able to generate value that cannot be recognised as tangible (i.e. economic value of patents, intellectual work, brands, marks, etc.) (Guthrie et al., 2007; Iazzolino and Migliano, 2014).
Regarding intellectual resources, Drucker (1998) stated: “knowledge is the only meaningful
resource today. The traditional ‘factors of production’ – land (i.e. natural resources), labour and capital – have not disappeared, but they have become secondary. They can be obtained, and obtained easily, provided there is knowledge. And knowledge in this new sense means knowledge as a utility, knowledge as the means to obtain social and economic results”.
Thus, nowadays, knowledge resources can be considered as the engine of each organisation; in fact, there are no doubts that successful organisations tend to be generally those that ceaselessly innovate using new technologies, skills and knowledge, rather than tangible assets such machinery or plants (Guthrie et al. 2007; Iazzolino et al., 2013a).
Alongside the theoretical considerations about the benefits generated by the usage of knowledge resources, even companies (not limited just to private or listed organisations but also public and no-profits ones) operating in several markets started recognising the importance of including these kind of resources in their strategy formulation processes, giving them a central role for generating what is generally known as “competitive advantage”: the ability to use resources in a way that allows a specific firm to outperform its competitors.
Therefore, a central question arising from the field of strategic management is: Why do some organisations perform better than others? (Barney, 2001; Treece et al., 1997). The aforementioned question is founded on strategic elements characterising knowledge resources and their management. In literature, two strategic standpoints have been traced:
(i) market-based view and
These two routes are theoretica lly differentiated on the basis of the identification of those constituents (or factors), which are able to explain the organisation’s performance and that should to be taken into account in strategy formulation.
On the one hand, in the market-based view, scholars and practitioners look at external environmental factors to explain an organisation’s performance and determine its strategic choices. Several theories and models, such those that carried out by Porter (1980) (Industry and competitor analysis), presented a sort of checklist featured by factors often categorised as: economic, social, political and technological as argued by Mintzberg (1994).
On the other hand, the resource-based view is founded on the idea that organisation’s performance is chiefly explained by the resources portfolio owned by the specific company and its deployment (Dierickx and Cool, 1989); therefore, w ith this approach, knowledge is recognised as the main strategic asset (Itami and Roehl 1987; Hall 1993; Grant 1996).
In this sense, Grant (1991) stated: “the firm’s most important resources and capabilities
are those which are durable, difficult to identify and understand, imperfectly transferable, not easily replicated, and in which the firm possesses a clear ownership and control [...]. The essence of strategy formulation, then, is to design a strategy that makes the most effective use of these resources and capabilities”.
Other two streams can be identified within the resource-based view: (i) static and (ii) dynamic. The first one identifies the stock of strategic relevant resources as the main contributor to the competitive advantage, as stated by Barney (1991) who argued that a sustainable competitive advantage derives from the stocks of resources and capabilities, owned by a specific organisation, which are valuable, rare, imperfectly (or hardly) imitable and not substitutable.
By contrast, the second one is mainly based on the idea that accumulating firm-specific assets is not enough to obtain a sustainable competitive advantage, since these stocks should be managed properly. Hence, organisations should learn dynamically to employ their resources effectively (Prahalad and Hamel 1990; Senge 1990; Nonaka and Takeuchi 1995). Thus, organisations should be able to develop and renew their resources by taking account of changes occurring within the environment in which they operate. This phenomenon is recognised in literature as “dynamic capability”, which is the ability of appropriately adapting, integrating and reconfiguring internal and external resources, organisational skills and functional competences to meet the requirements of a changing environment (Teece et al., 1997). The environment abovementioned was described by
Clarkson (1995) as: “the survival and continuing profitability of the corporation depends
upon its ability to fulfil its economic and social purpose, which is to create and distribute wealth or value sufficient to ensure that each primary stakeholder group continues as part of the corporation stakeholder system”.
In conclusion, organisational resources can be categorised within two main streams as displayed by the following Figure 1:
Figure 1: O rganisational resources
Regarding tangible assets, the financial ones include, but are not limited to: borrowing capacity, investing and financing activities, monetary-value of assets (cash reserves, receivable balance, provisions, inventory balance) and monetary-value of liabilities (loans, accounts payable, unearned revenue), and shareholder equity; whereas the physical ones include, but are not limited to: plants, properties, equipments and inventories.
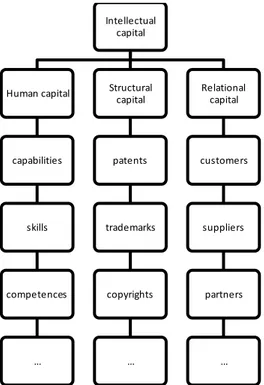
Differently from tangible assets, knowledge resources are generally divide d by the literature into three main components, specifically known as elements of “Intellectual Capital” (Figure 2):
1) Human resources (or Human Capita l) include experience, knowledge, intellect, behaviour, relationship, attitude and special skills of the personnel of a business entity employed in order to create economic value (Cohen and Kaimenakis, 2007; Schiuma et al., 2008). These are becoming critical resources for
Organisational
assets
Tangible assets
Financial
assets
Physical assets
Knowledge
resources
organisations, particularly because they contribute to the ability to respond and adapt to a changing environment.
2) Structural resources (or Structural Capital) include non-human storehouses of knowledge in organisations (Watson and Stanworth, 2006). Structural capital is defined as a general system for solving problems and innovation (Chu et al., 2006). In other words, structural capital is made up by all those elements remaining within the organisation when its employees have left the building. Hence, these kind of resources include (a) intellectual property, owned by the organisation and protected by law, such patents, trademarks and copyrights; (b) infrastructural resources, which consist of organisational peculiarities such as processes and procedures, culture, routines, information and networking systems, etc. that are necessary to pursue organisational goals.
3) Relational resources (or Structural Capital) concern the value created through the relations between organisations and with suppliers, customers, shareholders and other institutions and/or individuals (Grasenik and Low, 2004; Chu et al., 2006). Some of these resources are not owned by the organisation, but are constituted by relationships that are significant for the organisation and require management.
Figure 2: Intelle ctual C apital components (source : Ricce ri, 2008)
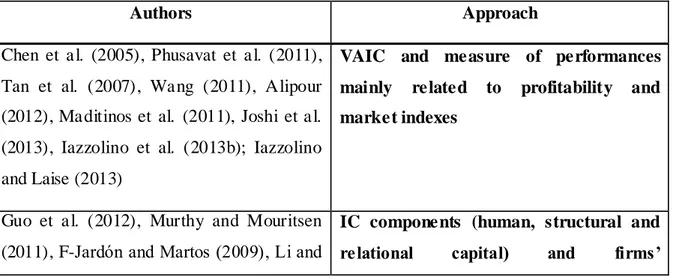
As it has been previously said, the importance of knowledge resources has been widely recognised by scholars and practitioners, thus, during the last few years, many authors have tried to carry out frameworks to measure the linkage between Intellectual Capital (intended
as human, structural and relational capital) and firms’ (organisations’) performances (measured by total profits, ROE, banking income, etc.); these topics will be deeply analysed in the following chapters.
In conclusion, this thesis will be focused on several perspectives involving the Intellectual Capital and the firms’ performances evaluation theories. Therefore, this work aims at investigating different standpoints, from which Intellectual Capital could be seen, further, these intellectual capital concepts will be integrated into a several empirical analyses to measure what is the impact of intellectual resources on firms’ performances, these latter measured by ratios such as ROE, Cash ROCE, etc.
Summarising, the incipit of this thesis is to consider intellectual capital resources as a source of competitive advantage for every company.
In this work, it will be illustrated, in Chapter 1, the main literature regarding Intellectual Capital and firms’ performances; further, some empirical approaches will be shown in the following chapters. In particular, the topics treated by this thesis are:
1. How intellectual capital could be usefully integrated in Credit Risk evaluation framework (Chapter 3);
2. How to distinguish between knowledge and capital-intensive firms by using a particular point of view of the intellectual capital (the VAIC standpoint) and, what is the impact of the intellectual capital in such kind of companies (Chapter 4); 3. What are the differences between intellectual capital (from the VAIC viewpoint)
and the traditional EBIT-based measures for evaluating firms (Chapter 5);
4. How relative valuations to get the “firm value” could be integrating by adding new perspectives derived from the intellectual capital theory (Chapter 6);
5. How intellectual capital could affect firms’ financial performances and market value (Chapter 7) and how firms could get a leadership position within a business space consisting of two integrated perspectives: (i) intellectual capital and (ii) firms’ performances (Chapter 8);
6. To carry out the researches above mentioned both quantitative and qualitative methodologies were employed. A general description of research methodologies mainly used for the topics is in Chapter 2.
C
HAPTER
1:
T
HEORETICAL
B
ACKGROUND
ON
I
NTELLECTUAL
C
APITAL AND
F
IRMS
’
PERFORMANCES
1.1 Intellectual Capital
Within the literature, there are many definitions about what Intellectual Capital (IC) is. Generally, it could be intended as the set of intangible resources owned by an organisation, valuable from a strategic standpoint to get the “real” value of the organisation itself; further, it allows companies to obtain competitive advantage, outperforming their competitors (Del Bello and Gasperini, 2006).
The concept of IC covers a wide area of cognitive resources such skills and expertise of the employees, leadership and organisational capabilities, and even business relations.
Teece (1986) was one of the firsts authors to point out the returns (in terms of business returns) related to the management of knowledge resources. The author identified two main kinds of resources: (i) intellectual resources, mainly stored in the employees’ minds such their know-how, experiences (single or collective) and capabilities/abilities; (ii)
intellectual assets, which are parts of codified knowledge on which the company is the
owner.
The first one who used the term “intellectual capital” was Stewart (1991). He defined it as the sum of all that every employee/person knows within a specific organisation that is able to produce a sustainable competitive advantage within a specific ma rketplace. Hence, intellectual capital is not a tangible asset but, conversely, is something “intangible”. In fact, as stated by Stewart (1991), to create value organisations need to employ a capital chiefly based on knowledge.
As it can be immediately noted, in the intellectual capital theory, the role of people is strongly emphasised; however, Stewart (1997) argued that it is not the only concept conceived by the literature. In fact, although knowledge is generated by the people’s skills and competences, it is translated internally into know-how, processes, routines, procedures, etc. and, externally into business relations with clients, suppliers, governments,
competitors, etc. Some examples of IC could be: skills and competences of employees, patents, marks, information about clients and suppliers, information systems and so on.
Edvinsson and Malone (1997) defined intellectual capital as the set of knowledge that can be converted into value. What they argued sheds light on how people’s skills and competences should be converted into internal and external value. Thus, according to the authors, the intellectual capital is made up of two main components:
1. Human capital: the set of knowledge, competences, abilities, capabilities, values, culture, which cannot be owned by the organisation;
2. Structural capital: the set of organisational tools that support the productivity of workers. It can be owned and even exchanged (i.e. sold) in a market by the organisation. Further, structural capital is in turn composed of other two sub-components named as:
a. Customers capital: streams of relations existing between the organisation and its customers (current or potential ones);
b. Organisational capital: obtained from:
i. Innovation capital: R&D processes aiming at obtaining future market opportunities;
ii. Process capital: employment of technologies as tools for supporting the value creation.
Figure 3: Intelle ctual C apital according to Edvinsson and Malone (1997)
Sullivan (2000) stated intellectual capital consists of (i) human capital and (ii) intellectual
assets (Figure 4). The first one is made up by four elements: know-how, collective
experience, capabilities and creativity. It should be considered as a resource since it is able to create value directly by a service or indirectly by generating a new intellectual resource that it could be even sold. In accordance with Edvinsson and Malone (1997), human capital is not owned by the organisation. For this reason, it is important to convert innovations obtained by the intellectual capital (particularly human capital) into intellectual assets. These latter are owned by the organisation and they are exchangeable on a specific market. Hence, intellectual assets could be intended, according to Sullivan (2000) as the tangible and codified knowledge towards which a certain organisation can exercise its property rights. Some examples of intellectual assets are generally recognised in patents, copyrights, marks, industrial and commercial secrets.
Conversely to what argued by Edvinsson and Malone (1997), Sullivan (2000) suggested that the structural capital should be intended as a factor which falls outside the intellectual capital; as a consequence, the structural capital was considered by the author as a direct or indirect support provided by the organisations to the intellectual capital.
Intellectual Capital
Human Capital Structural Capital
Customers capital
Organisational capital
Innovation
Figure 4: Intelle ctual C apital according to Sullivan (2000)
A noteworthy framework regarding the value of a certain organisation was provided by Swedish group Skandia. Similarly to Edvinsson and Malone (1997), the Skandia Navigator (Skandia, 1996) categorised the company’s value in two main parts (Figure 5):
1. Financial Capital, divided into e.g. plants, equipments and inventories, and finance capital, e.g. cash, investments and debtors.
2. Intellectual Capital, sub-divided into:
a. Human capital: competences, human relations and values;
b. Structural capital, made up by:
i. Customers capital, value brought by potential or current customers;
ii. Organisational capital, which consists of:
(1). Culture, organisational values and beliefs shared across the company;
(2). Processes, series of actions and steps (wherein knowledge is codified) to get a final product or service;
(3). Innovation, in turn divided into Intellectual property and Intangible assets in general.
Figure 5: O rganisational value according to the Skandia Navigator
Another contribution to the IC theory was provided by Roos et al. (1997) that, while maintaining the distinction between human and structural capital, suggests some variations to the Skandia Navigator as it was originally formulated. In this new study, the human capital is referred to competences (such knowledge and capabilities), attitudes (such motivation and behaviours) and intellectual agility (such innovation, imitation, adaptation, packaging), whereas the structural capital is related to relations (such customers, suppliers, shareholders, partners), organisation (intended as infrastructure, processes and culture) and a specific category named as renewal and development.
This contribution could be intended as an “enriched version” of the Skandia Navigator, which extends significantly the IC component linked to the individuals, attributing, at the same time, a great relevance to the relations established with clients, suppliers and other companies, highlighting how IC results from many interactions amidst human and structural elements aiming at creating value for the organisation. The following figure xx displays what it has just explained:
Organisational Value
Financial capital Intellectual capital
Human capital
Competences Relations Values
Organisational capital Innovation Intellectual Property Intangible assets Processes Culture
Figure 6: O rganisational value according to Roos e t al. (1997)
A substantial change to the Skandia Navigator schema was provided by Stewart (1998) who recognised that, analogously to what happen for human resources, customers are not owned by the organisation; thus, the customer capital was brought to the same level of the human and structural capital. This new approach generated the main three components of intellectual capital that the literature now acknowledges.
The Figure 7 shows what is globally known as Intellectual Capital:
Figure 7: Intelle ctual C apital components Organisational Value Financial capital Intellectual capital Human capital
Competences Attitudes Intellectual agility
Organisational capital
Relations Organisation Development Renewal &
Intellectual capital Human capital capabilities skills competences ... Structural capital patents trademarks copyrights ... Relational capital customers suppliers partners ...
To provide a better understanding of what the Figure 7 shows, following, it will be illustrated in a non-exhaustive way the Intellectual Capital components, even recalling the study carried out by Roos et al. (1997):
1.1.1 Human Capital
As it has been mentioned previously, human capital is made up by the so called human
resources, which are related to all those resources embodied in the individuals employed
by or linked to the organisation in a way that makes it possible for the organisation to deploy these resources and reach its market goals.
Human resources are represented by the accumulated value of investments in people training, competence, and other intangible elements such those related to the people motivation. Bontis (2001) explained human capital as the combination of knowledge, skill, innovativeness, and ability of a company’s individual employees to meet the task. In other terms, Stewart (1997) described human capital as the part of intellectual capital that leaves the organisation at the end of the working day.
Nonaka (2002) stated that knowledge is created and organized by the flow of information, tied on the commitment and beliefs of its holder. Thus, human capital refers to the tacit knowledge embedded in the minds of employees.
Ulrich (1998) was one of the first authors who proposed a measurable definition of human capital, which is the product of “competence” and “commitment.” He defined Competence mainly considering two aspects: (1) competencies shall be aligned with business strategy; and (2) competencies have to be generated through more than one mechanism, such as buy, build, borrow, bounce, and bind (Ulrich, 1998). Further, Commitment is reflected in how employees relate to each other and feel about the organisation where they work (Ulrich, 1998). Therefore, to investigate what Ulrich (1998) called commitment, he indicated three fundamental ways: (1) reduce demands, (2) increase resources, and (3) turn demands into resources.
What the literature argued sheds light on the fact that human capital is the fundamental part of an organisation. In fact, human capital can be defined as the contribution that the single employee adds to the process of value creation. Edvinsson (1997) stated that if the intellectual capital was a tree, humans would be the lymph that allows it to grow up.
Nowadays, human capital is becoming increasingly important for every business since firms employ and trait it as a strategic asset that is able to give them the possibility to outperform their competitors. In fact, a routine work that requires few standard capabilities, does not generate any form of human capital for the organisation, due to the fact that it could be automated. Even in the case where a specific routine work cannot be automated, workers employed in it, could be easily substituted since they were hired for manual instead of knowledge-based work/job.
Several authors recognised that human capital plays a strategic role. Becker (1962) found positive relations amidst salaries, profits and human capital. Even before Becker, Simon (1947) rejected the traditional theory (a rational entrepreneur mainly oriented to the maximisation of his profits), replacing it with another one more knowledge-oriented, focused on a variety of cooperating decision makers who have limited rational capacities due to the lack of information and knowledge about the consequences of their decisions. Further, the Simon’s approach emphasised the role of the so called collective knowledge, which results from the aggregation and integration of individuals’ knowledge.
Other studies acknowledged the importance of human capital, Stewart (1997) stated it encloses “the capabilities of the individuals required to provide solutions to customers”; Pennings et al. (1998) and Finkelstain and Hambrick (1996) recognised the linkages between human capital and firms’ performances.
Hill et al. (2001) demonstrated that accumulating human capital allows companies to establish synergies and enhance productivity and performances; whereas Davenport (2005) tied the strategic nature of human capital to the organisations’ willingness to invest in it. Some examples are displayed by the Table 1, which is founded on the study carried out by Roos et al. (1997). This table cannot be intended as complete but for illustrative purposes only, and the individual organisation will have to define the dimensions that are relevant when it comes to creation of value.
Human Capital Potential resources
Competences
Specific knowledge fields that encompass tacit aspects.
Specific abilities that encompass tacit aspects.
Brain power or processing capacity (IQ).
Human Capital Potential resources
Ability to build personal networks.
Ability to participate in (maintain) personal networks.
Ability to use (leverage) personal networks
Attitudes
Behavioral traits including social intelligence.
Motivation.
Pace - sometimes known as sense of urgency.
Endurance or perseverance.
Intellectual agility
Ability to innovate.
Ability to imitate.
Ability to adapt.
Table 1: Human capital potential re source s
1.1.2 Structural Capital
Structural capital involves certain types of resources that, as stated by Edvinsson (1997) are “those resources that remain in the organisation when the employees have left the
building but that cannot be found on the balance sheet”.
Bontis (2002) defined structural capital as the non-human storehouses of knowledge embedded within the organisational routines and processes. In other words, according to Bontis (2002) structural capital is made up by structures, systems, and other tools.
Structural capital, differently from human capital, is completely owned and controlled by the organisation; in fact, it is generally identified by the knowledge transferred from the individuals (human capital) and the relationships amidst them, to the organisational structures (such culture, processes, procedures, policies, etc.).
Therefore, structural capital regards the organisational structure that is able to support (i) human capital performance (by helping employee to reach their best performance) and (ii) the overall business performance. As demonstrated, human capital impact on structural capital, since the first one is fundamental for the overall organisational success.
However, it could be even noticed that structural capital exists independently from the human capital (i.e. organisational culture and structure); further, as stated by Roos et al.
(1997) and by Skandia (1996), both structural and human capital enable organisations to create, develop and use innovation capital.
According to several authors (Bontis et al., 2000; Bontis, 2002; Ordóñez de Pablos, 2002), structural capital consists of two main elements: (i) technological component and (ii) architectural competencies.
Bontis (2002) defined the first one as the capabilities and knowledge that are fundamental to day-to-day operations, such as tacit knowledge, design policies/r ules, etc. The second element is devoted to the ability of the organisation to integrate its core competencies in several flexible and new ways to develop other competencies, i.e. problem solving strategies, new communication channels, new values, etc.
Chen et al. (2004) stated that an organisation having a strong structural capital, in terms of performances, it could create a favourable ground to use human capital proficiently and, as a consequence, to boost its customer and innovation capital.
As it has been done in Table 1 for human capital, some examples of subdivision of structural resources are listed in Table 2, even in this case, the table is not complete and it is for illustrative purposes only.
Structural Capital Potential resources
Externally oriented
Brands
T rademarks
Service offerings
Product concepts
Patents and other IP
Internally oriented Processes Organisational structures Systems Information on paper Information in databases Software Organisational culture
1.1.3 Relational Capital
Relational capital includes all those resources concerning relationships that an organisation has with entities outside the organisational boundaries and that influence the organisation’s ability to create value. Relational resources, similarly to the human ones, are not owned and controlled by the organisation. In fact, considering a specific organisation, it does not own its customer relationships but it can influence them.
Therefore, relational capital is generally defined as that component of intellectual capital embedded within all the relationships that a specific organisation establishes with its stakeholders that are able to affect its strategies (Lin, 2001; Nahapiet and Goshal, 1998). These relationships could be found in or developed from the relationships established directly by the organisation or by individuals.
The intellectual capital literature (i.e. Dyer and Nobeoka, 2000) argued that relationships with stakeholders should be considered as a necessary condition for developing the organisational business, particularly by exploiting external relationships to have access to critical resources.
Some authors (Prahalad and Ramaswamy, 2000) suggested that customers are increasingly becoming a new source of competence for the organisation because they renew the organisation knowledge base and consequently its overall competences preventing these from the obsolescence in a turbulent environment (Gibbert et al., 2002; Pantano et al., 2013).
Recalling the concept of networking relationships, it is recognised that these provide value for the market actors (e.g. individuals or organisations) by allowing them to get access to the resources hidden within such relationships (Acquaah, 2007). Other scholars such as Pfeffer and Salancik (1978) and Peng and Heath (1996) argued that networking relationships are more fruitful for organisations when they need to face a high uncertainty within the business environment where they operates.
Dyer and Nobeoka (2000) claimed that the relationships that an organisation establishes with their stakeholders (i.e. customers, suppliers, institutions, business partners, etc.) enable it to create and exploit its intellectual capital. In particular, establishing relationships with customers could means build and develop brand loyalties (Park and Luo, 2001), building relationships with suppliers could offer access to high quality raw materials and delivery services (Peng and Luo, 2000), while creating business partnerships
could attenuate the possibility of facing opportunistic behaviours (Pisano, 1989), enhance trust relationships (Kale et al., 2000) and develop new inter-firm relationships to freely exchange information, skills, know-how and competencies (Kale et al., 2000; Walker et al., 1997).
Measuring the value of relational capital is fundamental in several theoretical research fields; within the intellectual capital theory it can be measured, according to Bontis (2002) by considering it a “function of longevity, whereas in the marketing literature, it is the results of long term relationships (Hakansson and Snehota, 1995).
As done for the two aforementioned intellectual capital dimensions (human and structural capital), Table 3 displays, for illustrative purpose only, some potential resources related to the relational capital:
Relational Capital Potential resources
Directly business related
Customers
Suppliers
Partners
Unions
Channels to market/representatives
So urces of new knowledge (e.g., universities)
Indirectly business related
Owners Media Regulatory bodies Pressure/interest groups Local government National government Educational institutions
1.2 Intellectual Capital: the VAIC approach
The Value Added Intellectual Coefficient (VAIC) was developed by Pulic (2000); however, according to Pulic, Intellectual Capital (IC) is not a collection of different assets, but a set of knowledge workers.
Therefore the way for measuring knowledge work productivity becomes the main methodological concern for Pulic.
Pulic’s proposal is to use the value added as an indicator of the value created by intellectual labor (knowledge workers). To Pulic, the operational tool for measuring value creation is the “Value Added” Income Statement. In fact, if properly interpreted, the Value Added Income Statement is able to measure the value creation of knowledge investments (Figure 8).
Figure 8: Pulic scheme
The term Human Capital (HC) for Pulic is not a set of characteristics (capability, skills, etc.) held by employees, as in the Skandia Navigator, but the amount of capital invested in knowledge workers (wages, salaries, training, etc).
Structural capital is the share of value added after deducting investment in human capital (HC). Clearly this is not the meaning of SC in Skandia Navigator.
Starting from the concept of Value Added, Pulic constructed the VAIC (Value Added Intellectual Coefficient) as:
VAIC = ICE + CEE
where:
ICE = HCE + SCE (Intellectual Capital Efficiency);
HCE = VA/HC (Human Capital Efficiency);
SCE = SC/VA (Structural Capital Efficiency);
CE is the book value of Capital Employed.
For a detailed analysis of Pulic’s proposal see Iazzolino and Laise (2013).
In order to construct his measure of Value Creation, Pulic (2008) started from the Value Added Income Statement (Table 4):
Sales OUT
- Costs IN
= Value Added VA
- Salary and wages HC
= Structural capital (EBITDA) SC
- Depreciation and Amortization A + D
= Operating Profit P
Table 4: Value Adde d Income Stateme nt
This Income Statement shows that:
VA = HC + SC [1]
Pulic’s proposal is enclosed into the [1].
To satisfy all stakeholders (first of all, employees and shareholders) it is necessary to create Value Added (VA) for paying the personnel wages (HC) and the gross operating profit (SC or EBITDA). Thus, the higher the VA created, the greater the possibility to satisfy the expectation of both employees (HC) and shareholders (SC).
From the [1], it is possible to obtain:
1 = HC/VA + SC/VA
By setting:
VA/HC = HCE (Human Capital Efficiency or knowledge worker productivity)
SC/VA = SCE (Structural Capital Efficiency),
it can be obtained:
SCE = 1 – (1/HCE) [2]
This is the main formula of Pulic’s proposal. It links the Value Creation for shareholders (SCE) with the productivity of knowledge workers (HCE). It appears that the variable on which the Value Creation for shareholders (SCE) depends is the knowledge workers’ productivity (HCE). The higher the productivity of knowledge workers (HCE) the higher
the value created for shareholders (SCE). Therefore, the condition for creating value for shareholders is:
SCE > 0 HCE >1 VA > HC [3]
Hence, the strategies for creating value for shareholders may be summarised as follow:
1] The main driver for creating value is the productivity of knowledge workers (HCE = VA/HC);
2] To enhance the value HCE needs to increase and this could be done by increasing VA, or by reducing HC, or by increasing VA and reducing HC at the same time.
3] Knowledge organisations, in order to increase HCE, invest in knowledge. This means adopting technologies which incorporate a high knowledge (i.e. robotics, artificial intelligence, etc.). Investments in technologies “knowledge-intensive” have two effects that increase the productivity of knowledge workers:
4] Firstly, there is a reduction of employees costs (HC) due to the investments in new technologies that allow firms to reduce the workforce (labour saving), even if the individual wages of knowledge workers increase. As a consequence, the productivity of knowledge workers grows up.
5] On the other hand, investments in new technologies “knowledge-intensive” increase the Value Added per employee and hence increase the productivity of knowledge workers.
6] The combined effect is a high growth of productivity of knowledge workers (HCE) and therefore, a high growth of shareholder value (SCE), that is the necessary condition to be able to make further investments in knowledge for iterating the cycle 1) - 6).
The sequence of effects described from 1) to 6) can be defined the “chain reaction” highlighted by Pulic’s proposal.
The [2] is the main formula that encloses Pulic’s message. However, there are other ways to explain the same proposal; one of these uses the Intellectual Capital Efficiency (ICE) concept.
The [4] provides the same information of the [2]:
The correspondence between these two formulations is shown in Table 5.
[2] [4]
Value Destruction SCE < 0 HCE < 1 (SCE < 0 and HCE < 1) ICE < 1
No Value Creation SCE = 0 HCE = 1 (SCE = 0 and HCE = 1) ICE = 1
Value Creation SCE > 0 HCE >1 (SCE > 0 and HCE >1) ICE >1 Table 5: Corre spondence be tween [2] and [4]
In Table 6 the characteristic values of ICE are shown:
ICE HCE SCE Judgment
1 1 0 Worse performance
(Much worrying: Edge of survival) 1,25 1,13 0,12 Low performance (Worrying) 1,75 1,44 0,31 Relatively good performance 2,00 1,62 0,38 Good performance
2,5 2 0,5 Successful performance
Table 6: IC E and measure of pe rformance (elaborate d from Pulic, 2008)
Pulic completes his analysis by constructing an overall efficiency indicator defined as:
VAIC = ICE + CEE [5]
where:
CEE = VA/CE is the Capital Employed Efficiency; CE = Book value of Capital Employed.
1.3 Firms’ performances
Within every organisation, measuring performances is one of the most important tasks since it is fundamental for defining corporate strategies. Therefore, organisations are particularly interested in building their own performance measurement system to define an objective evaluative indicator to measure their performance outcomes. Generally, all the organisational stakeholders obtain a great amount of information deriving from many sources such as financial database, financial statements, etc. Consequently, this information could be exploited by a wide range of users; some of them are listed below:
1. Shareholders may want use such kind of information to make the right investment decisions, i.e. buy and sell stocks , or to evaluate similar companies.
2. Investors, i.e. banks or financial institutions, may be interested in this information to evaluate if a certain company will be able to pay its debts or not.
3. Managers, by exploiting this information might be able to evaluate and compare performances coming from different divisions or organisational functions; further, they can compare performances over certain periods to have a whole vision on how the organisation performed over that period.
As stated previously, information about financial performances can be derived from several kinds of sources, first of all, it could be gathered from the company financial statements; however, there are financial databases such Datastream (Thomson Reuters) and Amadeus (Bureau van Dijk) that can be used to harvest financial information.
Financial performances can be measured according to different ways; in this thesis, performance measures have been categorised as follow:
1. Accounting-based performances: indicators chiefly based on financial statements. These include traditional measures such as return on investment (ROI) and return on equity (ROE) as profitability indexes, quick and current ratios as liquidity indexes and so on.
2. Value-based performances: these kinds of indicators strive to measure the firm’s value. Within these measurements, it is possible to distinguish the (i) direct and (ii) relative evaluation. The first one is focused on the estimation of cash flows; whereas the latter try to estimate the firm’s value by comparing similar organisations.
Following, accounting and value-based performances will be explained more in detail.
1.3.1 Accounting-based performances
Accounting-based measures are typically related to variables or ratios extracted from the main financial statements, the balance sheet, the income statement and the statement of cash flows. Such kinds of measures are generally useful to evaluate the firm’s economic value according to several perspectives, i.e. profitability, liquidity, growth, etc.
Therefore, evaluating performances by using accounting-based measures, which are usually described by economic-financial ratios , has been a powerful and useful tool for decision-makers such as shareholders, investors, managers, banks, etc.
Rather than measuring performances by looking at only the total amounts gathered from the financial statements (i.e. values of costs, incomes, revenues, interests, etc.), analysts prefer to use ratios to obtain robust and meaningful outcomes. Hence, the financial he alth of a certain organisation can be analysed by using the ratio analysis, which allow analysts to compare that organisation’s financial performances with performances obtained by other organisations; as a consequence, it is possible, through the ratio analysis, to evaluate economic-financial performances across industries.
Generally, the literature on accounting and finance organises financial ratios into different classes such as liquidity, profitability, long-term solvency, asset turnover or utilisation, and so on. Liquidity ratios measures the ability of a certain organisation to pay its short-term debts; whereas, long-term solvency determine if that organisation is able to satisfy its creditors by looking at its long-term debts.
Profitability ratios give analysts and managers the possibility to evaluate the ability of an organisation to produce profits, to make it possible, these kinds of ratios takes account of sales, equity and organisational assets.
Asset turnover ratios investigate how a certain organisation is able to generate revenues by using its assets.
As it has been stated previously, f inancial ratios are computed by using variables commonly found on financial statements. The usage of accounting-based measures can provide the following benefits (Ross et al. , 2003):
Measuring the performance of managers for the purpose of rewards;
Measuring the performance of departments within multi-level companies;
Projecting the future by supplying historical information to existing or potential investors;
Providing information to creditors and suppliers;
Evaluating competitive positions of rivals;
Evaluating the financial performance of acquisitions.
Furthermore , financial ratios are also used for the purpose of predicting future performance. For example, they are used as inputs for empirical studies or are used to develop models to predict financial distress or failures, within the field of credit risk assessment (Altman, 1968; Beaver, 1966; Altman and Sabato, 2007; Iazzolino et al.,
2013a). In fact, many of recent studies focused on investigating and potentially predicting bankruptcy as a means to identify characteristics (in term of financial ratios) of good or bad-performing firms and their potential values (Kumar and Ravi, 2007; Iazzolino et al., 2013a).
In literature, there are many definitions of financial ratios, a possible classification is provided below:
Profitability ratios: they consist of values that take account of net income, EBIT, EBITDA. It could be noticed that these type of ratios measure, as stated before, the ability, of an organisation, to produce returns for their capital providers (i.e. shareholders, equity capital providers, investors, etc.). In fact, when there are no profits, shareholders, or generally anyone who invests within a certain organisation, could reasonably think to invest his capital in alternative investments; hence, any capital provider is interested in knowing how an organisation performs in terms of profitability. Some examples of profitability measures are: return on equity (ROE), return on investments (ROI), return on assets (ROA), cash return on capital employed (Cash ROCE), net profit margin, net asset turnover, gross profit margin, etc.
Activity ratios: they are able to show how a certain organisation efficiently manages its short-term assets and liabilities such as working capital. These kinds of measures look at short-term periods, generally referred to a financial year; hence, some examples are: debtor days, creditor days, stock days, sales/net current assets, etc.
Liquidity ratios: these ratios measure the ability of an organisation to transform its assets into cash. Another definition of these ratios was provided by Brealey et al. (2001) who stated that these measures evaluate how quickly a certain company is able to convert its assets into liquidity. Some examples of such kinds of ratios are: current and quick ratios.
Leverage ratios: gearing or leverage ratios evaluate how an organisation is able to satisfy its financial obligations; hence, it is measured the ability of a certain company to meet the return expectations of its capital providers. Some examples are: capital gearing ratio, debt/equity ratio, interest cover, etc.
Growth ratios: they try to measure how a certain organisation grows with respect to a defined period. Hence, these indexes takes account of changes occurred in total assets, operating assets, sales, total and operating expenses, etc.
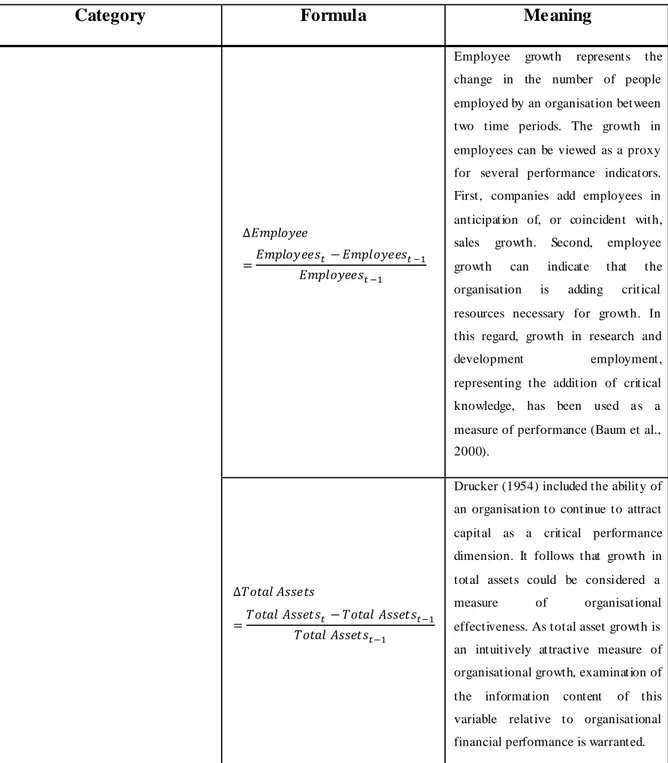
Following, in the Table 7, some potential indicators for each category aforementioned are shown:
Category Formula Meaning
Profitability
ROE measure s the income available to common stockholders (residua l claimants) as a percentage of the book value of their investment in the organisation. ROE is subject to the same issues as a ll profitability measures with respect to its numerator, net income.
ROI measures the return available to providers of long-term capital to the organisation, including both debt and equity capital. T he intention of this calculation is to examine the return available to all capital providers, so it is generally inappropriate to use net income after the effects of interest expense; in this sense, for calculating ROI, EBIT is preferred as numerator.
ROA measures the organisation’s ability to use its assets to create profits (measured by net income).
RO S measures the percentage of sales retained as profits, and is also known as net profit margin. ROS is influenced by the financial structure of the organisation since net income is calculated after interest expense.
It is the percentage of EBIT DA generated by the investments made by an organisation. T his indicator is useful to identify companies having high growth capacities. This ratio uses E BIT DA at its numerator since it is in essence, operating profit
Category Formula Meaning
excluding non-cash expenses such a s depreciation and amortisation (a regular provision writing down intangible assets such as goodwill), it is similar to cash flow from operating activities, ignoring the effect of changes in working capital. As a measure of financial performance, EBIT DA eliminates the effects of financing and capital expenditure, and hence can indicate trends in sustainable profitability.
It is a profitability index that represents the percentage of EBIT DA generated by the Sales.
Activity
The value of credit sales is usually not available and it is common for sales or turnover to be used a s a substitute. T he debtor days ratio gives the average period of credit being taken by customers. If it is compared with a company’s allowed credit period, it can give an indication of the efficiency of debtor administration.
T rade creditors should be compared with credit purchases, but as this information is not always available, cost of sales is often used instead. T he creditor days ratio gives the average time taken for suppliers of goods and services to receive payment.
This ratio shows how long it takes for a company to turn its stocks into sales. Several other ratios can be calculated by separating the total stock figure into its component parts, i.e. raw materials, work-in-progress and finished goods. The shorter the stock days ratio, the lower the cost to the company of holding stock. T he value of this ratio is very dependent
Category Formula Meaning
significantly depending on the nature of a company’s business.
Fixed asset turnover indicates the sales bein g generated by the fixed asset base of a company. Like ROI, it is sensitive to the acquisition, age and valuation of fixed assets.
This ratio shows the level of working capital supporting sales. Working capital must increase in line with sales if undercapitalisation is to be avoided and so this ratio can be use d to forecast the level of working capital needed for a given level of sales when projecting financial statements.
Liquidity
This ratio measures a company’s ability to meet its financial obligations as they fall due. It is often said that the current ratio should be around two, but what is normal will vary from industry to industry: sector averages are a better guide than a rule of thumb.
It is argued that the current ratio may overstate the ability to meet financial obligations because it includes stock in the numerator. This argument has merit if it takes more than a short time to convert stock into sales, i.e. if the stock days ratio is not small. T he quick ratio compares liquid current assets with short -term liabilities. While a common rule of thumb is that it should be close to one, in practice the sector average value should be use d as a guide.
Leverage
The purpose of this ratio is to show the proportion of debt finance used by
a company. When comparing
Category Formula Meaning
essential to confirm that the same method of calculation is use d because other definitions of this ratio are found. One alternative replaces long-term debt capital with prior charge capital, which includes preference shares as well a s de bt.
This ratio serves a similar purpose to capital gearing. A company could be said to be highly geared if its debt/equity ratio were greater than 100 per cent using book values, but again this is only a rule of thumb.
Interest cover shows how many times a company can cover its current interest payments out of current profits and indicates whether servicing debt may be a problem. An interest cover of more than seven times is usually regarde d as safe, and an interest cover of more than three times as acceptable. These are only rules of thumb, however, and during periods of low and stable interest rates, lower levels of interest cover may be deemed acceptable. Interest cover is a clearer indication of financial distress than either capital gearing or the debt/equity ratio, since inability to meet interest payments will lead to corporate failure no matter what the level of gearing may be.
Gro wth
Sale s growth is the primary measure of growth used in the empirical studies. It measures the growth of sales considering two different time periods (generally indicated as t and t -1). It is an organisational growth measure even use d by analysts to predict future growths within a specific market.
Category Formula Meaning
Employee growth represents the change in the number of people employed by an organisation between two time periods. The growth in employees can be viewed as a proxy for several performance indicators. First, companies add employees in anticipation of, or coincident with, sales growth. Second, employee growth can indicate that the organisation is adding critical resources necessary for growth. In this regard, growth in research and
development employment,
representing the addition of critical knowledge, has been used a s a measure of performance (Baum et al., 2000).
Drucker (1954) included the ability of an organisation to continue to attract capital as a critical performance dimension. It follows that growth in total assets could be considered a
measure of organisational
effectiveness. As total asset growth is an intuitively attractive measure of organisational growth, examination of the information content of this variable relative to organisational financial performance is warranted.
Table 7: Examples of indicators (adapte d from C arton, 2006 and Watson and Head, 2007)
1.3.2 Value-based performances
As stated by Damodaran (2005), in corporate finance there are mainly four approaches to firm evaluation according to a value-based perspective:
(i) the Discounted Cash Flow (DCF) method, according to which the value of an asset (or a firm) is the present value of the expected cash flows produced by the same asset (or firm) over the future;
(ii) the Liquidation and Accounting valuation, based on the evaluation of the existing assets of a firm, by estimating the value (or the book value) of the assets;
(iii) the Contingent Claim valuation, which uses option pricing models to measure the value of assets having “option” characteristics;
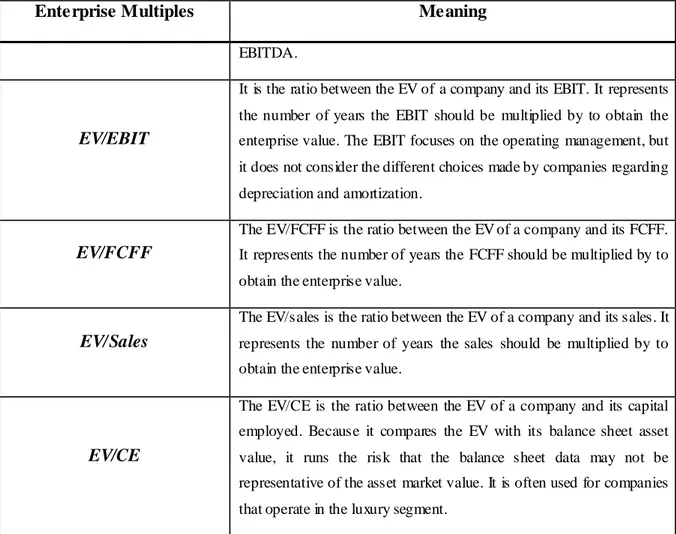
(iv) the Relative Valuation method, which estimates the value of an asset by looking at assets (or firms) that can be considered “comparables”, on the basis of a common variable like earnings, cash flows, book value or sales. In this last approach the s.c. Multiples are used, that are constructed as ratios in which the numerator is the market value (Enterprise Value or Equity Value) and the denominator is a book variable like earnings, cash flows, EBITDA, etc.
1.3.2.1 Discounted Cash Flows method
Generally, within discounted cash flows (DCF) method, the value associated to any asset is estimated by discounting the expected cash flows related to t hat asset according to a specified discounting rate that emphasise how risky that asset is (Damodaran, 2014). Therefore, the intrinsic value characterising an asset can be estimated.
This intrinsic value can be interpreted as a function of the cash flows generated by a certain asset, and as a consequence, by its life, expected cash flows and the risk linked to the asset itself (as it has been said previously, risk or riskiness is measured by the discounting rate). Hence, according to Damodaran (2014), the value of a defined asset could be estimated by the following formula:
where N is the life of the asset (generally expressed in years) and r is the discount rate that reflects the riskiness of the asset. As Damodaran (2014) stated, if a firm is viewed as a portfolio of assets, the equation aforementioned can be extended to obtain the value of a firm, using, similarly to what done for an asset, cash flows to the firm over its life (expressed in years) and a discount rate that reflects the whole riskiness of the firm’s assets.
Within the evaluation based on DCF method, there are two main steps: the first concerns the estimation of the equity stake; the second one refers to the estimation of the entire firm
value.
Hence, the value of equity can be computed by discounting expected cash flows to equity, which are, the residual cash flows after having met all the operating expenses, tax obligations, and interest and principal payments, at the cost of equity, which is, the rate of return expected by equity investors.
where CF to Equityt is intended as the expected cash flow to equity in period t, and ke is the cost of equity. A special case of equity valuation is the dividend discount model, where the value of a stock is the present value of expected future dividends.
Similarly to what it has been done for the estimation of the value of an asset, the value of
the firm is got by discounting expected cash flows to the firm, which is, residual cash flows
after having met all operating expenses, taxes and reinvestment needs, but prior to have paid debts, at the weighted average cost of capital (WACC)1.
where CF to Firmt is defined as the expected cash flow to firm in period t, and WACC is, as previously argued, the weighted average cost of capital. Although the two approaches use different definitions of cash flow and discount rates, they will generate consistent estimations of the value of equity if the same hypotheses are applied to both approaches. Further, Damodaran (2014) stated that within the equity evaluation “it is important to
avoid mismatching cash flows and discount rates, since discounting cash flows to equity at the weighted average cost of capital will lead to an upwardly biased estimate of the value of equity, whereas discounting cash flows to the firm at the cost of equity will yield a downwardly biased estimate of the value of the firm”.
1
where, D stands for both the long-term and short-term debt of the company, while E is the company equity. kD is the company cost of debt, tc is the tax rate, kE is the equity cost of capital.
1.3.2.2 Liquidation and Accounting valuation
As stated previously, within the DCF evaluations, the value of a certain asset can be estimated as the present value of its expected cash flows. This concept can be extended to evaluate an entire company by arguing that the value of its business can be interpreted as the sum of values linked to the specific assets owned by that company.
However, a company is an ongoing market entity that owns specific assets and invests for its future; this can be noticed by looking at its balance sheet (Table 8):
Assets Liabilities
Assets in place
Existing investments generate cash flows today. In other words, investments already made.
Debt
Borrowed money
Gro wth Assets
Expected value that will be created by future investments. In other words, investments yet to be made.
Equity
Owner’s funds
Table 8: Balance shee t (adapte d from Damodaran, 2005)
As it can be noticed by looking at the balance sheet, investments that have already been made by the company are dubbed as assets in place, whereas investments that the company expects to make in the future are named as growth assets. According to Damodaran (2005), a financial balance sheet gives a good framework to emphasise the differences between evaluating a business as a “going concern” and evaluating it as a sum of its assets. In fact, when analysts make a going concern evaluation, their judgement is not only based on existing but even on expected future investments and the profitability linked to them.
On the other hand, the main focuses of an “asset-based” valuation are the assets in place and estimate the value of each asset considered separately (Damodaran, 2005). However, to what concerns companies with lucrative growth opportunities, asset-based valuations will produce lower values than “going concern” valuations (Damodaran, 2005).
In conclusion, there are two main ways to make these kinds of evaluations: (i) book value -based and (ii) liquidation valuations as they had been named by Damodaran (2005).
Book value-based valuation
The accounting literature has always tried to provide a measure representing the “real” value of a company, which can be intended as a real earnings potential and a reliable estimation of the company’s assets and equity value obtained by using the profit and loss statement as well as the balance sheet. However, the treatment of historical costs has developed differently with respect to various asset classes.
The book value-based valuation starts from the assumption that a company book value can be considered as a good proxy of its market value. As a consequence, this kind of valuation could be applied to organisations having a high value of fixed assets and a restricted potential for further growth. In literature, some methods that are able to incorporate earnings into book value-based valuations have been carried out. The residual income model, chiefly founded on the dividend discount model, try to put expected dividends in relation to book value; therefore, the equity book value at the start of a defined period shall be equal to the equity book value at the start of the previous period plus net income minus all dividends paid out (Damodaran, 2005).
Recently, other advancements in fair value accounting have been developed, and particularly, there were a return to the idea that the balance sheet might provide a better viewpoint of the “real” firm’s value. Therefore, on the one hand, this linkage could give more useful information for every investor; on the other side, with the use of fair value accounting, it could increase the possibility of misuse and manipulation, hence, the techniques such as marking to market could only reflect what has already happened into the market itself (Damodaran, 2005; Gitman, 2006; Koller et al., 2005).
Liquidation valuation
In the case of liquidation, company’s assets need to be sold in a very short time period, which could result in a discount depending on the number of potential buyers, the whole state of economy and the assets’ features.
Liquidation value may be expressed as a percentage of the book value. In fact, it could be difficult to estimate liquidation value as a fraction of a discounted cash flow value mainly due to the underlying growth assumptions in “going concern” valuation.
Obviously, liquidation valuation is considered appropriate for those companies (that find themselves in financial distress) that need to dispose their assets urgently (Damodaran, 2005; Gitman, 2006; Koller et al., 2005).
Commonly to what happen for discounted cash flows methods, the basic approac h is to estimate the value of an organisation by directly making investigations on it and on the assets that it owns. However, while liquidation and accounting valuations are founded on the ability of a certain firm to generate returns starting from its currently existing assets, discounted cash flows methods are more focused on company’s growth opportunities (Damodaran, 2002; Koller et al., 2005).
1.3.2.3 Contingent claim valuation
Damodaran (2012) stated that in some cases, the value of an asset cannot be greater than the present value of its expected cash flows, especially when these cash flows are characterised by the contingency of a certain event, either it occurs or not.
Hence, due to the development of the option pricing model, the concept of contingency has come out in the last few years. Even though these models were initially used to estimate the value of traded options, in the last decades, they have been extended to traditional evaluations, generally known as “real” valuations. In fact, some scholars such Damodaran (2012) used the “option approach”, instead of employing traditional DCF models, to estimate the value of some kinds of assets such patents or undeveloped reserves.
As a consequence, Damodaran (2012) argued “a contingent claim or option pays off only
under certain contingencies - if the value of the underlying asset exceeds a pre-specified value for a call option, or is less than a pre-specified value for a put option”. In the last
decades, much work has been done, by many scholars and practitioners, in carrying out models that are able to evaluate options, and these option pricing models can be used to evaluate any kind of assets that have option-like features. The following diagram (Figure 9) illustrates the payoffs on call and put options as a function of the value of the underlying asset: