Astronomy
&
Astrophysics
https://doi.org/10.1051/0004-6361/201936899© MAGIC Collaboration 2020
MAGIC very large zenith angle observations of the Crab Nebula
up to 100 TeV
MAGIC Collaboration: V. A. Acciari
1, S. Ansoldi
2,23, L. A. Antonelli
3, A. Arbet Engels
4, D. Baack
5, A. Babi´c
6,
B. Banerjee
7, U. Barres de Almeida
8, J. A. Barrio
9, J. Becerra González
1, W. Bednarek
10, L. Bellizzi
11,
E. Bernardini
12,16, A. Berti
13, J. Besenrieder
14, W. Bhattacharyya
12, C. Bigongiari
3, A. Biland
4, O. Blanch
15,
G. Bonnoli
11, Ž. Bošnjak
6, G. Busetto
16, R. Carosi
17, G. Ceribella
14, Y. Chai
14, A. Chilingaryan
18, S. Cikota
6,
S. M. Colak
15, U. Colin
14, E. Colombo
1, J. L. Contreras
9, J. Cortina
19, S. Covino
3, V. D’Elia
3, P. Da Vela
17, F. Dazzi
3,
A. De Angelis
16, B. De Lotto
2, M. Delfino
15,26, J. Delgado
15,26, D. Depaoli
13, F. Di Pierro
13, L. Di Venere
13,
E. Do Souto Espiñeira
15, D. Dominis Prester
6, A. Donini
2, D. Dorner
20, M. Doro
16, D. Elsaesser
5,
V. Fallah Ramazani
21, A. Fattorini
5, G. Ferrara
3, D. Fidalgo
9, L. Foffano
16, M. V. Fonseca
9, L. Font
22, C. Fruck
14,
S. Fukami
23, R. J. García López
1, M. Garczarczyk
12, S. Gasparyan
18, M. Gaug
22, N. Giglietto
13, F. Giordano
13,
N. Godinovi´c
6,?, D. Green
14, D. Guberman
15, D. Hadasch
23, A. Hahn
14, J. Herrera
1, J. Hoang
9, D. Hrupec
6, M. Hütten
14,
T. Inada
23, S. Inoue
23, K. Ishio
14, Y. Iwamura
23, L. Jouvin
15, D. Kerszberg
15, H. Kubo
23, J. Kushida
23, A. Lamastra
3,
D. Lelas
6, F. Leone
3, E. Lindfors
21, S. Lombardi
3, F. Longo
2,27, M. López
9, R. López-Coto
16, A. López-Oramas
1,
S. Loporchio
13, B. Machado de Oliveira Fraga
8, C. Maggio
22, P. Majumdar
7, M. Makariev
24, M. Mallamaci
16,
G. Maneva
24, M. Manganaro
6, K. Mannheim
20, L. Maraschi
3, M. Mariotti
16, M. Martínez
15, D. Mazin
14,23, S. Mi´canovi´c
6,
D. Miceli
2, M. Minev
24, J. M. Miranda
11, R. Mirzoyan
14,?, E. Molina
25, A. Moralejo
15, D. Morcuende
9, V. Moreno
22,
E. Moretti
15, P. Munar-Adrover
22, V. Neustroev
21, C. Nigro
12, K. Nilsson
21, D. Ninci
15, K. Nishijima
23, K. Noda
23,
L. Nogués
15, S. Nozaki
23, S. Paiano
16, J. Palacio
15, M. Palatiello
2, D. Paneque
14, R. Paoletti
11, J. M. Paredes
25, P. Peñil
9,
M. Peresano
2,?, M. Persic
2,28, P. G. Prada Moroni
17, E. Prandini
16, I. Puljak
6, W. Rhode
5, M. Ribó
25, J. Rico
15,
C. Righi
3, A. Rugliancich
17, L. Saha
9, N. Sahakyan
18, T. Saito
23, S. Sakurai
23, K. Satalecka
12, K. Schmidt
5,
T. Schweizer
14, J. Sitarek
10, I. Šnidari´c
6, D. Sobczynska
10, A. Somero
1, A. Stamerra
3, D. Strom
14, M. Strzys
14, Y. Suda
14,
T. Suri´c
6, M. Takahashi
23, F. Tavecchio
3, P. Temnikov
24,?, T. Terzi´c
6, M. Teshima
14,23, N. Torres-Albà
25,
L. Tosti
13, V. Vagelli
13, J. van Scherpenberg
14, G. Vanzo
1, M. Vazquez Acosta
1, C. F. Vigorito
13, V. Vitale
13,
I. Vovk
14,?, M. Will
14, and D. Zari´c
6(Affiliations can be found after the references) Received 11 October 2019 / Accepted 2 January 2020
ABSTRACT
Aims. We measure the Crab Nebula γ-ray spectral energy distribution in the ∼100 TeV energy domain and test the validity of existing
leptonic emission models at these high energies.
Methods. We used the novel very large zenith angle observations with the MAGIC telescope system to increase the collection area
above 10 TeV. We also developed an auxiliary procedure of monitoring atmospheric transmission in order to assure proper calibration of the accumulated data. This employs recording optical images of the stellar field next to the source position, which provides a better than 10% accuracy for the transmission measurements.
Results. We demonstrate that MAGIC very large zenith angle observations yield a collection area larger than a square kilometer. In
only ∼56 h of observations, we detect the γ-ray emission from the Crab Nebula up to 100 TeV, thus providing the highest energy measurement of this source to date with Imaging Atmospheric Cherenkov Telescopes. Comparing accumulated and archival MAGIC and Fermi/LAT data with some of the existing emission models, we find that none of them provides an accurate description of the 1 GeV to 100 TeV γ-ray signal.
Key words. gamma rays: general – methods: observational – ISM: supernova remnants
1. Introduction
The Crab Nebula broad-band emission is usually interpreted in the framework of leptonic models. The radio to megaelectron-volt (MeV) gamma-ray emission is attributed to synchrotron radiation of energetic electrons in the 120−150 µG nebula
?Corresponding authors: MAGIC Collaboration, e-mail: [email protected]
magnetic field. At higher energies, giga- to teraelectronvolt (GeV to TeV) emission is linked to the inverse Compton (IC) scattering on the synchrotron, infrared (IR) and cosmic microwave background (CMB) photons. The morphology of the Nebula, revealed by the optical and X-ray data, is non-trivial. Nonetheless, its broad-band spectral energy distribution (SED) is reasonably well described even by one-zone models, involv-ing diverse electron distributions (Meyer et al. 2010) and/or
A158, page 1 of10
propagation and cooling effects (Martín et al. 2012;Fraschetti & Pohl 2017).
At the same time, most of the proposed models fail to describe the details of the Crab Nebula SED (Aleksi´c et al. 2015). The highest model-to-data deviations lie in the kiloelectronvolt (keV) to MeV range, where the SED softens, and GeV to TeV range, where the IC peak appears broader than suggested by several models. In addition to IC-related emission, bremsstrahlung and proton–proton interactions may also con-tribute to the GeV–TeV emission, if emitting electrons are at least partially confined in the filaments of the nebula, filled with the ionised gas (Atoyan & Aharonian 1996, see also Sect.5).
One way to resolve this degeneracy is offered by observations at the highest energies above several tens of TeV, where at least the bremsstrahlung process gives a subdominant contribution to the Nebula emission. The dominant emission at those energies is due to the combination of the synchrotron self-compton (SSC) and IC/CMB emission of electrons with energies &1013eV. The
SSC part of the emission at these energies is produced in the deep Klein-Nishina regime Eγ
bkgEe/(m2ec4) & 1, with Eγbkgbeing
the energy of the background photons, Ee that of electrons, me
the electron mass, and c the speed of light. This means that the SSC spectrum traces that of the underlying electron popula-tion. This way, the apparent changes in the synchrotron spectrum at keV-MeV energies should also manifest themselves in the ∼10−100 TeV energy band. The absence of the corresponding spectral changes at these energies would indicate the subdomi-nant nature of the leptonic SSC emission at the highest energies, emitted by the Nebula in favour of other competing mechanisms. Observations at energies &10 TeV are usually associated with low event count rates from astrophysical sources. The col-lection area Aeffof Imaging Atmospheric Cherenkov Telescopes
(IACTs) is determined by the size of the Cherenkov light cone from the γ-ray induced extended air showers (EAS). For ver-tical observations the collection area of a single telescope is ∼0.05 km2. The collection area can be increased using a larger
number of telescopes, like the forthcoming Cherenkov Tele-scope Array (CTA) observatory. Alternatively, a similar effect can be achieved by using observations at higher zenith angles (ZA;Sommers & Elbert 1987) (see alsoKonopelko et al. 1999;
Ahnen et al. 2017). This observation mode leads to an increase in the Cherenkov pool size due to the larger distances to the show-ers. At the same time the reduced photon density on the ground shifts the energy threshold of the telescope to significantly higher energies. Technical details of the novel very large zenith angle (VLZA) observation technique can be found inMirzoyan et al.
(2018).
In this paper we present the results of the Crab Nebula obser-vation at VLZAs (>70◦) with the MAGIC telescopes and discuss
them in the context of other multi-wavelength data of this source.
2. MAGIC very large zenith angle observations of the Crab Nebula
2.1. The MAGIC telescopes
The Major Atmospheric Gamma Imaging Cherenkov (MAGIC) telescopes are a system of two 17 m diameter IACTs, located at an altitude of 2200 m above sea level at the Roque de los Muchachos Observatory on the Canary Island of La Palma, Spain (28◦N, 18◦W).
The telescopes are used to image flashes of Cherenkov light produced by the charged component of EAS initiated in
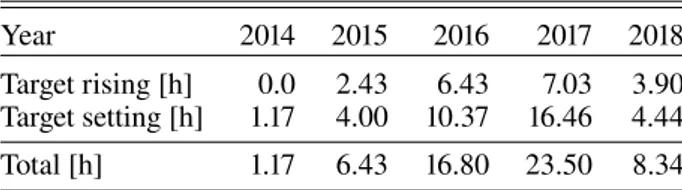
Table 1. Summary of the duration of the MAGIC Crab Nebula VLZA observations.
Year 2014 2015 2016 2017 2018
Target rising [h] 0.0 2.43 6.43 7.03 3.90
Target setting [h] 1.17 4.00 10.37 16.46 4.44
Total [h] 1.17 6.43 16.80 23.50 8.34
Notes. The observational time is given separately for the rise and set of the source on the horizon. Observation time is given in hours, after the data selection cuts.
the upper atmosphere by gamma-ray photons with energies &30 GeV. Both telescopes are nominally operated together in coincidence mode (also called stereoscopic mode), in which only events simultaneously triggering both telescopes are recorded and analysed (Aleksi´c et al. 2016a). For low zenith angle (<30◦)
observations and for E > 220 GeV, the integral sensitivity of MAGIC is (0.66 ± 0.03)% in units of the Crab Nebula flux (C.U.) for 50 h of observations (Aleksi´c et al. 2016a).
2.2. Observations
The data sample presented here was accumulated from Decem-ber 2014 to NovemDecem-ber 2018 in the ZA range 70◦−80◦ and
comprises ≈56 h of good-quality data (after the initial data selec-tion as described below; ≈88 h before the selecselec-tion), taken in the so-called wobble mode (Fomin et al. 1994). The summary of observational time per year is given in Table1.
Two configurations can be used for VLZA observations of the Crab Nebula by MAGIC: during the source rise and during the set above the horizon. These configurations give somewhat different sensitivities of the MAGIC stereoscopic system to the incoming γ-ray flux due to the varying projected inter-telescope distance, as seen from the direction of the source (stereo base-line). The two MAGIC telescopes are located north-east and south-west from the system centre, thus providing a larger base-line in the north–north-west and south–south-east directions. With the declination of ≈22◦, the Crab Nebula rises at ≈77◦
and sets at ≈283◦ azimuths (counting from the north), i.e.
north–north-east and north–north-west correspondingly. Here both “rise” and “set” configurations were used with most of the data taken in the set direction due to the larger stereo baseline.
Observations in the VLZA regime correspond to shower distances of &50−100 km from the telescopes as opposed to ∼10 km at lower zenith angles .30◦. As such, these
measure-ments are subject to increased light attenuation due to the scatter-ing and absorption in the atmosphere. The standard MAGIC way to account for this effect (i.e. using a dedicated micro-LIDAR system; Fruck et al. 2014) only allows us to probe the atmo-spheric absorption at distances .20 km. To ensure an appropriate control over the wavelength-dependent atmosphere attenuation we took additional contemporaneous images of the stellar field next to the Crab Nebula with red, green, and blue filters which allows the total atmospheric transmission to be monitored with an accuracy better than 10%. The details of this procedure are given in AppendixB.5(see alsoMirzoyan et al. 2018).
We did not change the optical focusing of the telescopes (usually set to a distance of 10 km) as our tests with the Monte Carlo simulation did not indicate any significant performance improvement by doing so.
3. Data analysis
3.1. MAGIC data analysis
The acquired data are reduced with the standard MAGIC Analy-sis and Reconstruction Software (MARS;Zanin et al. 2013). We first remove events detected during adverse weather conditions and those corresponding to the known temporary hardware issues. Due to the nature of VLZA observations, several usual data cuts are no longer efficient. These include the presence of the clouds in the telescope’s field of view measured with an infrared pyrometer system (Gaug et al. 2014), and the number of stars detected by the MAGIC star-guider cameras. The cor-responding measurements were used to cross-check the applied event selection. The latter was based on the cuts on the mean cur-rents of photomultipliers, the event trigger rate, and the LIDAR transmission at the maximum accessible range.
We use the standard MAGIC MARS routines to recon-struct the initial direction and impact distance with respect to the MAGIC telescopes for the recorded EAS images. These were augmented with contemporaneous atmospheric transmis-sion monitoring and corrections, as explained in AppendixB.5.
To reconstruct the energy of the EAS initiating particle, three different methods were used: (a) standard MARS procedure based on a look-up table (LUT,Aleksi´c et al. 2012) created from the MAGIC Monte Carlo (MC) simulations, (b) random forest (RF) multivariate analysis, and (c) neural network (NN) regres-sion. The applied cosmic-ray background suppression was based on the classification scheme implemented with both RF (Albert et al. 2008;Aleksi´c et al. 2012) and NN. All these techniques yield consistent results. To derive the results shown below, LUT energy estimation and RF event classification techniques were employed.
3.2. Fermi/LAT data analysis
In this work we made use of the publicly available Fermi/LAT Pass 8 data set1. We used the Fermi Science Tools
pack-age2 v9r33p0 for data processing, retaining only the “Source”
(P8R2_SOURCE_V6) class events, registered until June 2017 within the 75◦ zenith angle; we did not apply the ROI-based
zenith angle cut. The photons selected from the 20◦ region
around the Crab Nebula position were also required to lie within the Crab Pulsar 0.60-0.82 phase range where the neb-ula emission dominates (Abdo et al. 2010). We did not apply an additional gating of the Crab Nebula flares (Abdo et al. 2011; Buehler et al. 2012). These flares mostly affect the low-energy synchrotron emission of the Nebula, and due to their .500 MeV cut-off energy are practically undetectable above ∼3 GeV energy, and even in the 0.3−1 GeV energy range con-tributions of the flares to the average Nebula flux in 9 yr is limited to 5−10% due to their short duration. The fluxes of all the sources in the 300 MeV–510 GeV energy range in the selected region were estimated from the joint likelihood fit. Given the Crab Nebula brightness in the Fermi/LAT energy range, the fit-ted model included the diffuse background components (namely iso_P8R2_SOURCE_V6_v06.txt and gll_iem_v06.fits) and 20 brightest objects from the 3FGL catalogue (Acero et al. 2015) within 28 degrees from the source of interest. The Crab Nebula model itself comprised a single power law; using more complex
1 http://fermi.gsfc.nasa.gov/cgi-bin/ssc/LAT/ LATDataQuery.cgi 2 http://fermi.gsfc.nasa.gov/ssc/data/analysis/ scitools/
10
010
110
2Energy, TeV
10
210
110
0Co
lle
ct
io
n
ar
ea
, k
m
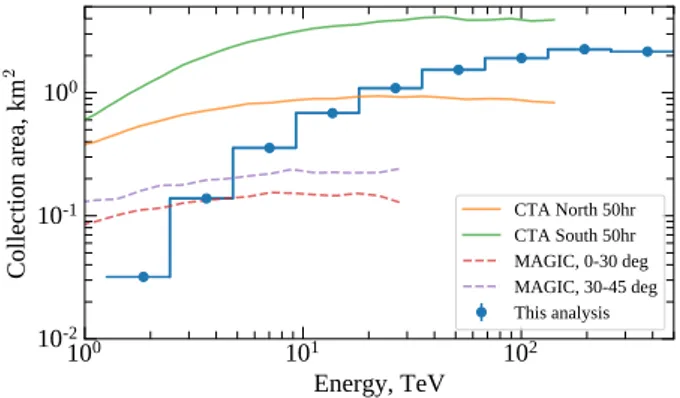
2 CTA North 50hr CTA South 50hr MAGIC, 030 deg MAGIC, 3045 deg This analysisFig. 1.MAGIC collection area, estimated for an observational sample in the zenith angle range 70◦−80◦ with Monte Carlo simulations (see alsoMirzoyan et al. 2018), and for comparison the collection area (for 20◦ zenith angle observations in so-called Production 3 layout) of the future CTA array (see Sect.4for details). Also shown is the MAGIC collection area at lower zenith angles fromAleksi´c et al.(2016a).
multi-component models is not required with the narrow energy bins (five per decade) used here.
4. Results
During the VLZA data taking, the low-energy threshold after the data selection cuts quickly increases from ∼1 TeV at zenith angle of 70◦to ∼10 TeV when approaching 80◦. The collection
area at energies above 70 TeV quickly reaches approximately 2 km2(compared to ∼0.1 km2for low zenith angle observations,
Aleksi´c et al. 2016a), leading to an unprecedented gamma-ray collection area.
To estimate the MAGIC performance for the acquired VLZA data, we used a dedicated Monte Carlo simulation, describing the MAGIC observations of gamma-ray induced air showers in the zenith angle range 70◦−80◦. This simulation was
per-formed with the Corsika code (Heck et al. 1998), modified to include the MAGIC specific output. It also included the curva-ture of the Earth’s atmosphere to properly describe the increasing air column density during the near-horizon observations. The rest of the simulation procedure was performed the same way as for the lower zenith angle observations (e.g. Aleksi´c et al. 2016a). The resulting collection area estimated after the data selection cuts is shown in Fig.1. For comparison, shown is the expected collection area of the CTA3, which is currently under
construction.
It should be noted, that despite of the increase in the collec-tion area, MAGIC VLZA performance is impacted by the limited reconstruction of the shower parameters, resulting from their remoteness (&50−100 km) and correspondingly smaller image size in the telescope camera. In the case of MAGIC, the mea-sured images sizes are decreased to 3–4 pixels for most of the detected showers. Though the number of excess events in our data sample changes with energy as expected given the collection area, we find that these small images degrade the performance of the cosmic-ray background suppression technique we employ. In addition we also note an approximately twofold degradation of the energy and angular resolution, compared to observations at small zenith angles (Aleksi´c et al. 2016a). Given that this is a novel technique for IACT observations, we anticipate that a
3 Expected CTA performance can be found here: https://www.
100 101 102 Energy, TeV 102 101 100 101 102 E 2 d N /d E, eV /(c m 2se c) Aleksic+ '15 Aharonian+ '06 Aharonian+ '04 This work (forward folding) This work (unfolding) HEGRA (Aharonian+ '04) H.E.S.S. (Aharonian+ '06) HAWC (Abeysekara+ '19) TIBET AS+MD (Amenomori+ '19)
Fig. 2.Spectral energy distribution of the Crab Nebula, obtained with MAGIC VLZA observations (red). Results of the spectral unfolding (data points) and of the forward-folding (band) procedures are shown. Dashed colored lines (blue, green, and orange, respectively) denote the archival best fits to the Crab Nebula spectra fromAharonian et al.(2004,
2006), and Aleksi´c et al. (2015). Data points from Aharonian et al.
(2004,2006),Abeysekara et al.(2019) andAmenomori et al. (2019) are also shown for comparison.
certain improvements can be achieved with dedicated, optimised analysis. Still we find that processing of the VLZA data with the standard MAGIC MARS tools at present allows us to perform the interesting studies shown below.
In 56 h of observations, the Crab Nebula signal at estimated energies above 30 TeV was detected at a ≈6.5σLi & Ma(1983) significance level. Despite the increased energy threshold, the spectrum could be reconstructed down to the energy of ∼1 TeV.
In order to reconstruct the Crab Nebula SED at energies above 1 TeV, we made use of all three energy estimation methods outlined in Sect.3.1. We applied the background rejection with both the standard MARS routines and dedicated NN, each time adjusting the cuts so as to maintain 90% of Monte Carlo gamma rays in each energy bin.
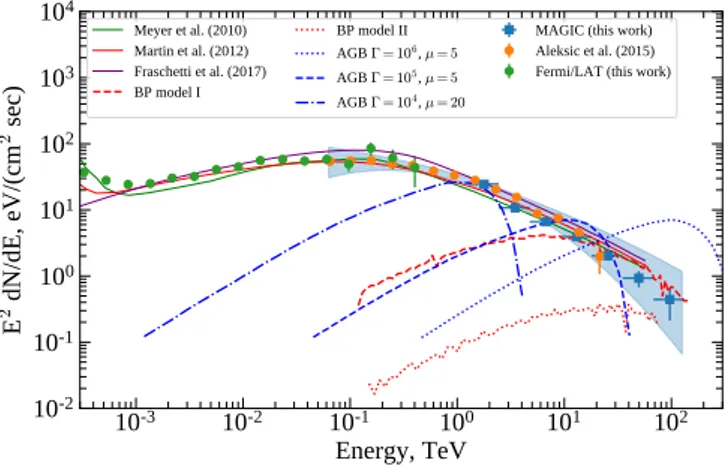
The SED of the Crab Nebula up to ∼100 TeV, obtained with the LUT energy estimation method, is shown in Fig. 2, which shows that the previous HEGRA (Aharonian et al. 2004) spec-trum, produced with about 400 h of data, is within .20% of the MAGIC results. A comparison of these data with the previous lower energy measurements, including the lower ZA MAGIC observations fromAleksi´c et al.(2015), is given in Fig.3. Our data do not support the indications for the ∼30 TeV high-energy cut-off, suggested earlier (Aharonian et al. 2006).
In Fig.3we also fit the Crab Nebula SED above 60 GeV with the log-parabola function dN/dE = f0(E/E0)(α+β log10(E/E0)), also
using the archival MAGIC data (Aleksi´c et al. 2015) in addition to the VLZA measurements. Accounting for 15% systematics (17% for VLZA) in the MAGIC energy scale and 11% (20% for VLZA) on the flux scale (Aleksi´c et al. 2015,2016a), we find this fit to be in poor agreement with the data (χ2 ≈ 33 over 14
degrees of freedom), indicating that the log-parabola does not provide a good match to the Crab Nebula spectral shape over the entire 60 GeV–100 TeV energy range. Otherwise, the best-fit parameters are similar to those found inAleksi´c et al.(2015); for fixed E0 =1 TeV we find α = −2.48 ± 0.03, β = −0.23 ± 0.01,
and f0=(2.95 ± 0.27) × 10−23ph/(cm2sec eV) (all uncertainties
correspond to 1σ confidence range).
As Fig.3shows, the overall shape of the GeV to 100 TeV γ-ray emission of the Crab Nebula can be reasonably described within the framework of existing theoretical models like
10
310
210
110
010
110
2Energy, TeV
10
210
110
010
110
210
310
4E
2d
N
/d
E,
eV
/(c
m
2se
c)
Meyer et al. (2010) Martin et al. (2012) Fraschetti et al. (2017) BP model I BP model II AGB Γ = 106, µ = 5 AGB Γ = 105, µ = 5 AGB Γ = 104, µ = 20 MAGIC (this work) Aleksic et al. (2015) Fermi/LAT (this work)Fig. 3. Crab Nebula spectrum obtained here compared to the lower energy measurements with MAGIC (Aleksi´c et al. 2015) and Fermi/ LAT. The blue shaded band denotes the 68% confidence flux range, esti-mated from the fit with the log-parabola function. Solid lines of different colours show several leptonic models fromMeyer et al.(2010),Aleksi´c et al.(2015) andFraschetti & Pohl(2017), previously constructed for the Crab Nebula. Dashed lines denote predictions for hadronic contri-bution fromBednarek & Protheroe(1997) (BP), andAmato et al.(2003) (AGB). Shown is the bulk wind Lorentz factor (Γ), and µ = n/n is the effective target material density increase over its mean value.
Meyer et al.(2010),Martín et al.(2012), andFraschetti & Pohl
(2017). At the same time, these models do not reproduce the gradual softening of the inverse Compton (IC) emission peak at multi-TeV energies. A simultaneous fit of Fermi/LAT, and archival and VLZA MAGIC data to the best-fit model curves yields relatively high χ2values: 183.0/26 d.o.f. forMeyer et al.
(2010), 77.5/26 d.o.f. forMartín et al.(2012), and 140.0/26 d.o.f. forFraschetti & Pohl(2017) (as presented inAleksi´c et al. 2015). It should be noted though that these high χ2 values seem to
be dominated by the point-to-point systematics, which is not accounted for here.
5. Discussion
The novel method of VLZA observations with the MAGIC tele-scopes allows us to detect gamma rays up to hundreds of TeV in a few tens of hours. It can be efficiently used to search for astrophysical sources accelerating particles to PeV energies. This observation technique requires simultaneous measurements of the atmospheric transparency, careful studies of systematics, and properly tailored MC data. To this end we have developed an auxiliary atmospheric transmission measurement procedure employing contemporaneous measurements of stellar light from the region next to the γ-ray target.
As discussed earlier, the remoteness of the showers from the telescope during VLZA observations has an impact on the instrument performance. At present this impacts our ability to infer the highest-energy flux from the soft-spectrum sources like Crab Nebula. Along with other differences in the VLZA shower development (Neronov et al. 2016), this indicates that a revi-sion of the analysis technique is needed to fully reveal the full potential of VLZA data taking.
Still, the obtained VLZA Crab Nebula data at a few tens of TeV agree well with the earlier, lower zenith angle measurements with HEGRA (Aharonian et al. 2004) that were obtained in observations that were approximately eight times longer. VLZA measurements presented here also support the source spectrum
extension up to 100 TeV and likely beyond. These results are consistent with findings of HAWC (Abeysekara et al. 2019) and Tibet ASγ collaborations (Amenomori et al. 2019).
Generally, the available multi-wavelength Crab Nebula flux measurements can be explained within the framework of lep-tonic models; however, they do not provide much flexibility in the spectral shape of the inverse Compton emission part (Atoyan & Aharonian 1996). Testing the source flux ratios in the energy bins above 0.3 TeV, we found that overall they are consistent with the leptonic framework expectation, following the simpli-fied argumentation inAtoyan & Aharonian (1996). However, a direct comparison of several models to the combined Fermi/LAT and MAGIC data suggests that they do not provide an adequate description of the Nebula flux in the energy range up to 100 TeV, yielding significant flux residuals in the 1–3 TeV energy range. This is consistent with theAleksi´c et al.(2015) conclusions that the IC peak is broader than expected from the modelling.
At the same time, several theoretical studies have suggested that the highest energy emission of the Crab Nebula may have at least a partial contribution from the interaction of accelerated particles with the ambient medium (e.g. Atoyan & Aharonian 1996;Bednarek & Protheroe 1997;Bednarek & Bartosik 2003;
Amato et al. 2003). Such interactions may be intensified if particles are trapped in the Nebula filaments, leading to a approx-imately twentyfold effective target density increase (Atoyan & Aharonian 1996). The extension of the Crab Nebula synchrotron emission to ∼100 MeV energies implies the presence of PeV electrons. This suggests the hadrons in the Nebula could also be accelerated to similar energies, given their generally lower losses via synchrotron radiation. Energetic protons would nat-urally contribute to the γ-ray flux at TeV energies via p−p interactions. Several predictions from such models are plotted with dashed and dotted lines in Fig.3.
As can be seen from Fig.3, the MAGIC data disfavour a putative significant hadronic contribution to the measured TeV flux. This in turn implies that the accelerated nuclei constitute a minor fraction of the pulsar wind power and/or do not gener-ally interact with the overdense Nebula filaments. Further VLZA observations can be used to refine this statement via a more accurate spectral shape estimation at the highest energies.
Overall, the VLZA observation technique extends MAGIC sensitivity to the highest energies, allowing us to search for galactic PeVatrons in the pre-CTA era. With an appropriate adap-tation, this technique may also be used by CTA itself to further boost its sensitivity to the highest energy γ-ray events.
Acknowledgements. We would like to thank the Instituto de Astrofísica de Canarias for the excellent working conditions at the Observatorio del Roque de los Muchachos in La Palma. The financial support of the German BMBF and MPG, the Italian INFN and INAF, the Swiss National Fund SNF, the ERDF under the Spanish MINECO (69818-P, FPA2012-36668, FPA2015-68378-P, C6-2-R, C6-4-R, FPA2015-69210-C6-6-R, AYA2015-71042-P, AYA2016-76012-C3-1-P, ESP2015-71662-C2-2-P, FPA2017-90566-REDC), the Indian Department of Atomic Energy, the Japanese JSPS and MEXT, the Bulgarian Ministry of Education and Science, National RI Roadmap Project DO1-153/28.08.2018 and the Academy of Finland grant nr. 320045 is gratefully acknowledged. This work was also supported by the Spanish Centro de Excelencia “Severo Ochoa” SEV-2016-0588 and SEV-2015-0548, and Unidad de Excelencia “María de Maeztu” MDM-2014-0369, by the Croatian Science Foundation (HrZZ) Project IP-2016-06-9782 and the Univer-sity of Rijeka Project 13.12.1.3.02, by the DFG Collaborative Research Centers SFB823/C4 and SFB876/C3, the Polish National Research Centre grant UMO-2016/22/M/ST9/00382 and by the Brazilian MCTIC, CNPq and FAPERJ. This research has made use of the CTA instrument response functions provided by the
CTA Consortium and Observatory, seehttp://www.cta-observatory.org/
science/cta-performance/(version prod3b-v1) for more details.
References
Abdo, A. A., Ackermann, M., Ajello, M., et al. 2010,ApJ, 708, 1254
Abdo, A. A., Ackermann, M., Ajello, M., et al. 2011,Science, 331, 739
Abeysekara, A. U., Albert, A., Alfaro, R., et al. 2019,ApJ, 881, 134
Acero, F., Ackermann, M., Ajello, M., et al. 2015,ApJS, 218, 23
Aharonian, F., Akhperjanian, A., Beilicke, M., et al. 2004,ApJ, 614, 897
Aharonian, F., Akhperjanian, A. G., Bazer-Bachi, A. R., et al. 2006,A&A, 457, 899
Ahnen, M. L., Ansoldi, S., Antonelli, L. A., et al. 2017,A&A, 601, A33
Albert, J., Aliu, E., Anderhub, H., et al. 2008,Nucl. Instrum. Methods Phys. Res. A, 588, 424
Aleksi´c, J., Alvarez, E. A., Antonelli, L. A., et al. 2012,Astropart. Phys., 35, 435
Aleksi´c, J., Ansoldi, S., Antonelli, L. A., et al. 2015,J. High Energy Astrophys., 5, 30
Aleksi´c, J., Ansoldi, S., Antonelli, L. A., et al. 2016a,Astropart. Phys., 72, 76
Aleksi´c, J., Ansoldi, S., Antonelli, L. A., et al. 2016b,Astropart. Phys., 72, 61
Amato, E., Guetta, D., & Blasi, P. 2003,A&A, 402, 827
Amenomori, M., Bao, Y. W., Bi, X. J., et al. 2019,Phys. Rev. Lett., 123, 051101
Atoyan, A. M., & Aharonian, F. A. 1996,MNRAS, 278, 525
Bednarek, W., & Bartosik, M. 2003,A&A, 405, 689
Bednarek, W., & Protheroe, R. J. 1997,Phys. Rev. Lett., 79, 2616
Brun, R., & Rademakers, F. 1997,Nucl. Instrum. Method, A389, 81
Buehler, R., Scargle, J. D., Blandford, R. D., et al. 2012,ApJ, 749, 26
Chollet, F. et al. 2015, Keras,https://keras.io
Da Vela, P., Stamerra, A., Neronov, A., et al. 2018,Astropart. Phys., 98, 1
Fomin, V. P., Stepanian, A. A., Lamb, R. C., et al. 1994,Astropart. Phys., 2, 137
Fraschetti, F., & Pohl, M. 2017,MNRAS, 471, 4856
Fruck, C., Gaug, M., Zanin, R., et al. 2014, ArXiv e-prints [arXiv:1403.3591]
Gaug, M., Blanch, O., Dorner, D., et al. 2014, ArXiv e-prints [arXiv:1403.5083]
Heck, D., Knapp, J., Capdevielle, J. N., Schatz, G., & Thouw, T. 1998,
CORSIKA: a Monte Carlo code to simulate extensive air showers(Karlsruhe: Forschungszentrum Karlsruhe GmbH)
Hillas, A. M. 1985, International Cosmic Ray Conference, 3
Konopelko, A., Aharonian, F., Hemberger, M., et al. 1999,J. Phys. G Nucl. Phys., 25, 1989
Li, T.-P., & Ma, Y.-Q. 1983,ApJ, 272, 317
Maneva, G. M., Temnikov, P. P., & Procureur, J. 2003,Nucl. Instrum. Meth., A502, 789
Martín, J., Torres, D. F., & Rea, N. 2012,MNRAS, 427, 415
Meyer, M., Horns, D., & Zechlin, H.-S. 2010,A&A, 523, A2
Mirzoyan, R., Vovk, I., Peresano, M., et al. 2018, Nucl. Instrum. Methods Phys. Res. Sect. A, in press
Neronov, A., Semikoz, D. V., Vovk, I., & Mirzoyan, R. 2016,Phys. Rev. D, 94, 123018
Peterson, C., Rognvaldsson, T., & Lonnblad, L. 1994,Comput. Phys. Commun., 81, 185
Sommers, P., & Elbert, J. W. 1987,J. Phys. G Nucl. Phys., 13, 553
Zanin, R., Carmona, E., Sitarek, J., Colin, P., & Frantzen, K. 2013, in Proc. of the 33rd International Cosmic Ray Conference, Rio de Janeiro, Brasil
1 Instituto de Astrofísica de Canarias, 38200 La Laguna, and Uni-versidad de La Laguna, Departamento de Astrofísica, 38206 La Laguna, Tenerife, Spain
2 Università di Udine, INFN Trieste, 33100 Udine, Italy 3 National Institute for Astrophysics (INAF), 00136 Rome, Italy 4 ETH Zurich, CH-8093 Zurich, Switzerland
5 Technische Universität Dortmund, 44221 Dortmund, Germany 6 Croatian Consortium: University of Rijeka, Department of Physics,
51000 Rijeka; University of Split – FESB, 21000 Split; University of Zagreb – FER, 10000 Zagreb; University of Osijek, 31000 Osijek; Rudjer Boskovic Institute, 10000 Zagreb, Croatia
7 Saha Institute of Nuclear Physics, HBNI, 1/AF Bidhannagar, Salt Lake, Sector-1, Kolkata 700064, India
8 Centro Brasileiro de Pesquisas Físicas (CBPF), 22290-180 URCA, Rio de Janeiro (RJ), Brasil
9 IPARCOS Institute and EMFTEL Department, Universidad Com-plutense de Madrid, 28040 Madrid, Spain
10 University of Łód´z, Department of Astrophysics, 90236 Łód´z, Poland
11 Università di Siena and INFN Pisa, 53100 Siena, Italy 12 Deutsches Elektronen-Synchrotron (DESY), 15738 Zeuthen,
13 Istituto Nazionale Fisica Nucleare (INFN), 00044 Frascati (Roma) Italy
14 Max-Planck-Institut für Physik, 80805 München, Germany 15 Institut de Física d’Altes Energies (IFAE), The Barcelona Institute
of Science and Technology (BIST), 08193 Bellaterra (Barcelona), Spain
16 Università di Padova and INFN, 35131 Padova, Italy 17 Università di Pisa, and INFN Pisa, 56126 Pisa, Italy 18 ICRANet-Armenia at NAS RA, 0019 Yerevan, Armenia 19 Centro de Investigaciones Energéticas, Medioambientales y
Tecnológicas, 28040 Madrid, Spain
20 Universität Würzburg, 97074 Würzburg, Germany
21 Finnish MAGIC Consortium: Finnish Centre of Astronomy with ESO (FINCA), University of Turku, 20014 Turku, Finland; Astron-omy Research Unit, University of Oulu, 90014 Oulu, Finland
22 Departament de Física, and CERES-IEEC, Universitat Autònoma de Barcelona, 08193 Bellaterra, Spain
23 Japanese MAGIC Consortium: ICRR, The University of Tokyo, 277-8582 Chiba, Japan; Department of Physics, Kyoto University, 606-8502 Kyoto, Japan; Tokai University, 259-1292 Kanagawa, Japan; RIKEN, 351-0198 Saitama, Japan
24 Institute for Nuclear Research and Nuclear Energy, Bulgarian Academy of Sciences, 1784 Sofia, Bulgaria
25 Universitat de Barcelona, ICCUB, IEEC-UB, 08028 Barcelona, Spain
26 also at Port d’Informació Científica (PIC) E-08193 Bellaterra (Barcelona) Spain
27 Dipartimento di Fisica, Università di Trieste, 34127 Trieste, Italy 28 INAF-Trieste and Department of Physics & Astronomy, University
Appendix A: Artificial neural network tools for data analysis
Currently, the multivariate analysis methods based on artificial intelligence are being extensively developed and widely used. In the ground-based Cherenkov gamma-ray technique, charac-terised by a very small level of events constituting the source signal, the application of artificial neural networks (ANNs) has shown very good performance (Maneva et al. 2003).
Both energy reconstruction and gamma-hadron classifica-tion for VLZA analysis were checked by applying two different neural network tools. The first is based on JETNET Fortran package (Peterson et al. 1994) implemented for ROOT (Brun & Rademakers 1997) and MARS via C++ wrapper. The second uses the modern deep learning Tensor Flow4 libraries
imple-mented in the KERAS package (Chollet et al. 2015). In both analyses ANN results were added to the standard for MAGIC ROOT output files, so that the entire analysis program chain of MAGIC could be applied. We used feed-forward algorithms with back-propagation minimisation. The network architecture con-sists of an input layer, three hidden layers, and an output layer. As input we used Hillas parameters for both telescopes as well as the results of stereoscopic reconstruction (e.g. EAS impact distance and height of the shower maximum). The performance of the two tools is similar and comparable to that of the MAGIC stan-dard RF energy estimator. The advantage of Tensor Flow library is that it is several times faster than JETNET code, enabling better optimisation of the network architecture.
Appendix B: Systematic uncertainties in MAGIC VLZA measurements
The systematic uncertainties associated with the MAGIC VLZA observations largely overlap with those derived at lower zenith angles (Aleksi´c et al. 2016b,a) with regard to the telescope hard-ware performance. At the same time, the increased distance to EAS at large zenith angles affects the performance of the reconstruction techniques applied. Potentially, this makes them more sensitive to the otherwise small discrepancies between the MAGIC MCs and real VLZA EASs. Below we quantify the systematics contributions specific to VLZA data taking. B.1. Pointing accuracy
Increased gravitational loads during the VLZA observations, caused by the nearly horizontal orientation of the telescopes, result in bending of the telescope structure and camera sup-port arch. This effect is largely compensated by an active mirror control system and contemporaneous observations of positions of a number of reference stars next to the MAGIC field of view (Aleksi´c et al. 2016b,a).
To evaluate the effect from the remaining telescope mispoint-ing, we follow the approach taken inAleksi´c et al.(2016a) and compare the true sky position of the Crab Nebula to that derived from the data on several different epochs of observations. Due to the lower count rates during the VLZA observations, this com-parison is not possible on a nightly basis. We thus combine the data in sets spanning one or more months to properly determine the fitted source position in the skymaps. From these maps we determine the mispointing as the difference between the nominal and the reconstructed source positions.
4 https://www.tensorflow.org/
Fig. B.1. Time evolution of mispointing of Crab Nebula using the VLZA method. Each data point represents one or more months of taken data. The solid line represents the results from the analysis using the complete Crab VLZA data set, and the dashed lines represent the error on that value.
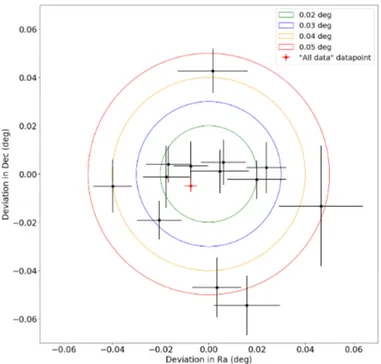
Fig. B.2.Mispointing in RA/Dec of each datapoint, as in Fig.B.1. The circles represent specific angular distances, as seen in the legend. The data point where all of the Crab VLZA data are analysed is represented in red.
The mispointing data versus time can be found in Fig. B.1. A two-dimensional plot of the mispointings in RA/Dec coor-dinates can be found in Fig. B.2. We can conclude that the systematic uncertainty on the reconstructed source position is ≈0.04◦. This value is larger than the one reported in Aleksi´c
et al.(2016a), which can be explained by the increased mechan-ical stress on the telescope structure when observing near the horizon in the VLZA regime. We note that this value is ≈4 times smaller than the MAGIC point spread function (PSF) during such observations.
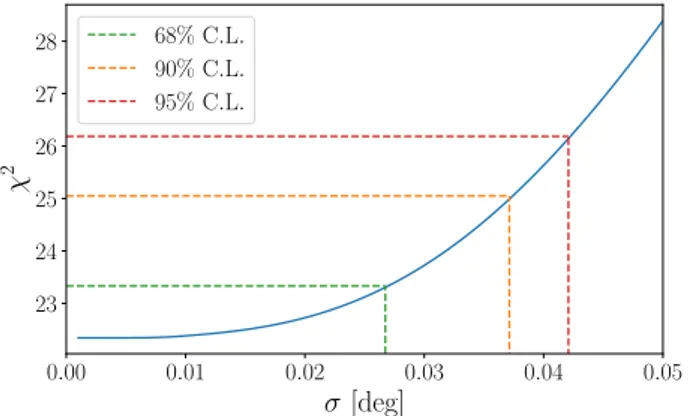
0.00 0.01 0.02 0.03 0.04 0.05 σ [deg] 23 24 25 26 27 28 χ 2 68% C.L. 90% C.L. 95% C.L.
Fig. B.3.Scan of an additional extension of the Crab Nebula angular profile above 10 TeV photon energy above the MC predicted PSF. The Y-axis gives the resulting χ2value of the fit with 16 degrees of freedom. The extension is expressed as the σ of the additional Gaussian com-ponent. The maximum allowed extension provides the measure of the remaining MAGIC mispointing.
Furthermore, an additional estimate of the remaining sys-tematic uncertainty on the event direction reconstruction can be obtained from the extension of the reconstructed Crab Nebula total angular profile with respect to the Monte Carlo estimated PSF. The MAGIC PSF shape is well described by a King func-tion (Aleksi´c et al. 2016a; Da Vela et al. 2018), whereas the putative additional mispointing that is random in nature would appear as an additional smearing of this profile. The fit of the VLZA Crab Nebula data above 10 TeV suggests that such addi-tional mispointing does not exceed 0.04◦at the 90% confidence
level, as shown in Fig.B.3.
The additional mispointing yields a broader PSF than pre-dicted by Monte Carlo simulation, thus affecting the true event containment within a given off-source angle cut. The resulting effect depends on the original (energy dependent) PSF width, and thus changes with the energy. Using the MAGIC VLZA sim-ulations we estimate the impact of this mispointing to be .4% at ∼3 TeV and .8% at ∼30 TeV energies.
B.2. Zenith angle dependence of the instrument response The rapid growth of the air mass with the zenith angle in the 70◦−80◦ range results in a gradual change of the MAGIC
response with respect to the incoming EAS. To account for this effect we split the MAGIC MC sample into 100 bins in cosine of zenith angle (in the 0◦−90◦range; such binning roughly follows
the growth of the air mass). The instrument response functions were then computed by re-weighting this sample with the zenith angle distribution of the accumulated data, as shown in Fig.B.4.
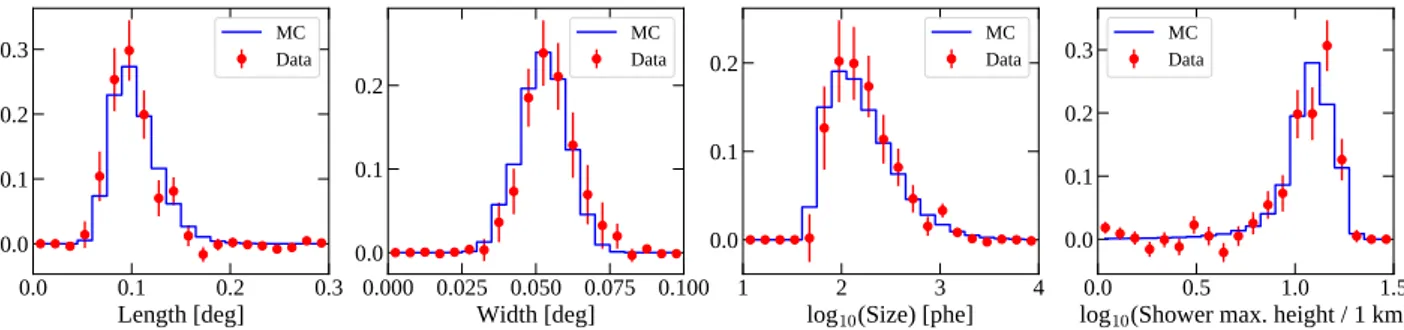
B.3. MC to data comparison
The development of extended air showers at zenith angles above 70◦proceeds primarily in the rarefied layers of the upper
atmo-sphere and at distances of &50−100 km from the observer. These conditions lead to certain peculiarities in the shower evo-lution (dependent on the nature of the primary particle; see
Neronov et al. 2016), which means that VLZA observations may be associated with a larger MC to data discrepancy than that derived from lower zenith angle data (Aleksi´c et al. 2016a).
In order to verify this, we compared the distribution of the basic EAS Hillas parameters Size, Length, and Width (Hillas
70
72
74
76
78
80
Zenith angle [deg]
0.000
0.025
0.050
0.075
0.100
0.125
Observation density
"Set" sample
"Rise" sample
Fig. B.4. Zenith angle distribution of the accumulated VLZA Crab Nebula observational sample, used to re-weight MAGIC response functions.
1985) as well as the height of the maximum shower development in MAGIC Monte Carlo and real event samples. For the latter we used the excess distributions of the same parameters in the on-and off-source regions, derived with loose event selection cuts. This comparison is shown in Fig.B.5 for events in the zenith angle range 70–75 deg where no significant difference is present between the real and simulated Crab Nebula VLZA signals. B.4. Energy bias and resolution
We estimate the MAGIC energy resolution and bias comparing the true MC simulated event energies to those obtained with our energy reconstruction algorithms. In order to parametrise the accuracy of the reconstruction we fit a Gaussian to the scaled (Eest− Etrue)/Etrue distribution of the estimated energies Eestin
narrow bins of Etrue. The mean of this distribution is taken as
a measure of bias, whereas its width corresponds to the energy resolution of the applied reconstruction procedure.
The resulting energy estimate is subject to uncertainties in the overall MAGIC light throughput, which are estimated to be .15% (Aleksi´c et al. 2016a). To estimate the possible impact on the VLZA energy reconstruction, we apply an additional scal-ing of the amount of light in the VLZA MC sample by ±15%. These scaled MCs are then processed as if no light scale had been applied. The bias and resolution resulting from them (as a function of the true event energy) are given in Fig.B.6.
As can be seen, the overall energy bias varies in the range [−20%; +15%], which gives an estimate of the instrumental MAGIC energy scale uncertainty in the VLZA regime. Since the total amount of light recorded from EAS plays a major role in the event energy reconstruction, it is worth noting that the resulting energy bias is almost directly proportional to the assumed light scale.
B.5. Atmospheric transmission
Atmospheric transmission directly affects the amount of EAS light that reaches the telescope camera. The uncertainties on the transmission contribute to the overall uncertainty of the VLZA energy scale, as discussed above.
To estimate the wavelength-dependent atmospheric trans-mission, we image the stellar field next to Crab Nebula with dedicated CCD cameras, located close to the centres of the MAGIC-I and MAGIC-II reflector dishes. The images were
0.0 0.1 0.2 0.3 Length [deg] 0.0 0.1 0.2 0.3 Relative events number MC Data 0.000 0.025 0.050 0.075 0.100 Width [deg] 0.0 0.1 0.2 MC Data 1 2 3 4 log10(Size) [phe] 0.0 0.1 0.2 MCData 0.0 0.5 1.0 1.5 log10(Shower max. height / 1 km) 0.0 0.1 0.2 0.3 MCData
Fig. B.5.Comparison of basic EAS reconstruction parameters between the MC simulated (blue) and real (red) event samples, recorded in the 70–75 deg zenith angle range. Size, Length, and Width are the so-called Hillas parameters (Hillas 1985), whereas the shower maximum height is reconstructed from the MAGIC stereo data by a standard analysis pipeline in MARS. Deviation of real distributions from MC does not exceed the 2σ confidence level.
Fig. B.6. Left: bias in the VLZA energy estimation computed for different scaling values of the MAGIC light throughput system. It is estimated as the mean of the Gaussian distribution of the estimated MC energies and is given relative to the assumed true energy in the simulation. Right: VLZA relative energy resolution for different scaling values of the MAGIC light throughput system computed as the sigma of the Gaussian distribution of the estimated MC energies.
taken every 90 s with the 90-s exposure, cyclically changing the colour filters from red (λmean ∼ 640 nm) to green (λmean∼
530 nm) to blue (λmean ∼ 450 nm). The acquired images were
flat-fielded and cleaned of hot pixels and dark current contribu-tion. Then counts from selected bright stars were estimated as a difference of counts from the circular region around the star and the background counts from an annular region of a larger diameter.
In order to calibrate this aperture photometry procedure, an additional imaging of this stellar field was performed on several clean nights, when atmosphere absorption showed no variation with height. During such nights light absorption in each colour filter follows a simple law:
c = c0exp (−αmair(z)). (B.1)
Here c is the number of background-subtracted CCD counts, c0
is the number of counts before absorption, α ≈ const is the spe-cific absorption coefficient, and mair is the air mass at a given
zenith angle z. The constant c0can be determined from Eq. (B.1)
from measured CCD counts at different zenith angles from the selected star. Knowing c0, the average absorption coefficient α
during the subsequent observational sessions can be estimated as α = − log (c/c0)/mair(z).
Contemporaneous imaging of those selected stars during the VLZA data taking allows us to estimate atmospheric trans-mission for EAS with a temporal resolution of 1.5−3 min. The height of each shower maximum, estimated as a part of the standard data reduction in MARS, is used to compute the
line-of-sight distance to the shower maximum and derive the corresponding value of the air mass mEAS
air . The resulting
absorp-tion can then be estimated as τdata=exp (−αmEASair (z)). The ratio
of this latter value to the absorption assumed in the MAGIC detector Monte Carlo simulations (for the same zenith angle and shower distance) defines the relative light scale s = τdata/τMC
in each of the colour filters, which – after a convolution with the Cherenkov emission spectrum – is finally used to correct the estimated event energies or select time intervals with good transmission.
Though the stellar light measurements described above pro-vide a simple and reliable way to estimate the total atmospheric transmission, they are subject to inaccuracies due to the uncer-tainties in the derived calibration constants c0and uncertainties
in the measured CCD counts during the observations. We min-imised the latter by choosing the camera exposure time so that the reference stars get &3 × 10⁴ CCD counts and the resulting
uncertainty is less than 1%.
The uncertainty on the calibration constants c0 was
com-puted from several c0
0 estimates, taken on nights with stable
atmosphere transparency (<10% deviations from Eq. (B.1) law), as shown in Fig.B.7. The standard deviation of these estimates suggests that the calibration constants for the reference stars are determined with an accuracy .5%.
The calculation of the exact transmission correction for a specific air shower from such stellar light measurements depends on the assumed distribution of the absorber in the atmosphere, which induces an additional uncertainty. Even though for mild
0
1
2
3
4
5
6
Air mass
12.5
12.0
11.5
11.0
10.5
10.0
Magnitude
Fig. B.7. Recorded CCD counts c from the star HD 35708 as a func-tion of air mass, converted to the stellar magnitudes m = m0− log2.512c with an arbitrary reference point m0. These counts were obtained with the green filter during the CCD imaging of the Crab Nebula region on nights with stable atmosphere transparency. Solid lines correspond to the fits of each night (see Eq. (B.1)) assuming α = const; their extrapo-lation to the zero air mass defines the reference calibration constant c0 for the particular filter used. The RMS of these extrapolations sets the c0uncertainty and is ≈0.04 mag for this calibration sample.
(.20%) light absorption the transmission estimates are generally accurate to within 3–5%, our estimates suggest that deviations of up to 10% are still possible in some cases. We thus conser-vatively use the 10% value as an estimate of the atmosphere transmission systematics.
B.6. Total systematic uncertainty
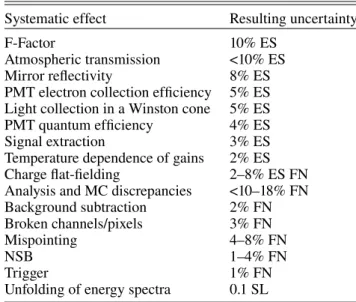
To estimate the total systematic uncertainty in the VLZA case, we also account for non-VLZA specific sources of MAGIC sys-tematics, reviewed in Aleksi´c et al.(2012); the resulting list of contributions is given in Table B.1. Combining them we find
Table B.1. Summary of the MAGIC Crab Nebula VLZA observations systematics.
Systematic effect Resulting uncertainty
F-Factor 10% ES
Atmospheric transmission <10% ES
Mirror reflectivity 8% ES
PMT electron collection efficiency 5% ES Light collection in a Winston cone 5% ES
PMT quantum efficiency 4% ES
Signal extraction 3% ES
Temperature dependence of gains 2% ES
Charge flat-fielding 2–8% ES FN
Analysis and MC discrepancies <10–18% FN
Background subtraction 2% FN
Broken channels/pixels 3% FN
Mispointing 4–8% FN
NSB 1–4% FN
Trigger 1% FN
Unfolding of energy spectra 0.1 SL
Notes. The values not specific to the VLZA data case are taken from Aleksi´c et al. (2012). The values affecting the telescope energy scale and flux normalisation are labelled “ES” and “FN” correspondingly.
that the telescope’s energy scale is determined with an accuracy of 19% at low energies (∼3 TeV) and 17% at medium ener-gies (∼30 TeV). This is comparable to the MAGIC energy scale systematics estimated from the muon analysis, worsened by the larger uncertainty in the atmosphere transmission due to VLZA conditions. The uncertainty on the reconstructed flux normali-sation (excluding the effect of the energy scale) is 14 and 20%, respectively.