Journal of Physiology (1997),498.1, pp.231-237
The decrease
of maximal
oxygen
consumption during hypoxia
in
man: a mirror image of the
oxygen
equilibrium curve
Guido Ferretti, Christian
Moia,
Jean-Marc Thomet and Bengt
Kayser
Departement de
Physiologie,
Centre Medical
Universitaire,
1rue
Michel
Servet,
1211 Geneve
4, Switzerland
1. Endurance athletes (E) undergo a marked reduction of arterial 02 saturation (Sa02) at maximalexercise innormoxia, which disappears whentheybreathehyperoxic mixtures. In addition, at a given level of hypoxia, the drop in maximal 02 consumption (T42max) is positively related to the individualnormoxic
V02,max.
2. These data suggest that thecurve relating
V02,max
toP1I02
may be steeperand perhapsless curved in E than in sedentary subjects (S) with lowVo2
max values because of the greater hypoxaemia in thelatter, whence thehypothesesthat(i)therelationshipbetweenV02
maxandPI,02
may be set by the shape of the oxygen equilibrium curve; and (ii) the differences between E and S may be dueto the different position onthe oxygen equilibriumcurve onwhich thesesubjects operate. These hypotheses have been testedby performingasystematic comparisonof the
Vo2
maxor5a,02
VS.PI02
relationshipsinE andS.3. Ontensubjects(five SandfiveE),
V02
maxwasmeasuredbystandardprocedure during cyclo-ergometric exercise. Sa°2 wasmeasured by finger-tipinfrared oximetry. Arterialized blood P02(Pa,o2)
andPco2
(Pa,
co2)
were determined in 80#1
blood samples from an ear lobe. The subjectsbreathed ambientair or aN2-02 mixturewithaninspired02fraction(FIj
02)
of 030,
0-18, 016, 013 and 0 11,respectively.V2,maxwasnormalized with respecttothat obtainedat
thehighest F
02.
4. The relationships between
Sao02
ornormalized I2,max
and FIA (orPL02)
had similar shapes, thedataforEbeing systematicallybelow andsignificantlydifferent from those forS.Linear relationships between2ao°
and normalized'42,max,
statisticallyequal between E andS, werefound.
5. We conclude that the relationships between either
V02,max
orSa.O2
and FIA (orPa,o2)
may indeedbe the mirror imagesofoneanother, implyingastrict link between the decreaseofV2,max
inhypoxia and the shape of the oxygen equilibrium curve,ashypothesized.The classical non-linear relationship between maximal oxygen consumption
(V0,
max) and inspired oxygen partial pressure (PI 2)inhypoxia(Cerretelli, 1980; Ward, Milledge & West, 1989; Ferretti, 1990; Cerretelli & Hoppeler, 1996)was established from data obtained on sedentary or non-athleticindividuals, who are characterized by relatively low
,2,max
values in normoxia. In spite of this, its shape was considered independentofthemaximal working capacity or of the maximal normoxic aerobic power of the tested subjects. However, during maximal exercise in normoxia,mostindividuals with high
Vo,max
levels, such as endurance athletes, show an enlarged alveolar to arterial 02 pressure difference, with a subsequent marked reduction of arterial oxygen pressure (Pao2)
and saturation(Sa02)
(Dempsey, Hanson & Henderson, 1984; Williams, Powers & Stuart, 1986; Lawler, Powers & Thompson, 1988; Powers, Lawler, Dempsey, Dodd & Landry, 1989). This condition of hypoxaemia, which might be due either to the very highpulmonary blood flow of these athletes, leading to an insufficient pulmonary capillary transit time for 02 equilibration at the alveolar capillary level(Dempsey et al. 1984), or to amechanical limitation ofpulmonaryventilation (Johnson, Saupe & Dempsey, 1992), disappears onlywhen these subjects are given hyperoxic mixtures to breathe (Dempsey et al.1984;Powers et al.1989).Furthermore,at a given level ofhypoxia, theextentof thedecreasein
Vo,max
was positively related to the individual normoxic
Vo,max
values (Terrados, Mizuno & Andersen, 1985; Young, Cymerman & Burse, 1985; Williams et al. 1986; Lawler
etal.1988).
These data suggestthat therelationship between
V02,max
and PI maydiffer betweensubjects with low andhigh702max
values. In fact the hypoxaemia reported to occur in the latter group of subjects at maximal exercise in normoxiaindicates that anydecreasein
P1I02,
and thusinPa°2,wouldbe accompanied by a greater reduction in arterial oxygen
concentration
((Cao),
and thus inVO
max, in these individuals than in their sedentary counterparts; and this simplybecause their normoxic
Pa02
values are already displacedtowards the steep part of the oxygen equilibrium curve.
This reasoning leads to the formulation of the following
hypotheses: (i) the relationship between
02,max
andPIO2
may be set by the shape of the oxygen equilibrium curve; (ii) this relationship may be steeper and perhaps lesscurved in endurance athletes than in sedentary subjects; and (iii)
thesedifferences may be due to the different position on the oxygen equilibrium curve on which these subjectsoperate.
In the present experiments, we tested these hypothesesby
performing a systematic comparison of the
Vo,max
VS. L02and of the
Sa
°VS.
PI°20
relationships in individuals with high andlowV02,max
in normoxia. Such acomparison, to our knowledge, has not been performed so far.A preliminary report of this study has previously been published (Thomet, Kayser, Moia & Ferretti, 1994).
METHODS
Subjects
The experiments, which were approved by the Ethical Committee of theDepartment of Medicine, University of Geneva, were carried out
on a group of ten healthy young males, which consisted of five sedentary subjects (S; age, 33+9years; height, 1P77+0-06 m; body mass, 73-6+641kg) and five endurance-trained individuals (E; age, 25+7 years; height, 1P76+ 0 04 m; body mass, 66%3+
4.4kg). Before being admitted to the tests, each subject was informed about the procedures to be followed and the potential risks inherent with the experiments, and signed an informed
consentform. Measurements
The oxygen uptake
(Po.)
was measured at rest and at the metabolic steady state of exercises of increasing intensities on the bicycle ergometer. The lowest powers were 50 and 100 W for S and E, respectively. Power wasprogressively increased, initially by stepsof50W, then, as the expected individual maximum power was approached, by steps of 25 W. The duration of exercise at each
work load was 5min. Successive work loads were separated by
5minintervals, during which blood samples (20ul) were obtained from an ear lobe at minutes 1, 3 and 5, for determination of blood lactate concentration
([La]b),
by means of an electro-enzymatic method(ESAT 6661 Lactat, Eppendorf, Germany).Expiredgas wascollected into Douglas bags during the last minute ofeachworkload, and subsequently analysed for gas composition
andvolume. A paramagnetic oxygen analyser (Oxynos1-C,Leybold Haereus, Germany), an infrared CO2 analyser (LB-2, Leybold Haereus) and a dry-gas meter (Singer DTM 15, USA) were used. The
V02
wascomputed by standard procedure. C02output, expired ventilation and the gas exchange ratio (R) were also calculated. Heart rate (fH), measured by electrocardiography (Elmed, ETM, Germany),wasmonitoredcontinuously during the entire protocol.The achievement of individual 02,max was indicated by the appearance of a plateau in the relationship between
V02
and mechanical power. In case such a plateau could not be identified, thefollowingsubsidiary criteria indicated02,
maxattainment: (1) a lack of increase in f, between the two heaviest work loads(AfH<5min-'); (2) R values higher than 11; (3) [La]b values
higherthat 10mm.
At rest andimmediately after the end of thehighestworkload,an 80/41arterialized bloodsamplewasobtained from an earlobe,after having induced localhyperaemiabythe application of an ointment (Trafuril, Ciba Geigy, Switzerland), and immediately analysed (Ciba Corning 280blood gas system, USA)for pH, haemoglobin
concentration ([Hb]),
P<,
° and Paco, Sao,° was continuouslymeasured by finger-tip infrared oximetry (Pulsox-5, Minolta,
Japan). Protocol
The experiments wereperformed at a meanbarometric pressure of
730Torr. Ambient temperature was thermostatedat 20'C. Each
subject underwent six exercise testsfor
V02,max
determination. The first test was always carried out in normoxia (ambient air,PI0°2
=150Torr).
In the othertests,thesubject
breathedinspired oxygen fractions(FI,°)
of0X11,0X13,0X16,0-18 and 030, (PI02,of 80, 95, 116, 131 and 220Torr, respectively), administered in randomorder. Successive experimental sessions on asubject were separatedby at least 2 days, in order to prevent specific trainingeffects. When hypoxic or hyperoxic gas mixtures were used,
inspired gas was provided by high precision gas cylinders and
administered via aDouglas bag, whichwasusedasvolume buffer,
and a hose, through the inspiratory side of the valve. For each
Vo,2max
determination, FN ° wasmeasured next tothe inlet valve. Ten minutes at rest were allowed for equilibration with the gas mixture,before carrying out the test.Data treatmentand statistical analysis
TheVo,,maxvalueswerenormalizedrelativetothe value obtainedat an
FIN,,
of 0 3, set equal to 1. Values are given as means + standarderror of the mean (S.E.M.). The normalized
Vo,2max
values were compared with the correspondingSa°o,
values by a two-tailedStudent's t test for paired observations, the difference being
consideredsignificant if P<0 05.
Comparison ofdatabetweengroupsweremade eitherby analysisof varianceorby analysisofcovariance. A post hoc Bonferroni test
wasused todeterminedifferences between pairs. Whenapplicable,
differences betweenregression lines wereassessed by-analysis of
variance, as described by Kleinbaum, Kupper & Muller (1988).
DifferencesbetweengroupswereconsideredsignificantifP<0-05.
RESULTS
The relationship between iot and power at sub maximal
exercise was linear, invariant among individuals, and
independent of
FI,°2
and of the athletic status of the subjects. A linear regressionon allV0. dataat submaximal exercise yielded aVo2
value of 0 37 + 0 011 W (n= 251,r =0-988, P < 0 001), from which a mean mechanical
efficiencyof exercise of 0-261wasobtained.
Measured and calculated metabolic variables at maximal exercise whilebreathingvarious
FI,
° values, arepresentedin Table 1. The parameters describing blood 02 transport andthe bloodpHdataareshown in Table 2.
At any FI, both absolute (I
minl)
and specific (mlmin-'kg-')
143,max was higher in E than in S. Vo,maxincreased as a function of
F1O,
in both groups. Such anMaximal °2 consumption in hypoxia
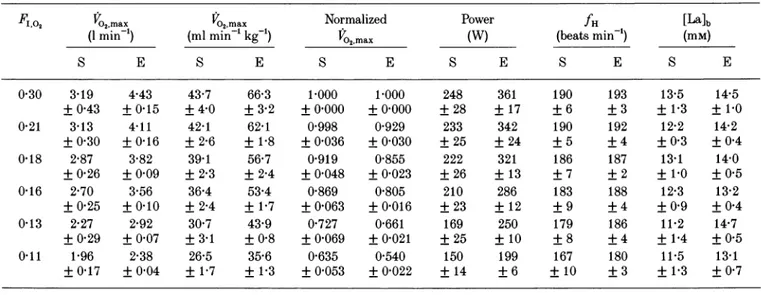
Table 1. Metabolicvariablesatmaximalexercise
FIO,
Vo,,max V02,max Normalized Power fH [La]b(1
min')
(mlmin-'
kg-)
VO2max(W)
(beatsmin-')
(mM)S E S E S E E S E S E 0"30 3-19 4-43 43-7 66"3 1'000 1P000 248 361 190 193 13-5 14'5 +0'43 +0"15 +40 +3-2 +0"000 +0"000 +28 +17 +6 +3 +1"3 +1'0 0-21 3"13 4'11 42"1 62"1 0"998 0"929 233 342 190 192 12"2 14-2 +0'30 +0-16 +2"6 +18 +0"036 +0'030 +25 +24 +5 +4 +0"3 +0"4 0.18 2"87 3"82 39"1 56"7 0"919 0"855 222 321 186 187 13"1 14"0 +0'26 +0"09 +2"3 +2-4 +0"048 +0"023 +26 +13 +7 +2 +1.0 +0'5 0"16 2"70 3-56 36"4 53-4 0"869 0"805 210 286 183 188 12"3 13"2 +0"25 +0"10 +2"4 +1"7 +0"063 +0"016 +23 +12 +9 +4 +0'9 +0"4 0"13 2"27 2-92 30 7 43-9 0"727 0"661 169 250 179 186 11"2 14"7 +0"29 +007 +3-1 +0'8 +0'069 +0'021 +25 +10 +8 +4 +1'4 +0'5 0'11 1'96 2'38 26'5 35'6 0'635 0'540 150 199 167 180 115 13'1 +0'17 +0'04 +1'7 +1'3 +0'053 +0'022 +14 +6 +10 +3 +1'3 +0'7
S, sedentary subjects; E, endurance-trained subjects;
FI,2,
inspired 02 fraction;PO2max,
maximal 02consumption;fH,heart rate;[La]b, blood lactate concentration. Dataaregivenas means +S.E.M.
Table 2.Blood oxygen transport parameters and blood pH data at maximal exercise
F,02 Pa,02
[Hb]
Sa o2
pH(mmHg)
(g
F') _(pH
units)
S A S A S A S A 0'30 128'3+8'5 109'6+6'9 162+3 162 + 2 0'982+ 0'001 0'968+0'003 7'24+0'03 7'16+0'02 0'21 93'0+2'6 82'5+ 3'4 163 + 2 158 + 3 0'958+ 0'0051 0'930+0"010 7'26+0'01 7'15+0'02 0'18 74'3+5'1 69'8+ 3'1 161 + 4 163 + 5 0'940+0'005 0'900+0'013 7'29+0'02 7'19+ 0'03 0'16 59'2+4'3 53'9+3"4 159 + 3 153 + 3 0'876+0'014 0'836+0'020 7'24+ 0'01 7'23+0'02 0'13 48'8+ 2'5 40'6+ 1'1 160+5 162 +5 0'802+0'024 0'668+0'026 7'27+0'02 7'21 +0'02 0'11 35'8+2'1 32'3 +1'0 157 +3 168 + 4 0'662+0'029 0'538+0'022 7-33 +0'03 7"24+0'03S,sedentary subjects; E, endurance-trained subjects; FI,2,inspired02fraction;
Pa,o2,
arterialized oxygenpartial pression; [Hb],bloodhaemoglobin concentration;Sa,02'arterial oxygen saturation;pH, arterialized bloodpH. Dataaregivenasmeans +S.E.M.
1.0
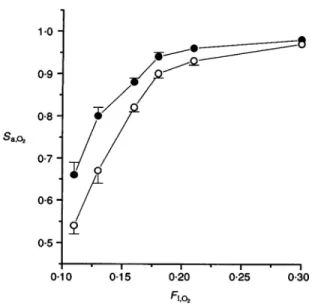
-Figure1.Maximaloxygenconsumptionatvarious inspiredoxygen fractions
V72,max
is maximal oxygenconsumption. The data are normalized withrespecttothevalueobservedatanFI,O,of0'30.FI,,isinspiredoxygenfraction.0,sedentary subjects (S); 0,endurance-trainedsubjects(E).Bars indicateS.E.M.
0*9 -x E
.SS
0-8-a) .N E 0-7-0 z 0-6 0-5 --3 0.10 015 0-20 fi,o2 J. Physiol.498.1 233Figure2.Arterial oxygensaturation atvariousinspired
oxygen fractions
Sao02'
arterialoxygensaturation.0,sedentary subjects(S); 0,endurance-trainedsubjects (E).Barsindicate S.E.M.. . --I
0.15 0 20 025 0 30
F1,A2
so that the two curves tended to converge in hypoxia. In
fact,the
%V2max
ofSwas onaverage23 and 13%lower thanthat of Ein normoxiaand at an
FI,0,
of011, respectively.Similarly, the mechanical power at maximal exercise was
greaterinEthan inS,andit increasedmorein Ethanin S
foragiven rise of
FI02.
Asaconsequence, the meanpowerdifference between thetwogroupsatmaximal exercisewas
100 W in normoxia, but only 50W at the lowest
F1O,.
Maximal [La]bwasindependentofFI
°2,
and did notdiffer significantly between the two groups, despite a tendencytowards higher [La]b values in E than in S. Accordingly, arterialized blood pHatmaximal exercise wassignificantly
lowerinEthaninS(Table 2).
Normalized
%2Vmax
andSa
were plotted as a function ofFI
,02 for both S and E, in Figs 1 and 2, respectively. Bothparameters showed a non-linear increase with
FI02.
Withtheobviousexception ofhyperoxia, bothnormalizedV2,max
(Fig. 1) and
Sa02
(Fig. 2) were systematically higher in S than in E (P<0-05 and P<0{01, respectively). Forbothparameters, the difference became wider as FI °2 was
lowered. Similarly,
Pa,02
increasedwithFI,
02inbothgroups,1*0 co -N 0 .zam E z 09 0-8 0-7 0-6 0-5 000. 0
:
*
< <
0, 0 0 - .0 e l .0l l l 0~~~ ~~~~~'0~~~~~~~and at any
FI,02
it was slightly, although non-significantly,lower in E than in S (Table2).
Therelationships between normalized V02max and
F1I02
werestrikingly similar to those between Sa°2 and F"I°2 Accordingly, no difference was found when normalized
Vo2,max was compared with
8a
02 within each group.Normalized Vo2max was plotted as a function of
Sao,
inFig. 3. The resulting linear relationships for E and S were
not significantly different from each other (P>0-05 for both coincidence andparallelism).
DISCUSSION
The decrease of V02max in acute hypoxia in S, as found in
this study, is in good agreement with previous reports
(Cerretelli, 1980;Wardet al.1989;Ferretti, 1990;Cerretelli & Hoppeler, 1996). The slope of the curve increased with
lowering FI °2. Thecurverelatingnormalized V2M ax toF,A
inE,althoughof thesameshapeasthat forS,wasdisplaced
below that for S. The difference betweenthe twocurveswas
enlarged by hypoxia. Theseresultsagreewith andcomplete
Figure3.Maximaloxygenconsumptionas afunctionof
arterialoxygensaturation
TheVo2maxdataarenormalized withrespecttothevalue
observedatan
FIA2
of 0 30.0and continuousline,sedentarysubjects (S).0and dashedline,endurance-trainedsubjects (E).
Regression equationsare asfollows:sedentary subjects;
y=1059x-0091, n =21,correlation coefficientr=0-871, P<0-0001;endurance-trainedsubjects;y=0 886x+ 0070, n=25, r=0-930,P< 00001. 0-5 06 0-7 saA 0-8 0-9 1-0 1*0 -0-9 -0-8 -07 -06 - 05-0*10 SaA
Maximal 02 consumption in hypoxia previous observations by others, who reported a negative
relationship between individual normoxic Vo2max and the decrease in
V02,max
at one given level of acute hypoxia (Terrados et al. 1985; Lawler et al. 1988). Indeed, this study reports the first systematic comparison ofVo2 max between E andSatseveral levels ofhypoxia.Theobservation that in both groups normalized
V02,max
was not significantly different from Sa°2 suggests that the relationships between eitherVo2,max
orS.02
and FIO, may indeed reflect the same phenomenon, namely the blood oxygen equilibrium curve, those curves being a mirror image of this. If it is so, the relationships between normalizedI02max
and Sa0°2 for E and S must not only be linear, as already reported for S (Stenberg Ekblom & Messin, 1966; Squires & Buskirk, 1982), but also equal. This was indeed the case, as indicated by a comparison of the lines showninFig. 3.The present results appear thus to support the tested hypothesis that the the shape of the relationship between V02,max and PIO2 (or F1I02) is imposed by the shape of the
oxygen equilibrium curve. The slope of the
VO2,max
VS.PL02
relationship, which is equal to the overall conductance to oxygen flow, increases as
PI02
drops. This obviouslyimplies thatanincrease inconductance (or decrease of its reciprocal, theresistance) at some site along the oxygen transfer system must occur in hypoxia. The cardiovascular conductance to oxygen flow (GQ) may be responsible for such a change, as a consequence of the sigmoid shape of the oxygen equilibrium curve(Piiper & Scheid, 1981; Ferretti & di Prampero, 1995). In factGQis the product ofcardiac output times the oxygen transport coefficient of blood(fib).
The latter, which isequalto:
flb
=(CaO2
-Cvo02)
(Pa,02 Vj4,02)
where
Ca0o2
C402,
0Pa02
andPV402
aretheconcentrations(C)
orthepartial pressures (P) of oxygen in arterial (a) or mixed venous (vi)blood, is nothing but the mean slope of the oxygen equilibrium curve. In hypoxia, the decrease in
PL02'
and thus inPa°02
is not accompanied by a corresponding decrease inCa02
until the steep quasi-linear part of the oxygenequilibrium curve is attained. According to eqn (1), thisimplies anincreaseinfib,
and thus in GQ, inmoderate hypoxia. Of course the same reasoning would apply to hyperoxia: in fact even a marked increase inPL02
can induce only small changes ino02,max
(Bannister & Cunningham, 1954; Margaria, Cerretelli, Marchi & Rossi, 1961; Margaria, Camporesi, Aghemo & Sassi, 1972; Fagraeus, Karlsson, Linnarsson & Saltin, 1973; Welch & Pedersen, 1981), becausePa02
is on the flat part of the oxygen equilibrium curve, so thatCao2
cannot increase, with consequent decrease in,fb,
and thus in GQ.In this context, based on blood oxygenation and
Pa,
endurance athletes, with elevated individual
P02
maxvalues, and with a reducedSa
at maximal exercise in normoxia(Dempsey et al. 1984; Williams et al. 1986; Powers et al. 1989), undergoagreaterdecrease of
%V2
maxin hypoxia than sedentary individuals, because they have only small marginsforincreasing GQinhypoxia, asthey operate on adifferentpositionontheoxygenequilibrium curvefrom the
non-athleticsubjects. Their normoxic
Pa
02
valuesarein fact alreadynearthesteep partof thiscurve, sothat the overallresistance tooxygenflowcannotdecrease inEasmuchasin S, and the oxygen transfer system of the former tends toward 'linearity'. As a consequence, the
T02max
of E in hypoxiacannotbe maintainedelevated inspiteof thedrops ofPL02
andPa
02,
as occursin S. Furthermore, at maximal exercise, the physiological oxygen equilibrium curve of E might have beendisplacedto therightwithrespecttothat forS.This issuggested bythe lowerpHin the former thanin the latter group, and may have further contributed to arterialoxygen desaturationand to the'linearization' of the
Vo2,max
decreaseinhypoxia observedinE.The precedingargument relies on the assumption that the
maximal cardiac output is unchanged in hypoxia with
respect to normoxia. This assumptionhasgot experimental support in acutenormobaric hypoxia (Stenberg et al.1966; Hartley, Vogel & Landowne, 1973; Ekblom, Huot, Stein &
Thorstensson, 1975), which is the condition prevailing in
the present study, but not in chronic hypobaric hypoxia, suchasafteraltitude acclimatization(Pugh, 1964; Cerretelli, 1976).Inthe latter case maximal cardiacoutputisreduced,
so that the decrease of
o02,max
in hypoxia may be greater than thatofSa
°2 assuggested byWest et al.(1983), eventhough the shape of the oxygen equilibrium curve may determine the non-linear decrease of
V02 maX
also in chronichypobaric hypoxia. Thisissuggested bythe observationof a
greater decrease in
02,max
in athletic than in non-athleticindividuals also in this condition (Young et al. 1985). However, the shape of the V2 max VS. PI relationship in
chronic hypobaric hypoxia is almost identical to that in acutenormobaric hypoxia(Cerretelli, 1980; Ferretti, 1990; Cerretelli &Hoppeler, 1996), inapparentcontrast with the
preceding argument. This may be the result ofventilatory acclimatization in chronic hypoxia (Rahn & Otis, 1949; West, 1988), which maycounteract the negative effectson
o2,max
of a lower cardiac output at maximal exercise.Indeed the role ofventilatoryresistances tooxygenflow in
limiting VO2 max appears to increase in hypoxia (Ferretti & diPrampero, 1995).
The present results have some practical implications for extreme human performances. After the top of Mount Everest wasreached for thefirsttimewithoutsupplementary oxygen, itwasassumed that this had beenpossiblebecause the climbers hadanextremely highV2max However,this is not so (West et al. 1983; Oelz et al. 1986). The present results demonstrate that very high
Vf2,max
values innormoxia are not required for extreme altitude climbing,
since this would be accompanied by a
relatively
great decrease of402,max
in hypoxia. Bythe same token, on theassumption that the decrease of
T02
maxinhypoxiawouldbethe same in E as in 8, it was predicted that the optimal altitude for top performances in cycling would be 3600 m
(di Prampero, Cortili, Mognoni & Saibene, 1979). This
prediction was never confirmed by actual athletic performances. The two athletes, who established world records at sea level and at altitude in comparable technical conditions, obtained worse performances at altitude than
previously predicted, in good agreement with the present results.
The results ofthis study have no direct implications with regard to
V02
max limitation. They provide a possibleexplanationfor theshape of therelationshipbetween
V02,max
and FIA0
orP102,
independent ofthe interrelations among the various in-series resistances which set out the fractionallimitation of
V02,max
at any given FI 2. What is relevant in the present context is that the intrinsic variability of thecardiovascular conductance to oxygen flow is sufficient to
explain how Vo2max varies in hypoxia or in hyperoxia. In
ordertoperformaquantitativeanalysis ofthefactorswhich
limit
V02
maxinthe differentconditions tested inthis study, one shouldinduce, at any given constantP102,
independent variations in one specific resistance/conductance and thendescribe the ensuing changes in
V02,max
(Ferretti & diPrampero, 1995). This was not done in the present experiments.
In conclusion, the results ofthisstudy are compatible with the hypothesis that the relationship between Vo2max and
P102isafaithful reflection of the oxygen equilibrium curve. This being the case, the decrease of Vo2max in hypoxia is greater in endurance athletes than in non-athletic subjects,
because they operate on different positions on the oxygen
equilibriumcurve,the
Sao
2atmaximalexercise innormoxiaand atanylevel ofhypoxia being lowerin theformer than inthe lattergroup.
BANNISTER, R. G. & CUNNINGHAM, D. J. C. (1954). The effects on respiration and performance during exercise of adding oxygen to theinspired air.Journialof Physiology 125, 1 18-137.
CERRETELLI, P. (1976). Limiting factors to oxygen transport on
MountEverest. JournalofApplied Physiology 40, 658-667.
CERRETELLI, P. (1980). Gasexchange at altitude. In Pulmonary Gas Exchange. II. Organism and Environment, ed. WVEST, J. B., pp.97-147.Academic Press, New York.
CERRETELLI, P. &HOPPELER, H. (1996). Morplhologicand metabolic responses tochronic hypoxia: the muscle system. In Handbook of Physiology, section 4,EniviroiinmentalPhysiology, vol.II, ed.FRECGLY,
Ml. ,J. &BLATTEIS, C. M1., pp. 1155-1181. OxfordUniversity Press, NewYork.
DEMPSEY, J. A., HANSON, P. G. & HENDERSON, K. S.(1984). Exercise induced arterial hypoxaemiainhealthy human subjects at sea level. Journal of Physiology 355, 161-175.
DIPRAMPERO, P. E., CORTILI,G., MOGNONI, P. & SAIBENE, F.(1979).
Equation of motion of acyclist.Journal of AppliedPhysiology 47, 201-206.
EKBLOM,B., HUOT, R., STEIN, E. M. & THORSTENSSON, A. T.(1975).
Effect ofchanges in arterial oxygen content on circulation and physicalperformance. Journal of Applied Physiology 39, 71-75. FAGRAEUS, L., KARLSSON, J., LINNARSSON, D. &SALTIN, B. (1973).
Oxygen uptake during maximal workatlowered and raised ambient airpressure.Acta.Physiologica Scandinavica 87, 411-421.
FERRETTI, G. (1990). On maximal oxygen consumption in hypoxic
humans. Experientia 46, 1188-1194.
FERRETTI,G. & DI PRAMPERO, P. E. (1995).Factors limiting maximal 02 consumption: effects of acute changes in ventilation.Respiration Physiology 99, 259-271.
HARTLEY, L. H., VOGEL, J. A. & LANDOWNE, M. (1973). Central, femoral and brachial circulationduringexerciseinhypoxia. Journal of AppliedPhysiology 34,87-90.
JOHNSON, B. D.,SAUPE, K. WV. & DEMPSEY, J. A. (1992). Mechanical constraintsonexercisehyperpnea in endurance athletes. Journal of AppliedPhysiology 73, 874-886.
KLEINBAUM, D.G., KUPPER, L. L. & MULLER, K. E. (1988). Applied Regression Analysis and Other Mlultivariate Methods. PWS-Kent, Boston.
LAWLER, J., POWERS, S. K. & THOMPSON, D. (1988). Linear relationship between
VO2max
and VO max decrement during exposure to acute h-ypoxia. Journal of Applied Physiology 64, 1486-1492.AIARGARIA, R.,CAMPORESI, E., AGHEMO, P. & SASSI, G. (1972). The effect of02 breathing on maximal aerobic power. Pfliigers Archiv
336,225-235.
MARGARIA, R., CERRETELLI, P., MARCHI, S. & RossI, L. (1961). Maximum exercise in oxygen. Internationale Zeitschrift fur angewandtePhysiologie 18, 465-467.
OELZ, O., HOWALD, H., DI PRAMPERO, P. E., HOPPELER, H., CLAASSEN, H., JENNI, R., BUHLMANN, A., FERRETTI, G.,
BR,CKNER, J.-C.,VEICSTEINAS, A., GUSSONI,M. &CERRETELLI, P. (1986). Physiological profile of world class high-altitude climbers. Journal of Applied Physiology 60,1734-1742.
PIIPER, J. & SCHEID, P. (1981). Model for capillary-alveolar equilibration with special reference to 02 uptake in hypoxia. RespirationPhysiology 46, 193-208.
POWERS, S. K.,LAWLER, J., DEMPSEY, J.A., DODD,S. &LANDRY,G. (1989). Effects ofincomplete pulmonary gasexchangeon Vo2max Journalof Applied Physiology 66,2491-2495.
PUGH, L. G. C. E. (1964). Cardiac output in maximal exercise at
5,800m(19,000ft).Journalof Applied Physiology 19,441-447.
RAHN, H. &OTIS,A. B.(1949).Man'srespiratory responseduringand after acclimatization to high altitude. American Journal of Physiology 157, 445-449.
SQUIRES, R. WV. &BUSKIRK, E. R. (1982). Aerobiccapacity during
acuteexposuretosimulated altitude, 914 to2286meters. Mledicine andScience inSportsand Exercise 14,36-40.
STENBERG, J., EKBLOM, B. & MESSIN, R. (1966). Hemodynamic
responsetoworkatsimulatedaltitude, 4,000 m. Journal of Applied Physiology21, 1589-1594.
TERRADOS, N., MIZUNO, M. & ANDERSEN, H. (1985). Reduction in
maximal oxygenuptakeatlowaltitudes;role oftrainingstatusand lung function. ClinicalPhysiology5,suppl.3, 75-79.
THOMET, J. M., KAYSER, B., MOIA, C. & FERRETTI, G. (1994). The
declineof maximal oxygenconsumptioninhypoxia:amirrorimage
of the oxygen dissociation curve. Journal of Physiology 475.P, l19P
Maximal
02
consumtption
in hypoxiaWARD, M. P., MILLEDGE, J. S. & WVEST, J. B. (1989). In High Altitude Mledicine and Physiology, chap. 13, pp. 241-261. Chapman & Hall, London.
B\ELCH, H. G. & PEDERSEN, P. K. (1981).Measurement of metal)olic rate inhvperoxia.Jourtnal of Applied Physiology 51, 725-731. WEST, J. B. (1988). Rate of ventilatory acclimatization to extreme
altitude. Respiration Physiology 74, 323-333.
WEST, J. B., BOYER, S. J., GRABER, D. J., HACKETT, P. H., AIARET, K.H., AIILLEDGE, J. S., PETERS, R. M.JR, PIZZO, C. J.,SAMAJA,Al., SARNQUIST, F. H., SCHOENE, R. B. & WINSLOW, R. AM. (1983).
MIaximalexercise at extreme altitude on Alount Everest. Journal of Applied Physiology 55, 688-698.
WILLIAMS, J., POWERS, S. & STUART, AM. (1986). Hemoglobin desaturation in highly trained subjects during heavy exercise.
MledicineandScientce inSportsanidExercise 18, 168-173.
YOUNG, A. J., CYMERMAN, A. & BURSE, R. L. (1985). The influence of cardiorespiratory fitness on the decrement in maximal aerobic
powerathigh altitude. EuropeanJournal ofAppliedPhysiology54, 12-15.
Acknowledgements
This study wassupported by a grant from the Federal School of
Sport Sciences, Macolin,Swvitzerland.
Author's emailaddress
G.Ferretti: [email protected]
Received 28Mlarch 1996; accepted 30September 1996.