Università degli Studi di Salerno
DIPARTIMENTO DI SCIENZE ECONOMICHE E STATISTICHE
Rosamaria D’Amore*, Roberto Iorio**1
Internal and external sources of
innovation in the Italian biotech sector
WORKING PAPER 3.206
* IRAT-CNR Napoli; Department of Economic and Statistical Sciences (DISES) University of Salerno
** Department of Economic and Statistical Sciences (DISES) University of
Salerno
1
Corresponding author.
e-mail: [email protected], office tel. 089-963174; phone cell.: 333-5770138
Note of the authors: this paper is the result of a strict collaboration among the authors. Nevertheless,
the parr. 1 and 2 may be mainly attributed to Rosamaria D’Amore; as regards the empirical analysis, the creation and submission of the questionnaire, the imputation of data deriving from the answers must be attributed exclusively to Rosamaria D’Amore (see par. 3.1); the analysis of the data (par. 3.2) could be attributed mainly to Roberto Iorio; the conclusion has been jointly written.
Indice
Abstract...3
1. Introduction and definitions...5
2. Internal and external firm resources and innovation: a literature review.7 3. The empirical analysis ...10
3.1 The survey and the sample...10
3.2 The results of the analysis...11
4. Conclusion ...15
Abstract
A common view among many academics and policy makers is that biotech offers enormous opportunities for improving competitiveness and economic growth. For this reason there is a growing need to set up appropriate policy to improve the adoption and diffusion of biotech innovation. Nevertheless, there are many interpretative problems about the identification of the biotech firms, due to the uncertainty about the border of the sector itself. This paper provides a contribution to better define and understand the biotech industry, pointing out the differences inside the sector and the different behaviour of the firms according to their typology. In fact this paper, basing on a previous work of classification of the Italian biotech firms according to the OECD standards, uses such a classification in order to better understand the different importance, inside the biotech sector, of the internal and external sources of knowledge, in the production of innovation. Our hypothesis is, in fact, that the relation between internal and external source, on one side, and innovation, on the other side, has different characteristics if we distinguish between the different classes in which the production activities are divided, according to the OECD classification. We try to test this hypothesis trough the analysis of the data coming from a questionnaire we submitted to several Italian biotech firms.
Key words: Biotech innovation, Italian biotech industry, Sources of
innovation, Knowledge-based Economy, Policy indicators.
JEL: L2, O31. Introduction and definitions
Biotechnology is acknowledged as a key technology nowadays. It is both a broad emerging technological area and a specific activity. One of the main cause of the innovation is the uncertain, market, and complex processes involving knowledge that generates a pattern of change in industry structure and evolution.
One of the main characteristic is its multidisciplinary. Its definition covers a broad range of knowledge fields. Therefore, there are many different definitions existing in the literature and different are the definitions of sector ranging from reports published by internationally influential bodies, such as OECD, OTA, BIO, et alia, where the different point of view is based on the diversity in interpretation, measurement and policy ideas. In general, the most frequently used definition is the OECD definition (OECD, 1989): “Biotechnology consists in the use of scientific and engineering principles (based on microbiology, genetic, biochemistry, chemical and biochemical engineering) to transform materials using biological agents (such as micro organism, enzyme, animal or vegetable cells) with the purpose to obtain good and service”.
The OECD Statistical Framework for Biotechnology (2001) also defined biotech activities identifying six classes. The first distinction is between production and service activities. Then, among production activities, it distinguish between active, innovative and dedicated biotech, firms in order to identify those activities more or less focused on biotech. In particular, a biotechnologically active firm (BAF) is defined as a firm engaged in key biotechnology activities, such as the application of at least one biotech technique to produce goods or services and/or the performance of biotechnology R&D. A dedicated biotech firm (DBF) is a BAF whose
predominant activity involves the application of biotech techniques to
produce good or services and/or the performance of biotech R&D. An innovative biotech firm (IBF) is defined as a BAF that applies biotech techniques for the purpose of implementing new products or processes.
Among service activities, it distinguishes R&D, market and other service oriented firms. In particular, a Biotechnology R&D firm with no product sales is classified by Italian national statistical offices into the R&D service industry category. Targeted firms include firms classified as wholesalers, for instance local operations of large foreign pharmaceutical firms, whose local affiliate performs biotechnology research but acts mainly by a wholesale distributor. Other types of services firms are
included if they are using biotech techniques for the purpose of providing a services (for example waste management and environmental remediation firms).
Table 1 sums up this classification
Table 1: Biotech firm typologies in OECD taxonomy • Biotechnology active firm (BAF)
• Innovative biotechnology firm (IBF)
• Dedicated biotechnology firm (DBF)
Production
• Biotechnology R&D firm • Targeted firm
• Other service firm Services
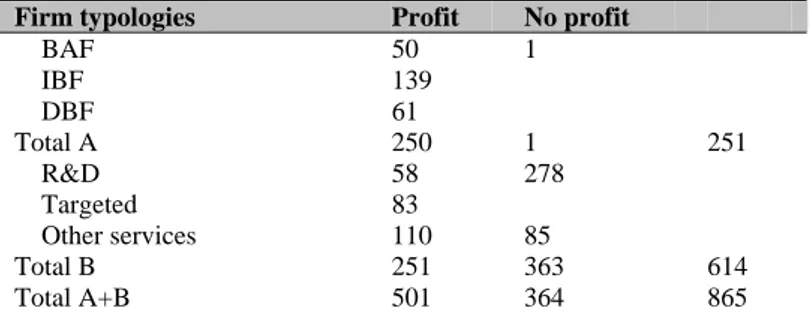
Source: OECD Statistical Framework for Biotechnology (2001) D’Amore and Vittoria (2005) identified 995 Italian biotech firms and were able to classify 865 of them according to OECD classification. Table 2 shows the results of this classification:
Tab. 2 Italian biotech firm distribution (OECD typologies), 2005
Our aim is to analyse the relation existing between internal and external resources, on one side, and the innovation output on the other side: our hypothesis is that this relation has different characteristics if we distinguish between the three classes in which the production activities are divided, according to the above discussed OECD classification: BAF, IBF and DBF.
In the paragraph 2 we report some bibliographic references about the relation we want to investigate: from this theoretical and mostly empirical review, it should be concluded that those relations are unclear.
Firm typologies Profit No profit
BAF 50 1 IBF 139 DBF 61 Total A 250 1 251 R&D 58 278 Targeted 83 Other services 110 85 Total B 251 363 614 Total A+B 501 364 865
Our idea is therefore that it is possible to shed some light on this relations if we operate the distinction among the different classes of activities.
In order to empirically investigate this theme we sent a questionnaire to the 250 Italian biotech firms classified in the production activity category; the results coming from the analysis of the questionnaires we received are shown in the paragraph 3.
Some final considerations conclude the paper.
2. Internal and external firm resources and innovation: a literature review
Innovation is critical for firm sustainability in the biotechnology industry. The innovation process (Dosi 1988) is the result of complex activity and it requires a combination of several elements, internal and external to the firm: indeed, it is important to consider not only the organizational and managerial capabilities of individual companies, their investment or the size of the firm, but it is important to consider also a series of external elements, such as the collaboration with other firms or with universities that can improve the internal activity. In addition, Oerlemans et. al., (2001) and Freel (2003) demonstrated the importance of internal and external resources in the innovation process, stressing the positive relation between investments in R&D, collaborations and knowledge diffusion. In the case of Italy (Piga and Vivarelli, 2003) demonstrated that external resources have a positive influence on the choice to make R&D.
According to Coombs and Deeds (2000) the biotech industry is characterized by its creativity in structuring strategic alliance, so the strategic alliance and other forms of collaborative agreements among biotechnology firms, larger industrial companies and universities are methods used to achieve innovation. A common strand all over the literature on firm strategy and performance is the diffuse utilization of strategic alliances or collaboration at all steps of the innovation process to accelerate innovative activities (Audretsch, 2001; Bagchi-Sen 2004; Terziovsky and Morgan, 2006). In this way firms can improve their competitiveness position by integrating technology in the innovation process and facilitating intra and inter firm knowledge and technology transfer (Amir-Aslani and Negassi, 2006; Boer et al, 2001).
Lastly it was analyzed the way to combine resources to achieve innovation as the key of determinants of successful innovation efforts in biotechnology. For example, Deeds and Hill (1996), Freeman (1991), Hagedoorn (1995) analyzed the topic of the relation between firm’s rate of new product development and the number of strategic alliances and they concluded that higher levels of expenditures in R&D and technological cleverness are positively correlated with higher levels of collaboration. Internal capability and external collaboration have been found to be complements rather than substitutes (Arora and Gambardella 1994; Pisano et al, 1988; Rothaemel, 2001). In particular, Pisano at al., (1988) it studied the relationship between in-house R&D and collaboration and they found the two to be complementary, as in-house R&D capability attracts collaborative partners. Shan et al., (1994) examined the relationship between the number of collaborators and innovative output. They conclude that, while collaboration advances innovation, innovation does not necessarily require collaboration, that larger firms produce more innovative output and that public firms collaborate more than privately held firms. According to Arora and Gambardella (1994), Nambisan (2002) and Rothaermel (2001) companies with strong internal research capabilities are more likely to collaborate, because they can bring skills and technologies to the table, making them desiderable collaborative partners. In conclusion Hall et al., (2007) demonstrated that innovation performance is a function of firm-level characteristics (e.g. R&D intensity), as well as specific innovation strategies depend on the stages of innovation firms focus on. They also conclude that there is a strong relationships among R&D, innovation and performance in the US Biotechnology industry.
R&D expenditure drives research based innovation, collaboration is a strategy for advancing innovation by providing the complementary assets and technologies firms need to achieve success. Firm size, measured in term of employment, financial and technological resources, plays an important role in the firm’s potential to innovate. The comparison between large and small firms in the innovation process has been the subject of a long debate. If Schumpeter (1942) argued that innovation activity is promoted by large firms on a large scale, Jexkes, Sawers and Stillerman (1958) demonstrated that most inventions arose from individuals or small groups. Mueller (1962), with his analysis on the Du Pont’s 25 most important innovations, showed that the major part of these innovations originated from smaller firm or individual and they were not internal to DU Pont. His conclusion was that DU Pont has been more successful in making
product and process improvement than in discovering new products. The following literature (such as Arrow, 1983; Scherer and Ross, 1990; Christensen, 1997; Giarratana, 2004; Levinthal and March, 1993) hypothesized that large firms have comparative advantages in large-scale development and commercialization of innovation, instead smaller firms are better suited for more exploratory and inventive research.
This assumption was confirmed by the empirical literature on innovation. For example, Acs and Audtretsch, (1990) demonstrated that R&D expenditure grow proportionally with the firm size, but the number of innovation increase less then proportionally. According to Damanpour (1992) a smaller firm might be more, because it would be expected to be more flexible and therefore to be able to accept and effect the change then in a large firm, where there is more difficulty in communication and coordination of R&D. Another important aspect is that in the small firms the motivation is greater than in a large firm because, for example, there is a visible impact on the firm’s overall performance (Kamien and Schwartz,1982). Anyway, in general, the literature about firm size and innovative or inventive outputs shows mixed results. Other researches (for example Bound et al., 1984) demonstrated that the number of patents increases at a rate that is less than proportional to firm size and other authors; Acs and Audretsch (1987, 1991), confirm the same results using the number of innovation as output variable; others authors like Halperin and Chakrabarti,(1987) use of number of scientific publications. But there is another current of literature, for example Henderson and Cockburn (1996), Mansfiel,(1980) that showed that larger firms have in some cases an advantage in innovation.
According to Hall at al., (2007), in order to analyze the associations among R&D intensity at the firm level, innovation performance, and the factors that influence innovation strategies in firm, it is necessary to analyze the nature of the relationships between R&D intensity and innovation performance in firms.
In particular they demonstrated that there is a positive correlation between R&D intensity and the number of domestic and international patent applications field and with domestic and international patent approval received. On the other hand, when they analyzed the relationships between R&D spending and production-based innovation, the results indicated that R&D intensity and the number of new production introduction are negatively correlated. These results make sense
theoretically as it has been shown that a life cycle pattern exists in the innovation process in biotechnology and other industries.
3. The empirical analysis
3.1 The survey and the sample
Our empirical analysis is based on the results of a survey about the firms belonging to the class of production activities in the biotech sector.
A questionnaire has been sent by e-mail, answering several qualitative and quantitative data about the characteristics and the innovative activity of the firms. We describe here the only information we used for this paper.
Type of Biotechnology identifies in which sector of biotech the firm
operates;
Size of the firm: number of employees in the year period 2000- 2005; R&D expenditure in the period 2000-2005;
Innovation process or product: how many innovations of product or
process the firm introduced in the period 2000-2005;
External collaborations: we asked if the firm collaborated with other
partners to realize research projects and/or technical development. In particular it was asked if they have collaborations with: Italian firms, foreign firms, private research centre, Italian universities, foreign universities, public research centres, other public institutions, consulting firms, firms with experience in the biotech sector.
It was not asked the frequency of collaboration, but only if the collaboration took place or not. Therefore the answer was codified as a dummy variable.
The biotech firms belonging to the class of production activities, that are the object of our analysis, are divided into BAF, IBF and DBF. As we have illustrated in Table 2, according to D’Amore and Vittoria (2005) each group included, respectively, 50, 139 and 61 firms (total 250) .
The questionnaire has been sent to all such firms.
The number of the firms that answered to the questionnaire is just 21 out of 250: 8 of them are dedicated firms (DBF) and 13 are innovative firms (IBF). So in this analysis there aren’t firms belonging to the active group (BAF). So, it is important to note that the results of the analysis is referred
just to a little sample of the total number of the firms belonging to the class of production activities of the Italian biotechnology industry. Indeed, it is hard to extend these results to the general context.
Regarding the period of our analysis, we considered just 2005, because it is the only year we received completed answers.
3.2 The results of the analysis
As said before, our aim is to observe the link between internal and external resource of the firm and its innovation capacity. In our empirical analysis we considered the following variables: the total number of innovation as a measure of the innovation activities, the R&D expenditure as a measure of internal resources, the collaboration with other partners as a measure of external resources and the number of employers to control for the firm size. We considered these value in a single year, 2005, because of the low number of observations in the other years.
Before analysing such relationships we compared the mean values of the considered variables in the two groups, IBF and DBF, in order to point out the different characteristics of the two classes of firms (we called this one “comparison analysis”).
a) The comparison analysis between groups
The comparison analysis among the magnitude of the variables considered in the analysis, within the two groups, IBF and DBF, shows that the DBF introduce more innovation than IBF, even if the last group has more R&D expenditure. This result is consistent with the characteristics of the firms: in fact dedicated firms introduce more innovations because their activity is focused on innovation; on the other hand the innovative firms leave some room for a more basic research, so they tend to spend great amount of money in R&D.
Regarding the size of the firm, dedicated firms are on average bigger than innovative, but the difference is not relevant.
Finally, as regards collaboration, the frequencies of collaboration is the same in both groups, like the actors with they have relations.1
1 It may be interesting to report here another information emerging from the questionnaire: the
distribution of time and resources among four different type of research activities, that are basic research, applied research, experimental development and industrial development, is almost the same in the two groups of firms.
a) The analysis of the correlations
In order to analyse the relationships we are interested in, we conducted a bivariate correlation analysis. The limited number of the observations advised us against conducting a multivariate analysis. We analysed the correlations by couples of variables; more precisely, we considered the following relations:
1) between size and other variables (size and R&D expenditure; size and collaborations; size and innovation);
2) between internal and external input of the research (R&D expenditure and external collaborations);
3) between inputs and outputs of the research (R&D expenditure and number of innovations; external collaborations and number of innovations).
We analysed such correlations both in the whole sample and in the two groups of firms separately. In the following section we show and comment the results.
1a) Size and R&D expenditure
The result of this correlation is the same in the two groups of firms (IBF and DBF) and for the whole sample. In fact there is a positive correlation between R&D expenditure and size in every group of firms.
Tab. 1 Correlation between size and R&D expenditure
Source: our elaboration on RP Biotech Data Base
1b)Size and external collaborations
In this case there is a strong
correlation between the two variables in the innovative class, but not in the whole sample and in the dedicated class.
R&D expenditure and Size
Whole sample IBF DBF
0.816** 0.942** 0.981** ** correlation is significant at the 0.01 level
Tab.2. Collaboration and size of the firm (only significant correlations are reported)
Source: our elaboration on RP Biotech Data Base
1c) Size and number of innovations
There is a positive but not significant correlation between the number of innovation and the size of the firms, both in the whole sample and in the single groups.
Tab.3 Correlation between number of innovations and size of the firm
Source: our elaboration on RP Biotech Data Base
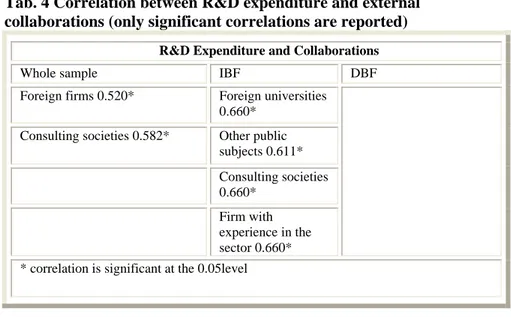
2a) R&D expenditure and external collaborations
In the whole sample there is a positive and significant correlation between R&D expenditure and the collaboration with foreign firms and consulting society; there are no significant correlations between R&D expenditure and other forms of external collaborations. In the single groups the results are different. In fact the dedicated firms do not show significant correlations between R&D and any kind of collaboration; on the other hand, the innovative firms present a positive and significant correlation
Whole sample IBF DBF
Consulting society 0.700* Firm with experience in the sector 0.700*
Foreign University
0.595* *correlation is significant at the 0.05level
Number of innovations and Size of the firm
Whole sample IBF DBF
between R&D expenditure and several kinds of collaboration, precisely with foreign firms, foreign universities, other publics institutions, consulting society and firms with experience in the sector.
Tab. 4 Correlation between R&D expenditure and external collaborations (only significant correlations are reported)
R&D Expenditure and Collaborations
Whole sample IBF DBF
Foreign firms 0.520* Foreign universities 0.660*
Consulting societies 0.582* Other public subjects 0.611* Consulting societies 0.660* Firm with experience in the sector 0.660* * correlation is significant at the 0.05level
Source: our elaboration on RP Biotech Data Base
3a) R&D expenditure and number of innovations
There is a positive but not significant correlation between R&D and number of innovations in the whole sample. There is the same evidence also into two subgroups with a little difference: in the innovative group the correlation is stronger than in the active group .
Tab. 5 Correlation between R&D expenditure and number of innovations
Source: our elaboration on RP Biotech Data Base
R&D expenditure and number of innovations
Whole sample IBF DBF
3b )External collaborations and number of innovations
In the whole sample there is no significant correlation between the number of innovation and any kind of collaboration.
In the single groups, instead, there are some significant correlations, even if there are some differences.
The innovative firms present a positive and significant correlation between the number of innovation and some kinds of collaborations: with public research centres, others public institutions, consulting society and firm with experiences in the biotech sector.
Also in the case of dedicated firms there is a positive correlation between the number of innovation and some kind of collaborations, but in this case only with others public institutions and with firms with experience in the sector.
As we can see, the merge of two group causes waste of the correlation between the variables.
Tab.6 Correlation between external collaborations and number of innovations (only significant correlations are reported)
Source: our elaboration on RP Biotech Data Base
4. Conclusion
The results of our surveys, even based on a limited number of cases, may be useful to bring a contribution to the analysis of the utilization by the firm of internal and external sources of innovation.
Number of innovations and collaborations
Whole sample IBF DBF
Public research office 0.873**
Other public subject 0.829* Other public subject
0.837**
Firm with experience in the sector 0.829*
Firm with experience in the sector 0.598*
* correlation is significant at the 0.05 level ** correlation is significant at the 0.01 level
First of all, it is interesting to consider the role of firm size in the use of internal and external sources: while there is a clear relationship between size and the amount of R&D expenditure, the relationship between size and external collaboration do not emerge so clearly: it seems that external collaborations are a source of innovation that is easily accessible also to small firms. In an analysis focused on internal and external sources of innovation, it is not possible not to take into consideration the problem if the two kind of resources are complementary or substitute. The answer emerging from our survey is more oriented toward the complementarity, as we observe some positive correlations between R&D expenditure and external collaborations, even if they are not extended to the whole sample and not to all kinds of collaborations; anyway, no clear signs of substitution emerge.
Another interesting result is the importance of the external sources of knowledge for the innovation: while in our sample a clear relationship between R&D expenditure and number of innovation do not emerge, a significant correlation exists between some kinds of external collaborations and the innovative performance. Observing more in detail the specific forms of collaborations that our analysis reveals as useful to favour the innovation, it is interesting to underline the relevance of collaboration with firms with experience in the sector but also with the public sector, even it is surprising that public research offices and other public subjects are cited, but not university.
Beyond the possible interest of such results, that can be included in the stream of the theoretical and empirical literature on these topics, that we previously reviewed, and that are in fact generally consistent with the more frequent results of such studies, the more original contribution of this paper is probably the analysis of the mentioned relationships in different kinds of firms, much less frequent in the existing literature. Our analysis, focused on the biotech sector, underlined that in those firms that have the introduction of new products as their specific goals, the level of complementarity between internal and external resource is particularly strong and stronger is the importance of the external collaborations to produce innovations.
Our analysis was conducted inside one specific sector, the biotech one, and, because of the limited dimension of our sample, we could take into consideration only two kinds of firms (innovative an dedicated), classified according to their specific activity. But the relevant differences observed between the two groups, let us to formulate, more than a conclusion, an hypothesis that should be verified in more extended studies: if the aim is to analyse in depth the complex relationships between the internal
characteristics of the firms, the different inputs of the research and the output of the resource, we have to take explicitly into consideration the specific activities of the firms; in other words, from our analysis inside a sector whose borders are blurring, probably a more general conclusion derives: it may be possible that the usual classification by productive sector is not enough, but it is needed to go more in depth.
References
Acs Z.J., Audretsch D.B. 1987. “Innovation, Market Structure, and Firm Size”. The Review of Economics and Statistics,69,(4): 567-574.
Acs Z.J., Audtretsch D.B. 1990. Innovation and Small firms, Cambridge MA.MIT Press.
Acs Z.J., Audtretsch D.B 1991. "R&D, Firm Size and Innovative Activity", in Z.J. Acs and D.B. Audretsch (eds), Innovation and Technological
Change. An International Comparison, Ann Arbor: University of Michican
Press.
Amir-Aslani A., Negassi, S. 2006. “Is technology integration the solution to biotechnology’s low research and development productivity?”
Technovation 26: 573-582.
Arora A., Gambardella A. 1994. “Evaluating technological information and utilizing it”. Journal of economics Behaviour and Organization, 2: 91-114.
Arrow K.J., 1983. “Innovation in large and small firms” Entrepreneurship:
Price Institute for Entrepreneurial Studies, ed. J Ronen: 15–27. Lexington,
MA: Lexington.
Boer H, et al. 2001.“Knowledge and continuous innovation. The CIMA methodology”. International Journal of Operations & Production
Management, 8 (3/4): 243-260.
Bound J., et al. 1984. “Who does R&D and who patents?” in Griliches Z. (ed.), “R&D, Patents and Productivity”. University of Chicago Press: Chicago.
Coombs J., Deeds D., 2000. “International alliances as sources of capital: Evidence from the Biotechnology industry”. The Journal of High
Technology Management Research, 11 (2): 235-253.
School Press.
D’Amore R., Vittoria M.P., 2006. “Le Biotecnologie in Italia. Ricerca per la costruzione di un Data Base generico per le analisi di settore e di un Repertorio per le policy”. Quaderno di ricerca DISES, Università degli Studi di Salerno, (23).
D’Amore R., Vittoria M. P., forthcoming. “Healthcare biotech industry: linee identificative di un nuovo settore e degli indicatori per le analisi di politica industriale. Una prima indagine sulla realtà italiana”. in Di Tommaso M. e Paci D. (a cura di) L’Industria della Salute: contributi al
dibattito italiano e prospettive di politica industriale, F. Angeli: Milano.
Damanpour F, 1992 “Organization size and innovation”, Organization
Studies, 13(3): 375-402.
Deeds D.L., Hill C.W.L., 1996. “Strategic alliances and the rate of new product development: an empirical study of entrepreneurial biotechnology firms”. Journal of Business Venturing, 11: 41-55.
Dosi G. 1988. “Sources, Procedures, and microeconomic effects of
innovation”. Small Business Economics, 6: 363-372.
Freel,M., 2003. “Sectoral patterns of Small Firm Innovation, Networking and Proximity”. Research policy, 32: 751-770.
Freeman C., 1991. “Networks of innovators: a synthesis of research issues”. Research policy, 20: 499-514.
Giarratana M.S., 2004. “The birth of a new industry: Entry by Start –up Innovation spur the Gale of creative destruction?” NBER Working paper 7851.
Hagedoorn J.,1995. “Strategic technology partnering during the 1980s: trend, networks, and corporate patterns in non core technologies”. Research
policy, 24: 207-231.
Hall L.A, Bagchi-Sen, 2007. “An analysis of firm-level innovation strategies in the US biotechnology industry”. Technovation, 27: 4-14.
Halperin M. and Chakrabarti A.K. 1987. “Firm and industry characteristics influencing publications of scientists in large American companies”, R & D
Management 17 (3):b167-173.
Henderson R., Cockburn I. 1996. “Scale, scope and spillovers: the determinants of research productivity in Drug Discovery”, RAND Journal
of Economics 27 (1): 32-59.
Jewkes J., Sawers D., Stillerman R.1958. The sources of invention, London Macmillan.
Kamien M., Schwartz N.L., 1982. Market Structure and Innovation: Cambridge: Cambridge.
Levinthal D.A., J.G. March, 1993. “The myopia of learning”. Strategic
Management Journal, 14: 95-112.
Mansfield, E. 1980. “Basic research and productivity increase in manufacturing”. American Economic Review, 70:863-873.
Mueller, D. 1962. “The origins of basic inventions underlying Du Pont’s Major product and process innovations, 1920 to 1950”. The rate and
direction of inventive activity. National Bureau of economic research
Princeton NJ: Princeton University Press.
OECD 2001. A Statistical Framework for Biotechnology Statistics, DSTI/EAS/STP/NESTI, OECD, Paris.
Oerlemans, L.A., Meeus, M.T.H., Boekema, F.W.M. 2001. “Firm clustering and innovavtion: determinants and effects”, Regional Science, 80: 337-356.
Piga C. and Vivarelli N. 2003. “Internal and External R&D: A Sample Selection Approach” Discussion Paper on Entrepreneurship, Growth and Public Policy 2004-2005, Max Plance Institute of Economics, Group for Entrepreneurship, Growth and Public Policy.
collaboration in the biotechnology industry”, in Mowery, D. (a cura di),
International Collaborative Ventures in U.S. Manufacturing. Ballinger
Publishing Co., Cambridge, MA.
Rothaermel F., 2001. “Complimentary assets, strategic alliances, and the incumbent’s advantage: an empirical study of industry and firm effects in the biopharmaceutical industry”. Research Policy 30 (8): 1235-1251. Shan W., Walker G., Kogut B., 1994. “Interfirm cooperation and startup innovation in the biotechnology industry”. Strategic Management Journal 15: 387–394.
Scherer, F. and Ross, D. (1990) Industrial Market Structure and Economic
Performance, 3th Editino, Boston: Houghton Mifflin
Schumpeter, J.A 1942. Capitalism Socialism and Democracy , various editions .
Terziovski M., Morgan J.P., 2006. “Management practices and strategies to accelerate the innovation cycle in the biotechnology industry”.
WORKING PAPERS DEL DIPARTIMENTO
1988, 3.1 Guido CELLA
Linkages e moltiplicatori input-output. 1989, 3.2 Marco MUSELLA
La moneta nei modelli di inflazione da conflitto. 1989, 3.3 Floro E. CAROLEO
Le cause economiche nei differenziali regionali del tasso di disoccupazione. 1989, 3.4 Luigi ACCARINO
Attualità delle illusioni finanziarie nella moderna società. 1989, 3.5 Sergio CESARATTO
La misurazione delle risorse e dei risultati delle attività innovative: una valu-tazione dei risultati dell'indagine CNR- ISTAT sull'innovazione tecnologica. 1990, 3.6 Luigi ESPOSITO - Pasquale PERSICO
Sviluppo tecnologico ed occupazionale: il caso Italia negli anni '80. 1990, 3.7 Guido CELLA
Matrici di contabilità sociale ed analisi ambientale. 1990, 3.8 Guido CELLA
Linkages e input-output: una nota su alcune recenti critiche. 1990, 3.9 Concetto Paolo VINCI
I modelli econometrici sul mercato del lavoro in Italia. 1990, 3.10 Concetto Paolo VINCI
Il dibattito sul tasso di partecipazione in Italia: una rivisitazione a 20 anni di distanza.
1990, 3.11 Giuseppina AUTIERO
Limiti della coerenza interna ai modelli con la R.E.H.. 1990, 3.12 Gaetano Fausto ESPOSITO
Evoluzione nei distretti industriali e domanda di istituzione. 1990, 3.13 Guido CELLA
Measuring spatial linkages: input-output and shadow prices. 1990, 3.14 Emanuele SALSANO
1990, 3.15 Emanuele SALSANO
Investimenti, valore aggiunto e occupazione in Italia in contesto biregionale: una prima analisi dei dati 1970/1982.
1990, 3.16 Alessandro PETRETTO- Giuseppe PISAURO
Uniformità vs selettività nella teoria della ottima tassazione e dei sistemi tributari ottimali.
1990, 3.17 Adalgiso AMENDOLA
Inflazione, disoccupazione e aspettative. Aspetti teorici dell'introduzione di aspettative endogene nel dibattito sulla curva di Phillips.
1990, 3.18 Pasquale PERSICO
Il Mezzogiorno e le politiche di sviluppo industriale. 1990, 3.19 Pasquale PERSICO
Priorità delle politiche strutturali e strategie di intervento. 1990, 3.20 Adriana BARONE - Concetto Paolo VINCI
La produttività nella curva di Phillips. 1990, 3.21 Emiddio GALLO
Varianze ed invarianze socio-spaziali nella transizione demografica dell'Ita-lia post-industriale.
1991, 3.22 Alfonso GAMBARDELLA
I gruppi etnici in Nicaragua. Autonomia politica ed economica. 1991, 3.23 Maria SCATTAGLIA
La stima empirica dell'offerta di lavoro in Italia: una rassegna. 1991, 3.24 Giuseppe CELI
La teoria delle aree valutarie: una rassegna. 1991, 3.25 Paola ADINOLFI
Relazioni industriali e gestione delle risorse umane nelle imprese italiane. 1991, 3.26 Antonio e Bruno PELOSI
Sviluppo locale ed occupazione giovanile: nuovi bisogni formativi. 1991, 3.27 Giuseppe MARIGLIANO
La formazione del prezzo nel settore dell'intermediazione commerciale. 1991, 3.28 Maria PROTO
Risorse naturali, merci e ambiente: il caso dello zolfo. 1991, 3.29 Salvatore GIORDANO
1992, 3.30 Antonio LOPES
Crisi debitoria e politiche macroeconomiche nei paesi in via di sviluppo negli anni 80.
1992, 3.31 Antonio VASSILLO
Circuiti economici semplici, complessi, ed integrati. 1992, 3.32 Gaetano Fausto ESPOSITO
Imprese ed istituzioni nel Mezzogiorno: spunti analitici e modalità di relazio-ne.
1992, 3.33 Paolo COCCORESE
Un modello per l'analisi del sistema pensionistico. 1994, 3.34 Aurelio IORI
Il comparto dei succhi di agrumi: un caso di analisi interorganizzativa. 1994, 3.35 Nicola POSTIGLIONE
Analisi multicriterio e scelte pubbliche. 1994, 3.36 Adriana BARONE
Cooperazione nel dilemma del prigioniero ripetuto e disoccupazione invo-lontaria.
1994, 3.37 Adriana BARONE
Le istituzioni come regolarità di comportamento. 1994, 3.38 Maria Giuseppina LUCIA
Lo sfruttamento degli idrocarburi offshore tra sviluppo economico e tutela dell'ambiente.
1994, 3.39 Giuseppina AUTIERO
Un'analisi di alcuni dei limiti strutturali alle politiche di stabilizzazione nei LCDs.
1994, 3.40 Bruna BRUNO
Modelli di contrattazione salariale e ruolo del sindacato. 1994, 3.41 Giuseppe CELI
Cambi reali e commercio estero: una riflessione sulle recenti interpretazioni teoriche.
1995, 3.42 Alessandra AMENDOLA, M. Simona ANDREANO
The TAR models: an application on italian financial time series. 1995, 3.43 Leopoldo VARRIALE
1995, 3.44 A. PELOSI, R. LOMBARDI
Fondi pensione: equilibrio economico-finanziario delle imprese. 1995, 3.45 Emanuele SALSANO, Domenico IANNONE
Economia e struttura produttiva nel salernitano dal secondo dopoguerra ad oggi.
1995, 3.46 Michele LA ROCCA
Empirical likelihood and linear combinations of functions of order statistics. 1995, 3.47 Michele LA ROCCA
L’uso del bootstrap nella verosimiglianza empirica. 1996, 3.48 Domenico RANESI
Le politiche CEE per lo sviluppo dei sistemi locali: esame delle diverse tipo-logie di intervento e tentativo di specificazione tassonomica.
1996, 3.49 Michele LA ROCCA
L’uso della verosimiglianza empirica per il confronto di due parametri di po-sizione.
1996, 3.50 Massimo SPAGNOLO
La domanda dei prodotti della pesca in Italia. 1996, 3.51 Cesare IMBRIANI, Filippo REGANATI
Macroeconomic stability and economic integration. The case of Italy. 1996, 3.52 Annarita GERMANI
Gli effetti della mobilizzazione della riserva obbligatoria. Analisi sull’efficienza del suo utilizzo.
1996, 3.53 Massimo SPAGNOLO
A model of fish price formation in the north sea and the Mediterranean. 1996, 3.54 Fernanda MAZZOTTA
RTFL: problemi e soluzioni per i dati Panel. 1996, 3.55 Angela SPAGNUOLO
Concentrazione industriale e dimensione del mercato: il ruolo della spesa per pubblicità e R&D.
1996, 3.56 Giuseppina AUTIERO
The economic case for social norms. 1996, 3.57 Francesco GIORDANO
Sulla convergenza degli stimatori Kernel. 1996, 3.58 Tullio JAPPELLI, Marco PAGANO
1997, 3.59 Tullio JAPPELLI
The age-wealth profile and the life-cycle hypothesis: a cohort analysis with a time series of cross sections of Italian households.
1997, 3.60 Marco Antonio MONACO
La gestione dei servizi di pubblico interesse. 1997, 3.61 Marcella ANZOLIN
L’albero della qualità dei servizi pubblici locali in Italia: metodologie e risulta-ti conseguirisulta-ti.
1997, 3.62 Cesare IMBRIANI, Antonio LOPES
Intermediazione finanziaria e sistema produttivo in un’area dualistica. Uno studio di caso.
1997, 3.63 Tullio JAPPELLI
Risparmio e liberalizzazione finanziaria nell’Unione europea. 1997, 3.64 Alessandra AMENDOLA
Analisi dei dati di sopravvivenza. 1997, 3.65 Francesco GIORDANO, Cira PERNA
Gli stimatori Kernel per la stima non parametrica della funzione di regres-sione.
1997, 3.66 Biagio DI SALVIA
Le relazioni marittimo-commerciali nell’imperiale regio litorale austriaco nella prima metà dell’800.
I. Una riclassificazione delle Tafeln zur Statistik der Öesterreichischen Monarchie.
1997, 3.67 Alessandra AMENDOLA
Modelli non lineari di seconda e terza generazione: aspetti teorici ed evi-denze empiriche.
1998, 3.68 Vania SENA
L’analisi econometrica dell’efficienza tecnica. Un’applicazione agli ospedali italiani di zona.
1998, 3.69 Domenico CERBONE Investimenti irreversibili. 1998, 3.70 Antonio GAROFALO
La riduzione dell’orario di lavoro è una soluzione al problema disoccupazio-ne: un tentativo di analisi empirica.
1998, 3.71 Jacqueline MORGAN, Roberto RAUCCI New convergence results for Nash equilibria.
1998, 3.72 Rosa FERRENTINO
Niels Henrik Abel e le equazioni algebriche. 1998, 3.73 Marco MICOCCI, Rosa FERRENTINO
Un approccio markoviano al problema della valutazione delle opzioni. 1998, 3.74 Rosa FERRENTINO, Ciro CALABRESE
Rango di una matrice di dimensione K. 1999, 3.75 Patrizia RIGANTI
L’uso della valutazione contingente per la gestione del patrimonio culturale: limiti e potenzialità.
1999, 3.76 Annamaria NESE
Il problema dell’inefficienza nel settore dei musei: tecniche di valutazione. 1999, 3.77 Gianluigi COPPOLA
Disoccupazione e mercato del lavoro: un’analisi su dati provinciali. 1999, 3.78 Alessandra AMENDOLA
Un modello soglia con eteroschedasticità condizionata per tassi di cambio. 1999, 3.79 Rosa FERRENTINO
Su un’applicazione della trasformata di Laplace al calcolo della funzione asintotica di non rovina.
1999, 3.80 Rosa FERRENTINO
Un’applicazione della trasformata di Laplace nel caso di una distribuzione di Erlang.
1999, 3.81 Angela SPAGNUOLO
Efficienza e struttura degli incentivi nell’azienda pubblica: il caso dell’industria sanitaria.
1999, 3.82 Antonio GAROFALO, Cesare IMBRIANI, Concetto Paolo VINCI Youth unemployment: an insider-outsider dynamic approach. 1999, 3.83 Rosa FERRENTINO
Un modello per la determinazione del tasso di riequilibrio in un progetto di fusione tra banche.
1999, 3.84 DE STEFANIS, PORZIO
Assessing models in frontier analysis through dynamic graphics. 1999, 3.85 Annunziato GESUALDI
Inflazione e analisi delle politiche fiscali nell’U.E.. 1999, 3.86 R. RAUCCI, L. TADDEO
1999, 3.87 Rosa FERRENTINO
Sulla determinazione di numeri aleatori generati da equazioni algebriche. 1999, 3.88 C. PALMISANI, R. RAUCCI
Sulle funzioni circolari: una presentazione non classica. 2000, 3.89 Giuseppe STORTI, Pierluigi FURCOLO, Paolo VILLANI
A dynamic generalized linear model for precipitation forecasting. 2000, 3.90 Rosa FERRENTINO
Un procedimento risolutivo per l’equazione di Dickson. 2000, 3.91 Rosa FERRENTINO
Un’applicazione della mistura di esponenziali alla teoria del rischio. 2000, 3.92 Francesco GIORDANO, Michele LA ROCCA, Cira PERNA
Bootstrap variance estimates for neural networks regression models. 2000, 3.93 Alessandra AMENDOLA, Giuseppe STORTI
A non-linear time series approach to modelling asymmetry in stock market indexes.
2000, 3.94 Rosa FERRENTINO
Sopra un’osservazione di De Vylder. 2000, 3.95 Massimo SALZANO
Reti neurali ed efficacia dell’intervento pubblico: previsioni dell’inquinamento da traffico nell’area di Villa S. Giovanni.
2000, 3.96 Angela SPAGNUOLO
Concorrenza e deregolamentazione nel mercato del trasporto aereo in Italia. 2000, 3.97 Roberto RAUCCI, Luigi TADDEO
Teoremi ingannevoli. 2000, 3.98 Francesco GIORDANO
Una procedura per l’inizializzazione dei pesi delle reti neurali per l’analisi del trend.
2001, 3.99 Angela D’ELIA
Some methodological issues on multivariate modelling of rank data. 2001, 3.100 Roberto RAUCCI, Luigi TADDEO
Nuove classi di funzioni scalari quasiconcave generalizzate: caratterizzazio-ni ed applicaziocaratterizzazio-ni a problemi di ottimizzazione.
2001, 3.101 Adriana BARONE, Annamaria NESE Some insights into night work in Italy. 2001, 3.102 Alessandra AMENDOLA, Marcella NIGLIO
Predictive distributions of nonlinear time series models. 2001, 3.103 Roberto RAUCCI
Sul concetto di certo equivalente nella teoria HSSB. 2001, 3.104 Roberto RAUCCI, Luigi TADDEO
On stackelberg games: a result of unicity. 2001, 3.105 Roberto RAUCCI
Una definizione generale e flessibile di insieme limitato superiormente in ℜn
2001, 3.106 Roberto RAUCCI
Stretta quasiconcavità nelle forme funzionali flessibili. 2001, 3.107 Roberto RAUCCI
Sugli insiemi limitati in ℜm rispetto ai coni.
2001, 3.108 Roberto RAUCCI
Monotonie, isotonie e indecomponibilità deboli per funzioni a valori vettoriali con applicazioni.
2001, 3.109 Roberto RAUCCI
Generalizzazioni del concetto di debole Kuhn-Tucker punto-sella. 2001, 3.110 Antonia Rosa GURRIERI, Marilene LORIZIO
Le determinanti dell'efficienza nel settore sanitario. Uno studio applicato. 2001, 3.111 Gianluigi COPPOLA
Studio di una provincia meridionale attraverso un'analisi dei sistemi locali del lavoro. Il caso di Salerno.
2001, 3.112 Francesco GIORDANO
Reti neurali per l’analisi del trend: un approccio per identificare la topologia della rete.
2001, 3.113 Marcella NIGLIO
Nonlinear time series models with switching structure: a comparison of their forecast performances.
2001, 3.114 Damiano FIORILLO
Capitale sociale e crescita economica. Review dei concetti e dell'evidenza empirica.
2001, 3.115 Roberto RAUCCI, Luigi TADDEO
Generalizzazione del concetto di continuità e di derivabilità. 2001, 3.116 Marcella NIGLIO
2001, 3.117 Vincenzo VECCHIONE
Mutamenti del sistema creditizio in un’area periferica. 2002, 3.118 Francesco GIORDANO, Michele LA ROCCA, Cira PERNA
Bootstrap variable selection in neural network regression models. 2002, 3.119 Roberto RAUCCI, Luigi TADDEO
Insiemi debolmente convessi e concavità in senso generale. 2002, 3.120 Vincenzo VECCHIONE
Know how locali e percorsi di sviluppo in aree e settori marginali. 2002, 3.121 Michele LA ROCCA, Cira PERNA
Neural networks with dependent data. 2002, 3.122 Pietro SENESI
Economic dynamics: theory and policy. A stability analysis approach. 2002, 3.123 Gianluigi COPPOLA
Stima di un indicatore di pressione ambientale: un'applicazione ai comuni della Campania.
2002, 3.124 Roberto RAUCCI
Sull’esistenza di autovalori e autovettori positivi anche nel caso non lineare. 2002, 3.125 Maria Carmela MICCOLI
Identikit di giovani lucani.
2002, 3.126 Sergio DESTEFANIS, Giuseppe STORTI
Convexity, productivity change and the economic performance of countries. 2002, 3.127 Giovanni C. PORZIO, Maria Prosperina VITALE
Esplorare la non linearità nei modelli Path. 2002, 3.128 Rosa FERRENTINO
Sulla funzione di Seal.
2003, 3.129 Michele LA ROCCA, Cira PERNA
Identificazione del livello intermedio nelle reti neurali di tipo feedforward. 2003, 3.130 Alessandra AMENDOLA, Marcella NIGLIO, Cosimo VITALE
The exact multi-step ahead predictor of SETARMA models. 2003, 3.131 Mariangela BONASIA
La dimensione ottimale di un sistema pensionistico: means tested vs pro-gramma universale.
2003, 3.132 Annamaria NESE
2003, 3.133 Maria Lucia PARRELLA
Le proprietà asintotiche del Local Polynomial Bootstrap. 2003, 3.134 Silvio GIOVE, Maurizio NORDIO, Stefano SILVONI
Stima della prevalenza dell'insufficienza renale cronica con reti bayesiane: analisi costo efficacia delle strategie di prevenzione secondaria.
2003, 3.135 Massimo SALZANO
Globalization, complexity and the holism of the italian school of public fi-nance.
2003, 3.136 Giuseppina AUTIERO
Labour market institutional sistems and unemplyment performance in some Oecd countries.
2003, 3.137 Marisa FAGGINI
Recurrence analysis for detecting non-stationarity and chaos in economic times series.
2003, 3.138 Marisa FAGGINI, Massimo SALZANO
The reverse engineering of economic systems. Tools and methodology. 2003, 3.139 Rosa FERRENTINO
In corso di pubblicazione.
2003, 3.140 Rosa FERRENTINO, Roberto RAUCCI
Sui problemi di ottimizzazione in giochi di Stackelberg ed applicazioni in modelli economici.
2003, 3.141 Carmine SICA
In corso di pubblicazione.
2004, 3.142 Sergio DESTEFANIS, Antonella TADDEO, Maurizio TORNATORE The stock of human capital in the Italian regions.
2004, 3.143 Elena Laureana DEL MERCATO
Edgeworth equilibria with private provision of public good. 2004, 3.144 Elena Laureana DEL MERCATO
Externalities on consumption sets in general equilibrium. 2004, 3.145 Rosa FERRENTINO, Roberto RAUCCI
Su alcuni criteri delle serie a termini non negativi. 2004, 3.146 Rosa FERRENTINO, Roberto RAUCCI
Legame tra le soluzioni di Minty e di Stempacenhia nelle disequazioni varia-zionali.
2004, 3.147 Gianluigi COPPOLA In corso di pubblicazione. 2004, 3.148 Massimo Spagnolo
The Importance of Economic Incentives in Fisheries Management 2004, 3.149 F. Salsano
La politica monetaria in presenza di non perfetta osservabilità degli obiettivi del banchiere centrale.
2004, 3.150 A. Vita
La dinamica del cambiamento nella rappresentazione del territorio. Una mappa per i luoghi della Valle dell’Irno.
2004, 3.151 Celi
Empirical Explanation of vertical and horizontal intra-industry trade in the UK: a comment.
2004, 3.152 Amendola – P. Vitale
Self-Assessment and Career Choices: An On-line resource for the Univer-sity of Salerno.
2004, 3.153 A. Amendola – R. Troisi
Introduzione all’economia politica dell’organizzazione: nozioni ed applicazio-ni.
2004, 3.154 A. Amendola – R. Troisi
Strumenti d’incentivo e modelli di gestione del personale volontario nelle organizzazioni non profit.
2004, 3.155 Lavinia Parisi
La gestione del personale nelle imprese manifatturiere della provincia di Salerno.
2004, 3.156 Angela Spagnuolo – Silvia Keller
La rete di accesso all’ultimo miglio: una valutazione sulle tecnologie alterna-tive.
2005, 3.157 Davide Cantarelli
Elasticities of Complementarity and Substitution in Some Functional Forms. A Comparative Review.
2005, 3.158 Pietro Coretto – Giuseppe Storti
Subjective Sxpectations in Economics: a Statistical overview of the main findings.
2005, 3.159 Pietro Coretto – Giuseppe Storti
2005, 3.160 Massimo Salzano
Una simulazione neo-keynesiana ad agenti eterogeni. 2005, 3.161 Rosa Ferrentino
Su alcuni paradossi della teoria degli insiemi. 2005, 3.162 Damiano Fiorillo
Capitale sociale: uno o molti? Pochi. 2005, 3.163 Damiano Fiorillo
Il capitale sociale conta per outcomes (macro) economici?. 2005, 3.164 Damiano Fiorillo – Guadalupi Luigi
Attività economiche nel distretto industriale di Nocera inferiore – Gragnano. Un’analisi su Dati Tagliacarne.
2005, 3.165 Rosa Ferrentino
Pointwise well-posedness in vector optimization and variational inequalities. 2005, 3.166 Roberto Iorio
La ricerca universitaria verso il mercato per il trasferimento tecnologico e ri-schi per l’”Open Science”: posizioni teoriche e filoni di indagine empirica. 2005, 3.167 Marisa Faggini
The chaotic system and new perspectives for economics methodology. A note.
2005, 3.168 Francesco Giordano
Weak consistent moving block bootstrap estimator of sampling distribution of CLS estimators in a class of bilinear models
2005, 3.169 Edgardo Sica
Tourism as determinant of economic growth: the case of south-east asian countries.
2005, 3.170 Rosa Ferrentino
On Minty variational inequalities and increasing along rays functions. 2005, 3.171 Rosa Ferrentino
On the Minty and Stampacchia scalar variational inequalities 2005, 3.172 Destefanis - Storti
A procedure for detecting outliers in frontier estimation 2005, 3.173 Destefanis - Storti
Evaluating business incentives trough dea. An analysis on capitalia firm data
2005, 3.174 Nese – O’Higgins
In and out of the capitalia sample: evaluating attrition bias. 2005, 3.175 Maria Patrizia Vittoria
Il Processo di terziarizzazione in Campania. Analisi degli indicatori principali nel periodo 1981-2001
2005, 3.176 Sergio Destefanis – Giuseppe Mastromatteo
Inequality and labour-market performance. A survey beyond an elusive trade-off.
2007, 3.177 Giuseppe Storti
Modelling asymmetric volatility dynamics by multivariate BL-GARCH models 2007, 3.178 Lucio Valerio Spagnolo – Mario Cerrato
No euro please, We’re British! 2007, 3.179 Maria Carmela Miccoli
Invecchiamento e seconda transizione demografica 2007, 3.180 Maria Carmela Miccoli – Antonio Cortese
Le scuole italiane all’estero: una realtà poco nota 2007, 3.181 Rosa Ferrentino
Variational inequalities and optimization problems 2007, 3.182 Lavinia Parisi
Estimating capability as a latent variable: A Multiple Indicators and Multiple Causes Approach. The example of health
2007, 3.183 Rosa Ferrentino
Well-posedness, a short survey
2007, 3.184 Roberto Iorio – Sandrine Labory – Daniele Paci
Relazioni tra imprese e università nel biotech-salute dell’Emilia Romagna. Una valutazione sulla base della co-authorship delle pubblicazioni scientifi-che
2007, 3.185 Lavinia Parisi
Youth Poverty after leaving parental horne: does parental incombe matter? 2007, 3.186 Pietro Coretto – Christian Hennig
Identifiality for mixtures of distributions from a location-scale family with uni-form
2007, 3.187 Anna Parziale
Il fitness landscape: un nuovo approccio per l’analisi del federalismo fiscale 2007, 3.188 Christian Di Pietro – Elena L. del Mercato
2007, 3.189 Valeria D’Amato
Pricing di Opzioni esotiche: Rassegna Teorica e Strumenti Informatici per il Prezzamento
2007, 3.190 Roberto Iorio – Sandrine Labory – Daniele Paci
The Determinants of Research Quality in Italy: Empirical Evidence using Bibliometric Data in the Biotech Sector
2008, 3.191 Luca Romaniello – Roberto Iorio
Soddisfazione ed insoddisfazione nel lavoro. Determinanti individuali dell’ insoddisfazione lavorativa ed analisi dei fattori di disagio. Un analisi del ca-so del Triveneto
2008, 3.192 Antonio Cortese – Maria Carmela Miccoli
L’immigrazione nei paesi dell’Europa mediterranea: il caso del Portogallo 2008, 3.193 Marialuisa Restaino
Dropping out of University of Salerno: a Survival Approach 2008, 3.194 Mari Carmela Miccoli
Stranieri sempre più numerosi, con figli sempre più istruiti. Le seconde ge-nerazioni nel nostro sistema scolastico
2008, 3.195 Carlo Capuano – Giuseppe De Feo
Privatitation in oligopoly: the Impact of the shadow cost of public funds 2008, 3.196 Giuseppe De Feo
Efficiency gains and margers 2008, 3.197 Maria Olivella Rizza
Gunnar Myrdal’s Critiques of Utility Theory. Some implications 2008, 3.198 Sergio De Stefanis – Giuseppe Mastromatteo
Winds of change and policies. The nequality-Employment trade-off in the OECD
2008, 3.199 Giuseppe Giordano – Michele La Rocca – Maria Prosperina Vitale Strumenti di analisi per esplorare reti di collaborazione scientifica 2008, 3.200 Domenico De Stefano – Giancarlo Ragozzini - Maria Prosperina Vitale
Un approccio di rete all’analisi delle relazioni amicali dei disoccupati nella città di Napoli
2008, 3.201 Francesco Giordano
Weak consistent moving block bootstrap estimator for the variance of cls estimators in a class of bilinear models
2008, 3.202 Antonio Guariglia
L’evoluzione del regime degli scambi nel commercio internazionale agroali-mentare: dal GATT alla WTO
2008, 3.203 Giovanni Camillo0 Porzio – Maria Prosperina Vitale
Assessing Linearity in Structural Equation Models through Graphics 2009, 3.204 Antonio Cortese
La rilevazione statistica dei senza tetto e delle alter persone non occupanti un’abitazione
2009, 3.205 Roberto Iorio – Daniele Paci
La ricerca in collaborazione con l’industria dei docenti universitari: aggior-namento sugli esiti di un questionario
2009, 3.206 Rosamaria D’Amore - Roberto Iorio
Internal and external sources of innovation in the Italian biotech sector
2009, 3.207 Maria Carmela Miccoli – Giovanni Ancona – Antonella Biscione
Dinamica demografica, crescita economica e povertà in Albania
2009, 3.208 Giuseppina Albano – Francesco Giordano – Cira Perna
Parameter Estimation In Continuous Stochastic Volatility Models
2009, 3.209 Giuseppina Albano – Francesco Giordano – Cira Perna
Stampa a cura della C.U.S.L. Cooperativa Universitaria Studio e Lavoro, Via Ponte Don Melillo, Fisciano