Titolo
ASSESSMENT OF A CROSS SECTION ADJUSTMENT FORMALISM USING
EXPERIMENTAL DATA FROM THE TAPIRO REACTOR
Descrittori
Tipologia del documento: Rapporto Tecnico
Collocazione contrattuale: Accordo di Programma ENEA-MISE su sicurezza nucleare e reattori di IV generazione.
Argomenti trattati: Neutronica, Generation IV reactors
Sommario
La trasmutazione di isotopi ed attinidi minori nei reattori nucleari a fissione consente di ridurre la radiotossicitià del combustibile nucleare esaurito. Al fine di rendere questo processo efficiente ed affidabile è però necessario approfondire le conoscenze relative ai dati nucleari per gli attinidi minori. In quest'ottica, è prevista la campagna di irraggiamento AOSTA (Activation of OSMOSE Sample in TAPIRO), per la quale è stato svolto uno studio di fattibilità qui riportato. È inoltre necessario determinare come i dati nucleari che caratterizzano il riflettore di rame di TAPIRO incidono sui tassi di reazione, soprattutto di cattura, degli attinidi minori. I coefficienti di sensitività sono qui calcolati mediante la teoria delle perturbazioni generalizzata ed il metodo di calcolo diretto. Infine, le misure dei parametri integrali in sistemi di riferimento come TAPIRO possono essere utilizzate per aggiustare i dati nucleari applicando specifiche procedure matematiche. Nel presente rapporto sono riassunti i risultati di un esercizio di verifica di queste procedure applicato ad una libreria di sezioni d'urto multigruppo generata per TAPIRO.
Note
Autori:Carta, V. Fabrizio, A. Grossi, V. Peluso (ENEA) D. Caron, S. Dulla, P. Ravetto (Politecnico di Torino)
Copia n. In carico a:
2 NOME
FIRMA
1 NOME
FIRMA
0 EMISSIONE 21-09-2016 NOME M. Carta M. Tarantino M. Tarantino FIRMA
Index
1. Introduction. ... 3
2. The TAPIRO fast neutron source research reactor. ... 4
3. The ERANOS code. ... 4
3.1 Architecture. ... 5
3.2 Cell Calculations. ... 5
3.3 Static Calculations. ... 6
4. The Serpent code. ... 6
4.1 History of the Serpent project ... 7
4.2 Monte Carlo method in Serpent ... 8
4.3 Interaction physics ... 8
5. The FISPACT code. ... 9
6. Energy averaged capture cross sections evaluation. ... 10
7. Evaluation of thecounting rates after irradiation of the IRMM samples. ... 11
8. Adjustment formalisms for nuclear data. ... 13
8.1 Methodology. ... 14
8.2 Some results of the adjustment exercise. ... 15
9. Evaluations of data measured in the TAPIRO reactor. ... 19
10. Sensitivity coefficients for copper density reduction. ... 19
11. Conclusions ... 25
12. Acknowledgments ... 26
13. References... 26
1. Introduction.
The main issue of the R&D activities for a sustainable use of nuclear fission energy certainly is the development of a reliable fuel cycle and a safe management of radioactive wastes. The main contribution to nuclear wastes is given by the spent fuel of the nuclear power plants, and the hazard from the spent fuel is mainly due to a few chemical elements, in particular plutonium and some Minor Actinides (MAs) such as neptunium, americium and curium, plus some long-lived fission products such as iodine and technetium. In this framework, R&D activities have shown that one of the promising approach to the appropriate management of MAs in order to reduce their risks is to transmute them in nuclear systems. However, due to a lack of experimental data, mainly regarding the accuracy of MAs nuclear data, it is not easy to establish a detailed design of transmutation systems with reliable accuracy. In the frame of the NEA Expert Group on Integral Experiments for Minor Actinide Management [1] a joint collaboration between ENEA (Italian National Agency for New Technologies, Energy and Sustainable Economic Development) and CEA (French Alternative Energies and Atomic Energy Commission) was established with the aim to study the feasibility of a MAs irradiation campaign in the TAPIRO fast neutron source research reactor located at the ENEA Casaccia center [2]. On the basis of neutron transport calculation results, obtained by both deterministic and Monte Carlo methods, an estimate of the irradiated samples counting levels from the AOSTA (Activation of Osmose Samples in TApiro) experimental campaign has been evaluated in previous works [3].
The results presented are obtained by calculations modeling the irradiation, in different TAPIRO irradiation channels, of some CEA samples from IRMM coming from the French AMSTRAMGRAM program in MINERVE [4], each sample loaded with different contents of MAs. On the basis of the neutron transport calculations results, obtained by both the deterministic ERANOS [5] and the Monte Carlo Serpent [6] codes, an estimate of these irradiated samples counting levels, taking into account both geometry and efficiency of the counting system, is provided.
Another open issue to carry out the experimental campaign is the need to figure out how the response of the MAs reaction rates, essentially capture, is linked to copper reflector nuclear data uncertainties. To preliminary address this issue, in this work an analysis of some MAs capture reaction rates sensitivity due to a 2% copper density reduction in the whole TAPIRO reflector is carried out. The 2% variation is chosen to be representative of an uncertainty on the nuclear data for copper. Calculations are performed by means of GPT (Generalized Perturbation Theory) [7], implemented in the deterministic code ERANOS1. The study has involved two different MAs isotopes: Am241 and Np237. GPT results have been compared with those coming from a direct approach.
The adjustment of nuclear data using integral parameter measurements on reference systems, such as TAPIRO, permits the improvement of the nuclear data set using the variance-covariance information of the nuclear data and the integral measurements, in addition to the sensitivity of the integral parameters to the nuclear data. The results of a preliminary study of the feasibility of an adjustment procedure applied to a multigroup cross section data generated for the TAPIRO reactor are discussed.
1
Part of this work will be presented at 14th Information Exchange Meeting on Actinide and Fission Product Partitioning and Transmutation (14IEMPT), Hilton San Diego Mission Valley, San Diego, CA, United States, 17-20 October 2016.
2. The TAPIRO fast neutron source research reactor.
TAPIRO (TAratura PIla Rapida a potenza zerO - Fast Pile Calibration at 0 Power) is a fast neutrons source research reactor located at C.R ENEA-CASACCIA (Italy). The project, entirely developed by ENEA staff, is based on the general concept of AFSR (Argonne Fast Source Reactor - Idaho Falls). It was built to support an experimental program on fast reactors and it is in operation since 1971.TAPIRO is currently used, in addition to education and training, for experimental programs in support of different research fields like nuclear data, nuclear fusion, aerospace industry.
The reactor has a maximum power of 5 kW with a neutron flux around 4∙1012 n/(cm2∙s) in the centre of the core. The core is cylindrical with a diameter of about 12 cm and a similar height. It is made by metallic uranium (98.5 % uranium and 1.5 % molybdenum) with an enrichment of 93.5 % in U235. It consists of 2 parts: the upper part is fixed while the lower one is movable. The core is surrounded by a double layer of a copper reflector and by an external borate concrete biological shield. The core is cooled by helium. The reactor is equipped with 2 shim rods, 2 safety rods and a regulating rod. These rods are made of the same material of the reflector, i.e. copper, and the reactor is controlled increasing or reducing the neutron leakage. The system has different experimental channels with various diameters. A horizontal section of the reactor is shown in Figure 1.
Figure 1.TAPIRO horizontal section.
3. The ERANOS code.
The European Reactor Analysis Optimized calculation System, ERANOS [5], has been developed and validated with the aim of providing an appropriate basis for neutronic calculations of current fast (and thermal) reactor cores. It consists of data libraries, deterministic codes and calculation procedures developed within a European framework and it meets the needs expressed by the industrialists and the teams working on the design of fast reactors, present and future.
ERANOS is written using the ALOS software which requires only standard FORTRAN compilers and include advanced programming features. It allows, with the use of LU user’s language, to perform programs of R&D in reactor physics without needing specific development.
3.1 Architecture.
Fast reactor core, shielding and fuel cycle calculations can be performed with the ERANOS system. A modular structure was adopted for easier evolution and incorporation of new functionalities.
Blocks of data can be created (data SETs) or used by different modules or by the user with LU control language. Programming and dynamic memory allocation are performed with the use of the ESOPE language. It can be possible to make an external temporary storage or permanent storage with the GEMAT and ARCHIVE functions, respectively. ESOPE, LU, GEMAT, and ARCHIVE are all part of the ALOS software.
This type of structure, based on a modular system, allows to link together different modules in procedures corresponding to recommended calculation routes ranging from fast-running and moderately-accurate ‘routine’ procedures to slow-running but highly-accurate ‘reference’ procedure. The main contents of ERANOS-2.2 package are:
nuclear data libraries, multigroup cross sections from ERALIB1, ENDF-/B-VI.8, 2.2, JEF-3.1 evaluated nuclear data files, and other specific data;
a cell and lattice code ECCO;
reactor flux solvers (diffusion, Sn transport, nodal variational transport);
a burn-up module;
different processing modules (material and neutron balance, breeding gains,…);
perturbation theory and sensitivity analysis modules;
core follow-up modules;
a fine burn-up analysis subset named MECCYCO (mass balances, activities, decay heat, dose rate).
Each nuclear data package contains four neutron cross section libraries obtained by processing the corresponding nuclear data files by the NJOY and CALENDF codes and they are:
a 1968 energy group library containing 41 main nuclides;
a 33 energy group library containing 246 nuclides, including pseudo fission products;
a 175 energy group library used for shielding calculation only;
a 172 energy group library used mainly for thermal spectrum calculations. 3.2 Cell Calculations.
ERANOS code has been developed within the European Collaboration on Fast Reactors over the past 30 years or so. It consists of data libraries, deterministic codes and calculation procedures.
ERANOS is a deterministic code system, neutron physics calculations are performed at the cell/lattice level and at the core level. The development of the ECCO Code was decided in 1985 by several R&D teams working within the framework of the European Fast Reactor Collaboration [5].
ECCO [8], European Cell COde, is the cell code allowing to calculate the cross sections matrices to be used in spatial core calculations performed by different ERANOS modules.
First of all, it is necessary to provide to ECCO media composition (homogeneous mixtures), expansion coefficients and geometric description of the cell. Then the cross sections are calculated by using the defined media and the associated nuclear data libraries by means of the collision probability method.
The nuclear data libraries are available at different temperature (293.6, 573.6, 973.6, 1473.6, 2973.6 K) to take into account the Doppler effect for the main nuclides.
An ECCO calculation corresponds to a succession of STEPs, and for each STEP one can select energy structure, cell geometry (heterogeneous or homogeneous), flux calculation type, and so on.
Many type of geometry are available within the ECCO code:
1D, plane or cylindrical calculated by exact collision probabilities method;
2D, rectangular lattice made of cylindrical and/or square pins within a square tube, hexagonal lattice made of cylindrical pins within a hexagonal sheet calculated by approximate collision probability method (Roth and double step methods);
3D, XYZ and HEX-Z calculated by approximate collision probability method.
The user has the possibility to chain several calculation steps so as to produce design or reference calculations, or even to use specific capabilities, according to the need of the study.
A route is a recommended way to perform ECCO calculations. The first route is the “reference” one that does not care about the time calculation and treats the heterogeneous cell at fine energy group level (1968 groups). The second route is the “project” or “design” one in which some simplifying hypotheses are assumed, the elastic slowing down is treated in a homogeneous geometry but at fine group level, the self-shielding is treated in a heterogeneous geometry at broad group level (33 groups).
3.3 Static Calculations.
ERANOS allows several types of flux calculations: diffusion and transport calculations with different methods; in each case can be addressed external source, up-scattering and adjoint calculations. For all geometries, 1D plane, cylindrical and spherical, 2D RZ, R-theta, rectangular lattice XY, hexagonal lattice, and 3D rectangular lattice XYZ, hexagonal-Z can be used finite difference diffusion solvers. In 1D and in some 2D geometries, like RZ and XY, finite difference Sn transport calculations can be performed by means of the BISTRO [9] code. The physics of thermal and fast reactors require the capability to solve the transport equation in accurate manner for different 2D and 3D geometries; variational nodal methods are well adapted for these topics because of the reduced numbers of unknowns used and the good accuracy in the solution by using high order approximation for spatial and angular expansions of flux and current in the node.
Both 2D (XY and hexagonal) and 3D (XYZ and hexagonal-Z) geometries are available within the TGV/VARIANT variational nodal module. The module performs direct flux calculations, with and without an external source, and adjoint calculations, and is possible to set up several parameters for different types of analyses. The computing time, in comparison with other methods devoted to the transport equation solution (like Sn), is very competitive.
4. The Serpent code.
Serpent is a three-dimensional continuous-energy Monte Carlo reactor physics burnup calculation code, developed at VTT Technical Research Centre of Finland since 2004. [10]
The suggested applications of Serpent include:
Spatial homogenization and group constant generation for deterministic reactor simulator calculations
Fuel cycle studies involving detailed assembly-level burnup calculations
Validation of deterministic lattice transport codes
Full-core modeling of research reactors, SMR's, and other closely coupled systems
Coupled multi-physics applications (available in Serpent 2)
Educational purposes and demonstration of reactor physics phenomena.
Similar to other Monte Carlo codes, such as MCNP and Keno-VI, Serpent uses a universe-based combinatorial solid geometry (CSG) model, which allows the description of practically any two- or three-dimensional fuel or reactor configuration. The geometry consists of material cells, defined by elementary quadratic and derived macrobody surface types.
The code also provides some additional geometry features specifically for fuel design. These features include simplified definition of cylindrical fuel pins and spherical fuel particles, square and hexagonal lattices for LWR and fast reactor geometries, and circular cluster arrays for CANDU fuels.
The random dispersion of microscopic fuel particles in high-temperature gas cooled reactor fuels and pebble distributions in pebble-bed type HTGR cores can be modeled using geometry types specifically designed for the task.
4.1 History of the Serpent project
The development of Serpent started at VTT in 2004, under the working title “Probabilistic Scattering Game”. The name was later changed to Serpent, due to the various ambiguities related to the PSG acronym.
The main reason to start developing a new Monte Carlo neutron transport code from scratch was the fact that the general-purpose codes available at that time were not particularly well suited for lattice physics applications. Group constant generation requires the combination of several user-defined reaction rate tallies and the estimation of combined statistical errors becomes complicated. The overall calculation time increases dramatically along with the number of tally definitions, and the calculation of certain parameters, such as scattering matrices, diffusion coefficients and effective delayed neutron fractions lies completely beyond the standard tally capabilities.
The source code was completely re-written by the end of 2005. The new version included a bound-atom scattering model for moderator isotopes. Parallel calculation using the Message Passing Interface (MPI) was also implemented.
Another major improvement was a new geometry routine that could overcome the localized absorber problems of delta-tracking in simple lattice geometries.
The current version of Serpent 1 began to formulate when the source code was completely re-written for a second time by the beginning of 2008. A persistent methodological flaw in the free-gas scattering model was corrected, which finally reduced the differences to MCNP results to the level of statistical accuracy. The old geometry routine was also replaced by a more general approach based on the combination of delta-tracking and the conventional surface tracking method.
The development of burnup calculation routines began in early 2008. The first version was based on an external coupling to the ORIGEN2 depletion code. It was soon decided, however, that the code should also have the capability to run burnup calculation as a complete stand-alone application.
A pre-release version (1.0.0) of the Serpent code was made available to some universities and research institutes in October 2008. The code was submitted for public distribution to the NEA Data Bank in April 2009 and released one month later [10].
4.2 Monte Carlo method in Serpent
The Monte Carlo simulation can be run in k-eigenvalue criticality source or external source mode. Neutron transport is based on a combination of conventional surface-to-surface ray-tracing and the Woodcock delta-tracking method. The tracking routine has proven efficient and well suited for geometries where the neutron mean-free-path is long compared to the dimensions.
The main drawback of delta-tracking is that the track-length estimate of neutron flux is not available and reaction rates have to be calculated using the potentially less-efficient collision estimator. This is usually not a problem in reactor calculations when reaction rates are scored in regions of high collision density. However, the efficiency of the collision estimator becomes poor in small or optically thin volumes located far or isolated from the active source.
The continuous-energy Monte Carlo method has been used for criticality safety analyses, radiation shielding and dose rate calculations, detector modeling and the validation of deterministic transport codes for decades.
The main motivator is usually the need to model geometry and interaction physics to within maximum accuracy, often regardless of the computational cost. Monte Carlo codes are well suited for the job, with the capability to handle complicated three-dimensional geometries and to model neutron interactions at the microscopic level without major approximations. In fact, Monte Carlo codes are often used to complement or even replace experimental measurements.
The computational requirements for reactor analysis, in particular the modeling of operating power reactors, are considerably higher. The strong coupling between neutronic, thermal hydraulics and fuel behavior means that the transport problem cannot be solved separately, and even though considerable efforts are devoted to developing various multi-physics calculation systems, the Monte Carlo method cannot yet be considered a practical option for routine design and safety analyses of large LWR cores. The traditional approach to reactor analysis relies instead on a multi-stage calculation scheme, where the complexity of transport physics is gradually simplified, while simultaneously increasing the scale of the modeled system. In practice, the calculation sequence is divided into:
1. Spatial homogenization, where the interaction physics at the fuel assembly level is condensed into a set of assembly-specific multi-group constants;
2. Core simulation, where the full-scale neutronic solution obtained using diffusion theory or other simplified transport method is iteratively coupled to thermal hydraulics.
The same code and cross section data can be used for modeling any fuel or reactor configuration without compromising the reliability of the calculation scheme. The particle transport simulation in is inherently three-dimensional, which makes it possible to capture the effects of axial heterogeneities. [7]
4.3 Interaction physics
Serpent reads continuous-energy cross sections from ACE format data libraries, based on JEF-2.2, JEFF-3.1, JEFF-3.1.1, ENDF-VI.8 and ENDFBVII.
The interaction physics is based on classical collision kinematics, ENDF reaction laws and probability table sampling in the unresolved resonance region.
Interaction data is available for 432 nuclides at 6 temperatures between 300 and 1800K. Thermal bound-atom scattering data is included for light and heavy water and graphite.
Continuous-energy cross sections in the library files are reconstructed on a unionized energy grid, used for all reaction modes. The use of a single energy grid results in a major speed-up in calculation, as the
number of CPU time consuming grid search iterations is reduced to minimum. Macroscopic cross sections for each material are pre-generated before the transport simulation.
Instead of calculating the cross sections by summing over the constituent nuclides during tracking, the values are read from pre-generated tables, which is another effective way of improving the performance.
A built-in Doppler-broadening preprocessor routine allows the conversion of ACE format cross sections into a higher temperature. This capability results in a more accurate description of the interaction physics in temperature sensitive applications, as the data in the cross section libraries is available only in 300K intervals.
5. The FISPACT code.
FISPACT is an inventory code that was included in the European Activation System2 [11]. The code has been developed for activation calculations for materials used in the fusion fields3 [12]. It is able to give information about atomic density and activity of a material irradiated with neutrons or charged particles. It takes its origins from FISPIN, an activation code used for fission reactors [11]. There are several (about ten) versions of the code starting from Version 1 through Version 2007. The code uses external libraries of all cross sections and decay data for the most important nuclides that play a key role in the neutron flux irradiation. The output of the code gives information about the activity (Bq), the amount of nuclides (in atoms and grams) and also the γ-dose rate (Sv/h). FISPACT works with one energy group cross sections so it requires the collapsing of the library with the neutron spectrum [11]. The EAF4 libraries[13] cover an energy range from thermal to 60 MeV. The code can calculate the effects of irradiation of different minor actinides. It have to be considered that the EAF libraries contain infinite dilution cross sections; this means that, if the actinides is present in significant proportion in the material, the output data won't be representative because the code doesn't include self-shielding and burn-up effects [11]. However, the calculation of a pure actinide is possible to model fuel in a fission power station or in a transmutation system, but the results won't be as exact as a dedicated fission reactor code such as FISPIN. To perform a calculation many data files are required
FILES file contains all the information about the location of all files requested for running the code; it must be located in the same directory of the FISPACT executable. The fundamental information that are necessary to write an input in FISPACT are: material details that has to be irradiated, time of irradiation and decay time after which evaluate the activity, specific information about the value of the neutron flux and the neutron spectrum that will be used [11]. The input is composed by a series of words that allow to perform different actions; these words can be divided in two categories:
preliminary code words: they are concerned with library specifications;
main code words: they gives details about the materials composition and the irradiation history.
2 EASY: it is an international standard for simulation of activation, transmutation processes and radiation damages caused
by nuclear reactions and decays. It is developed by the United Kingdom Atomic Energy Authority at Culham.
3 It has been adopted by the ITER project as the reference activation code. 4
The European Activation File (EAF) is an extensive data library prepared for the European Activation System (EASY). The EAF-2010 activation-transmutation neutron nuclear data library includes 816 target isotopes.
Usually, these words are used following the chronological order of the neutron irradiation. It is possible to create irradiation routines that can be repeated in loop to simulate, for example, a one week irradiation program. The input file describes also the required type of output. A typical output consists of a first part that reports preliminary information such as the name of the program, its version and library information. This part is then followed by the nuclide inventory that is reported for each time interval specified in the input. The standard output table gives information about the composition in atoms, the mass (g), the activity (Bq), the α, β, and γ energy and different type of γ-dose (Sv/h).
6. Energy averaged capture cross sections evaluation.
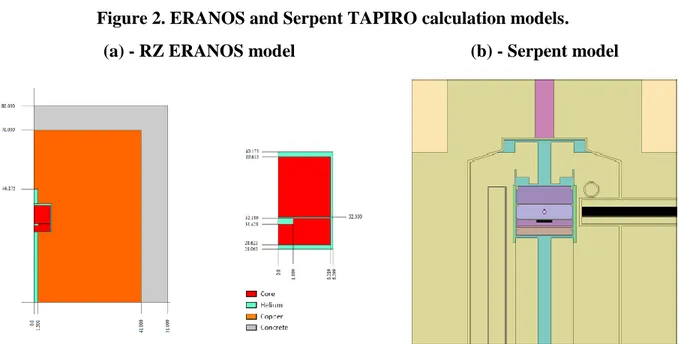
Neutron transport calculations have been performed by two different methodologies, deterministic by the ERANOS code and stochastic by the Monte Carlo Serpent code. In Figure2 the calculation models are shown.
Figure 2. ERANOS and Serpent TAPIRO calculation models.
(a) - RZ ERANOS model (b) - Serpent model
Neutron fluxes, energy spectra and reaction rates have been evaluated for several minor actinides in correspondence of different radial positions in the diametral experimental channel (cf. Figure 1). Then, position dependent average microscopic capture cross sections have been calculated to predict the impact on their values provided by the spectral variations across the system. Average capture microscopic cross sections σc(r) are defined as:
dE E dE E E σ c c
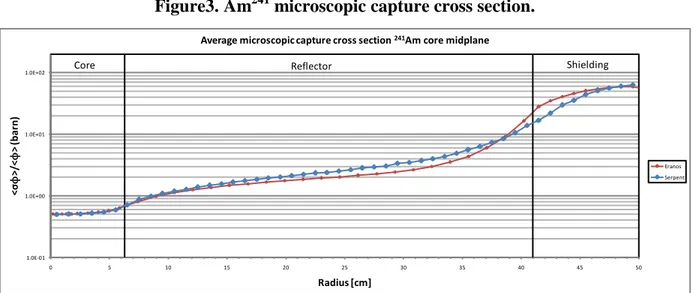
) , ( ) , ( ) , ( ) ( r r r r (1)where φ is the neutron flux. As an example, the behavior of the average capture microscopic cross sections for the minor actinide Am241across the system, calculated with both ERANOS and Serpent codes, is shown in Figure 3 [3].
Figure3. Am241 microscopic capture cross section. 1.0E-01 1.0E+00 1.0E+01 1.0E+02 0 5 10 15 20 25 30 35 40 45 50 <σ ϕ >/ < ϕ > (b ar n ) Radius [cm]
Average microscopic capture cross section 241Am core midplane
Eranos Serpent
Core Reflector Shielding
A satisfactory agreement can be observed, also for the other samples, betweenERANOS and Serpent codes results.
7. Evaluation of thecounting rates after irradiation of the IRMM samples.
The IRMM samples, see Figure 4, contain Am241 only in a single aluminum sheath. The matrix for all the samples is composed by AmO2.
Figure 4. IRMM AmO2 samples for the AMSTRAMGRAM program.
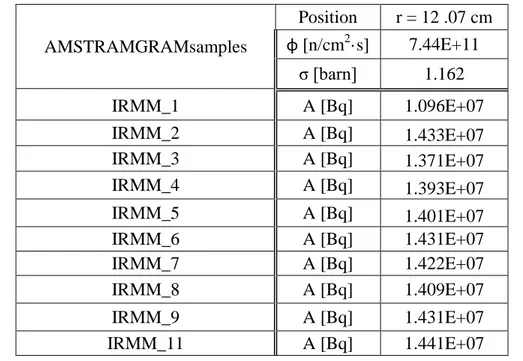
Due to the samples diameter, their irradiation can only be performedin the TAPIRO tangential channel. The calculated counting rates on Am242m are provided in Table 6.Only one sample positionhas been considered along the diametral channel: r=12.07 cm (near the core), see Figure 2 (a). In correspondence of such position the activity values for each IRMM samplehave been calculated by the FISPACT code[11]. The amount of Am in each sample is high enough to consider only a daily irradiation characterized by 5 hours of irradiation and 2 hours of cooling. Activity values have been evaluated after these last 2 hours of cooling.
The results, obtained using the ERANOS neutron flux results for this preliminary analysis, are shown in Table 1.
Table 1. Energy averaged cross sections and activity levels for each IRMM sample in TAPIRO. AMSTRAMGRAMsamples Position r = 12 .07 cm φ [n/cm2·s] 7.44E+11 σ [barn] 1.162 IRMM_1 A [Bq] 1.096E+07 IRMM_2 A [Bq] 1.433E+07 IRMM_3 A [Bq] 1.371E+07 IRMM_4 A [Bq] 1.393E+07 IRMM_5 A [Bq] 1.401E+07 IRMM_6 A [Bq] 1.431E+07 IRMM_7 A [Bq] 1.422E+07 IRMM_8 A [Bq] 1.409E+07 IRMM_9 A [Bq] 1.431E+07 IRMM_11 A [Bq] 1.441E+07
The counting rate [counts/s] for each detector have been evaluated by the relationship:
A I
C (2)
withA activity level [Bq], Iγ intensity of the γ or X emission [%], ε geometric efficiency of the detector
[%].
The geometric efficiency ε depends by the detectortype and by the overall experimental geometrical arrangement. In our case a n-type coaxial HPGe detector made of high purity germanium, showing high precision and efficiency for both γ and X rays in the energy range 3 keV÷10 MeV, was used. The geometric efficiency has been evaluated by Monte Carlo MCNP code [14] modeling the arrangement of the counting system (Figure5).
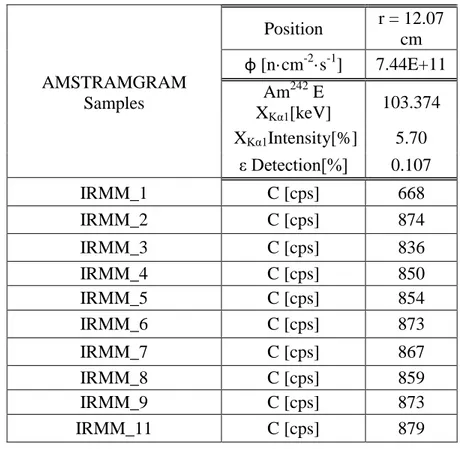
Table 2 summarizes the obtained results. In particular, for each sample are shown the γ or X rays characteristics (energy and intensity), the geometric efficiency and the counting level obtained by relationship (2).
Table 2. Counting rates for the selected AMSTRAMGRAM samples in TAPIRO (ERANOS neutron fluxes).
AMSTRAMGRAM Samples Position r = 12.07 cm φ [n·cm-2·s-1] 7.44E+11 Am242 E XKα1[keV] 103.374 XKα1Intensity[%] 5.70 ε Detection[%] 0.107 IRMM_1 C [cps] 668 IRMM_2 C [cps] 874 IRMM_3 C [cps] 836 IRMM_4 C [cps] 850 IRMM_5 C [cps] 854 IRMM_6 C [cps] 873 IRMM_7 C [cps] 867 IRMM_8 C [cps] 859 IRMM_9 C [cps] 873 IRMM_11 C [cps] 879
The counting rate levels shown in Table 2 seem to predict the feasibility of the AOSTA experimental campaign although, as evident, a more detailed analysis is needed in the next future to confirm these promising preliminary results. In particular, actual experimental problems could be the discrimination of interesting peaks (like Kα1 peak of Am242m) among a lot of peaks including the background coming from Am241. In this connection, in the future it will be interesting to simulate the wholeγ spectrum in the 100keV range, or at least calculate the count rate coming from Am241
peaks, especially the 102.98 γ ray.
8. Adjustment formalisms for nuclear data.
The formalisms for the adjustment of nuclear data using integral parameter measurements on reference systems are based on a statistical approach. The variance-covariance information of both the nuclear data and the integral measurements are needed, in order to maximize the likelihood that the adjusted
parameter set correctly represents the true integral quantities. The sensitivity of the integral parameters to the nuclear data is needed, since, of course, the entity of the adjustment is affected by the role played by the data in determining the value of the integral quantity and by its statistical uncertainty [15]. In order to have a true benefit from the process, the integral quantities used in the adjustment procedures should be characterized by a high accuracy. Measured values of the effective multiplication eigenvalue are often used, as well as integral reaction rates.
A work has been carried out to verify the feasibility of an adjustment procedure when applied to multigroup cross section data generated for the TAPIRO reactor. In particular, a 15 group library has been used, although the full variance-covariance matrices were not available. The purpose of the exercise was mainly to prove the applicability of the technique and its capability to produce reasonable and consistent results [16].
To perform the work, the sensitivity matrices are needed. In the particular case, such matrices have been generated using the perturbation theory module of ERANOS[5]. The multiplication eigenvalue has been chosen as the integral parameter of interest. Since no experimental data is available at the moment, the values have been assumed to be known and given with an associated uncertainty. The effect of the uncertainty on the adjusted cross section library has been investigated.
8.1 Methodology.
The following provides a brief description of the methodology of the adjustment formalism. A more elaborate treatment of the theoretical basis is offered in [15, 17].
Consider the set of M measured responses, , to a given set of N input parameters, , each ordered in vector form. To the set of parameters and to the set of responses is associated an uncertainty matrix, of dimension N×N and of dimension M×M, respectively, whose diagonal elements contain the variances and whose off-diagonal elements contain the covariances of the parameters and of the responses.
It is understood that the responses are functions of the input parameters and, assuming an infinitesimally small variation (adjustment) of the input parameter , with the adjusted parameter set, it is reasonable to linearise the dependence of the adjusted response according to:
,
(3) in which is a vector of deviations of the measured response with respect to the true, physical response, , (which is understood to differ from the approximate, linearised response, ) and is a sensitivity matrix of dimension M×N whose elements correspond to the sensitivity of response m to parameter n.
The fundamental idea of the adjustment method is to set the values of the adjusted parameters and the adjusted responses are the most probable outcomes of the joint probability density function that characterises the parameter-response space. As both the parameters and the responses are obtained
from experimental measurements, the joint probability density has the form of a multivariate Gaussian normal distribution
,
(4) which is expressed introducing the quadratic form, with
.
(5) In light of the foregoing discussion, the principal task is to determine the values of the unknowns and
that are the most probable. That is, to determine the values and that maximise the probability distribution of Eq.(4); as , this is equivalent to the minimisation of the quadratic of Eq.(5).
The minimisation of with respect to its arguments, see Eq.(5), and subject to the constraint of a linear response, Eq.(3), leads to the expression for the adjustments to be applied to the parameter set:
.
(6) The expression of Eq.(6) provides the optimal adjustments, those which most probably produce the observed response of the system, in terms of the uncertainties of both the parameter set and of the response set, of sensitivities of the response set to the parameter set and of the deviations of the response.
8.2 Some results of the adjustment exercise.
The adjustment method is applied to a parameter set for the TAPIRO reactor in order to demonstrate the feasibility of the method in the absence of a full set of experimental measurements. In this case, as a substitute for the measurements, the reactor is characterised through a computational model of TAPIROdeveloped at ENEA-Casaccia [3] using the ERANOS code suite. First, cell calculations are performed with the ECCO module to prepare a 49 group cross section library, with the structure shown in Table 3, condensed from the 1968 fine group and the 172 broad group structures of JECCOLIB. In these calculations, the JEF 2.2 library, distributed with the ERANOS-2.0 release version, is employed. Next, the flux (both direct and adjoint) and the effective multiplication eigenvalue are calculated in a fourth order discrete ordinates (S4) approximation using the flux solver of ERANOS for a cylindrical geometry model of TAPIRO using the 49 group library prepared in the previous step. Finally, using the 49 group data (cross section library, flux distribution and corresponding eigenvalue), a condensed set of 15 group sensitivity matrices, with the structure shown in Table 4, are computed for the principal reaction types (elastic scattering, inelastic scattering, capture and fission, if applicable) of several elements and istopes of interest (elemental O, Fe-56, U-235 and U-238).
Table 3. Energy structure adopted for the flux calculations of TAPIRO. Group, g Upper energy, Eg-1 [MeV] Lower energy, Eg [MeV]
1 1.96403E+01 1.73325E+01 2 1.73325E+01 1.49182E+01 3 1.49182E+01 1.38403E+01 4 1.38403E+01 1.16183E+01 5 1.16183E+01 1.00000E+01 6 1.00000E+01 8.18731E+00 7 8.18731E+00 6.70320E+00 8 6.70320E+00 6.06531E+00 9 6.06531E+00 5.48812E+00 10 5.48812E+00 4.49329E+00 11 4.49329E+00 3.67879E+00 12 3.67879E+00 3.01194E+00 13 3.01194E+00 2.46597E+00 14 2.46597E+00 2.23130E+00 15 2.23130E+00 2.01897E+00 16 2.01897E+00 1.65299E+00 17 1.65299E+00 1.35335E+00 18 1.35335E+00 1.22456E+00 19 1.22456E+00 1.10803E+00 20 1.10803E+00 1.00259E+00 21 1.00259E+00 9.07180E-01 22 9.07180E-01 8.20850E-01 23 8.20850E-01 4.97871E-01 24 4.97871E-01 3.01974E-01 25 3.01974E-01 1.83156E-01 26 1.83156E-01 1.11090E-01 27 1.11090E-01 6.73795E-02 28 6.73795E-02 4.08677E-02 29 4.08677E-02 2.47875E-02 30 2.47875E-02 1.50344E-02 31 1.50344E-02 9.11882E-03 32 9.11882E-03 5.53084E-03 33 5.53084E-03 3.35463E-03 34 3.35463E-03 2.03468E-03 35 2.03468E-03 1.23410E-03 36 1.23410E-03 7.48518E-04 37 7.48518E-04 4.53999E-04 38 4.53999E-04 3.04325E-04 39 3.04325E-04 1.48625E-04 40 1.48625E-04 9.16609E-05 41 9.16609E-05 6.79041E-05 42 6.79041E-05 4.01690E-05 43 4.01690E-05 2.26033E-05 44 2.26033E-05 1.37096E-05 45 1.37096E-05 8.31529E-06 46 8.31529E-06 4.00000E-06 47 4.00000E-06 5.40000E-07 48 5.40000E-07 1.00000E-07 49 1.00000E-07 1.01000E-10
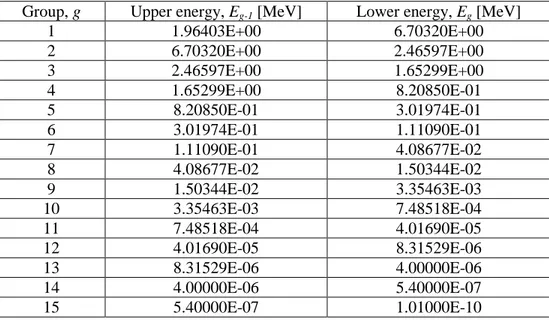
Table 4. Energy structure adopted for the adjustment calculations.
Group, g Upper energy, Eg-1 [MeV] Lower energy, Eg [MeV]
1 1.96403E+00 6.70320E+00 2 6.70320E+00 2.46597E+00 3 2.46597E+00 1.65299E+00 4 1.65299E+00 8.20850E-01 5 8.20850E-01 3.01974E-01 6 3.01974E-01 1.11090E-01 7 1.11090E-01 4.08677E-02 8 4.08677E-02 1.50344E-02 9 1.50344E-02 3.35463E-03 10 3.35463E-03 7.48518E-04 11 7.48518E-04 4.01690E-05 12 4.01690E-05 8.31529E-06 13 8.31529E-06 4.00000E-06 14 4.00000E-06 5.40000E-07 15 5.40000E-07 1.01000E-10
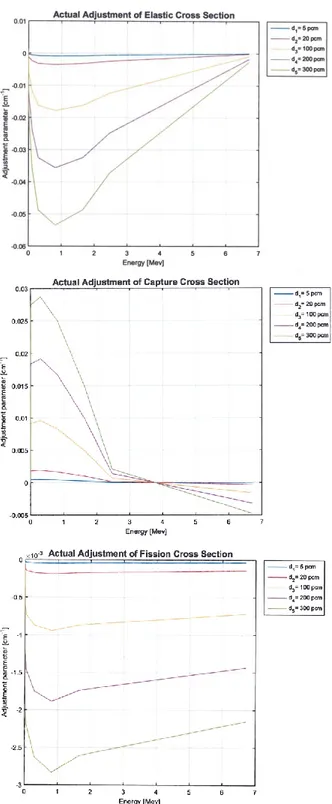
From the calculations, all of the input matrices required for the application of the adjustment method are available. The parameter uncertainty matrices, , are available from the data library, the sensitivity matrices, , are output of the code and the response uncertainty matrices are computed from the previous two quantities through the relationship . The adjustment method is applied to the effective multiplication eigenvalue, assuming that the deviation is a free parameter which is allowed to vary in the range of reasonable values in order to permit a parametric analysis. In particular, the values of the vector of deviations of the effective multiplication eigenvalue are assumed to be , in units of pcm. Representative results, namely the adjustments, , to be applied to the various cross sections of the nuclide U-235, are shown graphically in Figure 6.
9. Evaluations of data measured in the TAPIRO reactor.
At present, a work is going on the evaluations of real experimental data measured in the TAPIRO reactor. Experimental data are available from measurements carried out in the period 1980-1986 within an ENEA/SCK-CEN common research program. The data provided are integral reaction rates measured at different positions within the experimental channels.
The first scope of the work is the simulation of the TAPIRO reactor using the SERPENT Monte Carlo code [10] and, later, the deterministic code ERANOS [5]. The neutronic simulation allows to evaluate the computed reaction rates and, therefore by direct comparison with the measured values, to verify the suitability of the TAPIRO modelling approach, both code and data library. At present, the existing SERPENT model of TAPIRO [3] has been modified in order to describe the configuration of the reactor during the experimental campaign.
The sensitivity of integral parameters to cross section data plays a crucial role in the adjustment formalisms. Therefore, the second scope of this activity is to investigate the effect of the cross section data used in the prediction of the quantities measured in the experiments. The calculations will then be repeated using different cross section libraries and the results obtained will be compared. At last the use of the generalized perturbation approach will permit the evaluation of the sensitivity matrices for the reaction rates considered.
10. Sensitivity coefficients for copper density reduction.
The TAPIRO research reactor is well suited for minor actinides studies due to its particular spectrum variety starting from a hard spectrum in the central core, near to fission one, an intermediate spectrum in the copper reflector up to a moderated spectrum in the biological shielding.
The reliability and significance of the measurements carried out in TAPIRO are also influenced by the presence of a copper reflector, a peculiarity of this reactor leading to the variety of spectral zones discussed above. Therefore, to assess the influence of the uncertainty on the reflector properties on the MA measures, the capture reaction rates sensitivities for two different MAs, Am241 and Np237, after a 2% copper density reduction in the whole reflector, have been evaluated. Results for both the MAs are in correspondence of four different positions along one of the TAPIRO experimental channels, the diametral channel (at axial reactor mid-plane).
The four different positions analyzed along the diametral channel are:r=0.5 cm near the core centre (P1), r=12.07 cm near the core boundary (P2), r=24.58 cmat about the reflector center (P3) and r=45.5 cm at the entrance of the thermal column (P4).
The energy integratedcapture rates variations(total sensitivity), obtained by means of GPT (Generalized Perturbation Theory) [7] using a 49 energy groups grid for the calculations, for each actinide and position considered, are shown in Table 5.
Table 5. Capture rates variations by GPT for different radial positionsin TAPIRO. Integral capture rates variations
Position
0.5 cm 12.07 cm 24.58 cm 45.5 cm Isotope
Am241 -3.24E-03 -1.29E-02 9.04E-03 5.34E-02 Np237 -3.59E-03 -1.41E-02 8.04E-03 5.34E-02
The results show that, depending on the measurement position in TAPIRO, the effects on the MAs capture rates are different, and for the considered Cu cross sections perturbation less than 6% in absolute value.
The sensitivity coefficients are shown in Figures 7 through 10.
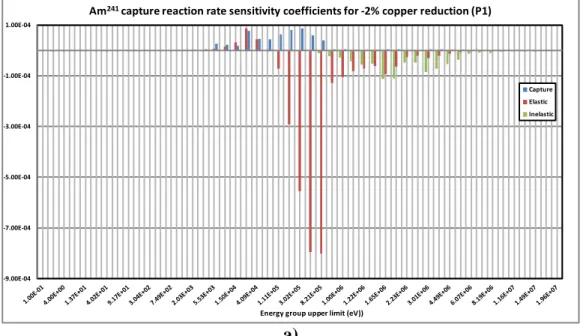
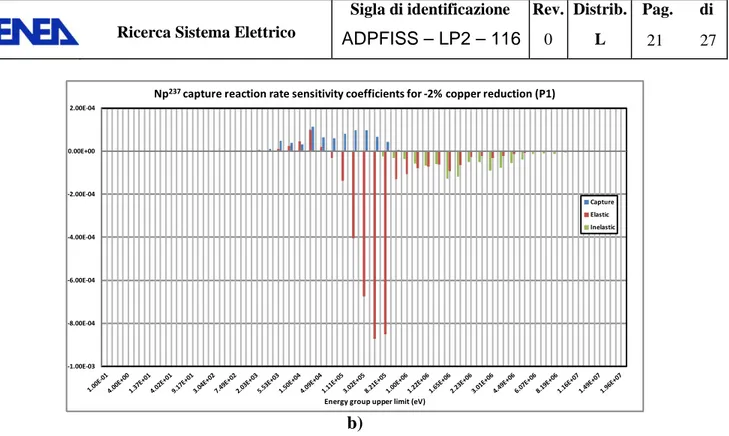
Figure 7:Am241(a) and Np237(b) capture reaction rate sensitivity coefficients in position P1.
-9.00E-04 -7.00E-04 -5.00E-04 -3.00E-04 -1.00E-04 1.00E-04
Am241capture reaction rate sensitivity coefficients for -2% copper reduction (P1)
Capture Elastic Inelastic
Energy group upper limit (eV))
-1.00E-03 -8.00E-04 -6.00E-04 -4.00E-04 -2.00E-04 0.00E+00 2.00E-04
Np237capture reaction rate sensitivity coefficients for -2% copper reduction (P1)
Capture Elastic Inelastic
Energy group upper limit (eV) b)
The sensitivity coefficients in the central core position for both nuclides, Figure 7, show that the main contribution to the capture rate reduction is due to the copper elastic scattering reactions, being the influence of capture and inelastic scattering negligible.
Figure 8:Am241(a) and Np237 (b) capture reaction rate sensitivity coefficients in position P2.
-3.50E-03 -3.00E-03 -2.50E-03 -2.00E-03 -1.50E-03 -1.00E-03 -5.00E-04 0.00E+00 5.00E-04 1.00E-03 1.50E-03 Capture Elastic Inelastic
Energy group upper limit (eV)
Am241capture reaction rate sensitivity coefficients for -2% copper reduction (P2)
-4.00E-03 -3.00E-03 -2.00E-03 -1.00E-03 0.00E+00 1.00E-03 2.00E-03
Np237capture reaction rate sensitivity coefficients for -2% copper reduction (P2)
Capture Elastic Inelastic
Energy group upper limit (eV) b)
The positive influence of the capture reactions start to be evident in the copper reflector at 12.07 cm from the core center, as shown in Figure 8 for both nuclides, even if the main contribution to the variation is due to the elastic scattering reactions.
Figure 9:Am241(a) and Np237 (b) capture reaction rate sensitivity coefficients in position P3.
-2.00E-03 -1.50E-03 -1.00E-03 -5.00E-04 0.00E+00 5.00E-04 1.00E-03 1.50E-03 2.00E-03 2.50E-03 Capture Elastic Inelastic
Energy group upper limit (eV)
Am241capture reaction rate sensitivity coefficients for -2% copper reduction (P3)
-2.00E-03 -1.00E-03 0.00E+00 1.00E-03 2.00E-03 3.00E-03
Np237capture reaction rate sensitivity coefficients for -2% copper reduction (P3)
Capture Elastic Inelastic
Energy group upper limit (eV) b)
In the reflector central position there is a change in the total variation that now is positive (cf. Table 5), and mainly due to the capture reactions even if the elastic scattering contribution is not negligible and in the opposite direction (i.e. negative).
Figure 10:Am241 (a) and Np237 (b) capture reaction rate sensitivity coefficients in position P4.
-1.00E-03 0.00E+00 1.00E-03 2.00E-03 3.00E-03 4.00E-03 5.00E-03 6.00E-03 7.00E-03 Capture Elastic Inelastic
Energy group upper limit (eV)
Am241capture reaction rate sensitivity coefficients for -2% copper reduction (P4)
-1.00E-03 0.00E+00 1.00E-03 2.00E-03 3.00E-03 4.00E-03 5.00E-03 6.00E-03 7.00E-03
Np237 capture reaction rate sensitivity coefficients for -2% copper reduction (P4)
Capture Elastic Inelastic
Energy group upper limit (eV) b)
At the entrance of the thermal column there is a positive contribution for all the reactions, being the main contribution to the total sensitivity due to elastic scattering reactions.
In all the cases taken into account the variation is mainly influenced by elastic scattering and capture reactions in the energy range from 20 eV to 800 keV.
By means of a direct approach (direct calculations of unperturbed and perturbed systems) the capture reaction rates for both Am241 and Np237 have been evaluated for all the different positions along the diametral channel, and have been compared with the total sensitivities evaluated by means of GPT, Tables 6 and 7.
Table 6. GPT and direct approach results comparison for Am241.
Am241 Position
0.5 cm 12.07 cm 24.58 cm 45.5 cm Isotope
GPT -3.24E-03 -1.29E-02 9.04E-03 5.34E-02 Direct -3.14E-03 -1.33E-02 8.76E-03 5.58E-02 Table 7. GPT and direct approach results comparison for Np237.
Np237
Position
0.5 cm 12.07 cm 24.58 cm 45.5 cm Isotope
GPT -3.59E-03 -1.41E-02 8.04E-03 5.34E-02 Direct -3.51E-03 -1.48E-02 7.48E-03 5.59E-02
11. Conclusions
In the frame of the NEA Expert Group on Integral Experiments for Minor Actinide Management, a joint collaboration between ENEA and CEA was established with the aim to study the feasibility of a MAs irradiation campaign, named AOSTA (Activation of Osmose Samples in TApiro), in the TAPIRO fast neutron source research reactor located at the ENEA Casaccia center near Rome. Results from previous irradiation campaign simulations indicate the feasibility of the AOSTA experimental campaign.
This work is focused on a preliminary analysis of the sensitivity of the response of the MAs reaction rates, essentially capture, to the TAPIRO copper reflector nuclear data. Experimental uncertainties on Cu nuclear data have been simulated, in this preliminary approach, by a uniform change on the Cu reflector density. The sensitivity coefficients of the MAs reaction rates to Cu cross section variations have been estimated by means of both Generalized Perturbation Theory (GPT) and direct approach by deterministic calculations.
The results show that, depending on the measurement position in TAPIRO, uncertainties on the Cu nuclear data may play different roles, even as order of magnitude, on the experimental results. Of course further investigations, by means of Cu variance-covariance nuclear data matrices, are needed to find optimal measurement positions with regard to both neutron spectrum entering the samples and influence of Cu cross sections uncertainties on the measured MAs reaction rates.
A preliminary work has been performed to verify the feasibility of an adjustment procedure when applied to multigroup cross section data generated for the TAPIRO reactor. The exercise has demonstrated the applicability of the technique and its capability to produce reasonable and consistent results. The issue regarding the availability of the variance-covariance matrix for the cross sections of interest in the analysis of MA is going to be addressed in future works.
12. Acknowledgments
The authors are grateful to Patrick Blaise (CEA, France) and Benoit Geslot(CEA, France) for their support in this activity.
13. References.
[1] https://www.oecd-nea.org/science/ma/.
[2] http://www.enea.it/en/research-development/documents/nuclear-fission/tapiro-eng-pdf.
[3] M. Carta et al., “Feasibility study of the AOSTA experimental campaign”, WONDER 2015: Fourth International Workshop on Nuclear Data Evaluation for Reactor Applications, 5-8 October 2015, Aix-en-Provence (France). EPJ Web of Conferences 111, 07003 (2016). ISBN: 978-2-7598-1970-6.
[4] “Americium-241 integral radiative capture cross section in over-moderated neutron spectrum from pile oscillator measurements in the Minerve reactor”, B. Geslot et al, int. Conf. On Nuclear Data (ND2016), September 11-18, 2016, Brugge, Belgium.
[5] G. Rimpault et al., ‘The ERANOS code and data system for fast reactor neutronic analyses’, Proc. PHYSOR 2002, Seoul, Korea, October 7-10, 2002.
[6] http://montecarlo.vtt.fi.
[7] A. Gandini, "Generalized Perturbation Theory (GPT) Methods. A Heuristic Approach", in Advances in Nuclear Science and Technology, Vol. 19, Plenum Press, New York, 1987.
[8] G. Rimpault, “Physics documentation of the ERANOS. The ECCO cell code”, CEA Technical Note RT-SPRC-LEPh-97-001, 1997.
[9] G. Palmiotti, “BISTRO: BIdimensionnel Sn Transport Optimise”, CEA Technical NOTE NT-SPRC-LEPh-84-270, 1984.
[10] J. Leppanen, Development of a New Monte Carlo Reactor Physics Code, VTT publications, 2007.
[11] R. A. Forrest, "FISPACT-2007: User manual", EASY Documentation Series, EURATOM/UKAEA Fusion Association, Culham Science Centre.
[12] J. -Ch. Sublet, L. W. Parker, J. Kopecky, R. A. Forrest, A. J. Koning, D. A. Rochman, "The European Activation File: EAF-2010 neutron-induced cross section library", EASY Documentation Series.
[13] http://www.ccfe.ac.uk/EASY.aspx
[14] X-5 Monte Carlo Team “MCNP: A General Monte Carlo Transport Code” LA-CP-03-245, April 24, 2003 (Revised 10/3/05).
[15] Y. Ronen, Uncertainty analysis, Boca Raton: CRC Press, 1988.
[16] S. Di Lella, “Applications of methods for the adjustment of nuclear data using experimental measurements on the TAPIRO reactor,” Masters’ thesis, Politecnico di Torino, 2015.
14. Working group CV
Il gruppo di lavoro impegnato nell'attività opera presso il Dipartimento Energia del Politecnico di Torino ed è costituito da un professore ordinario(P. Ravetto, fisica dei reattori nucleari), un professore associato (S. Dulla, fisica dei reattori nucleari) e un dottorando (D. Caron) iscritto al III anno di Dottorato in Energetica. Il gruppo ha una lunga esperienza nella ricerca nel campo della fisica dei reattori nucleari, con particolare enfasi sulla neutronica dei sistemi innovativi. L’attività di ricerca svolta negli ultimi anni ha riguardato principalmente lo sviluppo di metodi per il trasporto neutronico e per la dinamica dei reattori, in particolare per applicazioni ai sistemi nucleari avanzati (ADS e reattori innovativi), con applicazione a codici di multifisica e l’interpretazione di misure sperimentali in sistemi sottocritici per il monitoraggio della sottocriticità.
Maggiori dettagli e l'elenco delle pubblicazioni più recenti dei membri del gruppo si possono trovare sul sito Web del Politecnico di Torino:
http://porto.polito.it/view/creators/Ravetto=3APiero=3A000919=3A.html http://porto.polito.it/view/creators/Dulla=3ASandra=3A011663=3A.html

![Table 3. Energy structure adopted for the flux calculations of TAPIRO. Group, g Upper energy, E g-1 [MeV] Lower energy, E g [MeV]](https://thumb-eu.123doks.com/thumbv2/123dokorg/5606398.67955/16.918.100.823.167.1076/table-energy-structure-adopted-calculations-tapiro-lower-energy.webp)