https://doi.org/10.1177/1351010X17728596 Building Acoustics 2017, Vol. 24(3) 173 –191 © The Author(s) 2017 Reprints and permissions: sagepub.co.uk/journalsPermissions.nav
DOI: 10.1177/1351010X17728596 journals.sagepub.com/home/bua
Experimental evaluation of the
sound absorption and insulation
of an innovative coating through
different testing methods
Fabio Scamoni
1, Edoardo A Piana
2and Chiara Scrosati
1Abstract
The Lombardy Region and the Construction Technologies Institute of the National Research Council of Italy are promoting the development of an innovative coating nano-material for building retrofitting. The research aims at obtaining a material with higher sound absorption features when compared to conventional plasters, as well as fair thermal and sound insulation performances. In both design and testing stages, it is important to identify and measure key acoustic parameters. This article presents the characterisation of the new material in terms of sound absorption and insulation by means of reverberation room, impedance tube, sound transmission rooms and mobility measurements, together with a discussion on the limits and reliability of the different methods in relation to the specific frequency range and the peculiarities of the material under test. This study contributes to the definition of test procedures that can be applied to other noise-reducing treatments including meta-materials.
Keywords
Acoustic materials, noise-reducing materials, sound absorption, sound insulation, sandwich structures, impedance tube, point mobility, reverberation
Introduction
The need for more environment friendly and energy efficient solutions in building sector,1,2 the
increasing noise pollution due to transportation and the growing desire for a quiet home to find relief from workday stress are some of the driving forces behind the increasing development of multipurpose construction materials with good thermal and acoustic properties.3,4 The sound
insu-lation characteristics of materials are usually determined in laboratory according to standard ISO 101405 series for building elements, while the sound absorption properties are usually determined
1ITC-CNR, Viale Lombardia, 49, San Giuliano Milanese, 20098 Milano, Italy 2Applied Acoustics Laboratory, University of Brescia, Brescia, Italy
Corresponding author:
Fabio Scamoni, ITC-CNR, Viale Lombardia, 49, San Giuliano Milanese, 20098 Milano, Italy. Email: [email protected]
in reverberation rooms according to standard ISO 3546 for diffuse incidence and in impedance tube
according to standard ISO 10534-27 for normal incidence.
The starting point in the development of an innovative material is a theoretical study to obtain the desired acoustic properties for the new product. During the development stage, often it is not possible to produce large quantities of materials; thus, the availability of reliable test methods requiring only small samples of material is an appealing option to rapidly examine different solu-tions and to select the most suitable composition for the application the material is intended for. On the other hand, when the final application requires the use of the new material on large surfaces, such as building walls, full-scale tests are the only way to assess the product performances under field conditions. Both the approaches have therefore upsides and downsides that must be evaluated according to the specific study and, in order for the characterisation process to be effective, one must be able to read the results from each method and, where applicable, to make correlations between them.
The aim of this article is twofold: to characterise an innovative coating nano-structured material aimed at building retrofitting and studied during a joint research by Lombardy Region and ITC,8
and to present and compare different available methods for the acoustic characterisation of experi-mental materials, in order to highlight strengths, weaknesses, equivalence and complementarity points. Therefore, the nano-coating has been tested by means of both approaches, and the results obtained in terms of sound absorption and sound insulation performances are presented and discussed.
Sound absorption and insulation measurement methods
Sound absorption measurement methods
The most used international standards available for the determination of the sound absorption are ISO 3546 and ISO 10534-2.7 These two standards implement a test method requiring reverberation
rooms and a test method based on an impedance tube, respectively. The main difference between the two methods lies in the sound angle of incidence and in the size of the required samples. The reverberation room method allows one to determine, under ideal conditions, the sound absorption coefficient for diffuse sound incidence, and it can be used to test materials with pronounced struc-tures in the lateral and normal directions. The reverberation room method requires rather large test samples (the test sample shall have an area between 10 and 12 m2), so it is not practical at research
and development stage when usually only small samples of the absorber are available. The imped-ance tube method is generally adopted to carry out parametric studies at normal incidence since it requires samples of the same size as the cross section of the impedance tube, that is, a few square centimetres. Given the small dimension of the tested specimens, they may not represent the aver-age behaviour of the material, which is often affected by inhomogeneity and production variability. Moreover, a recent work by Pompoli et al.9 shows that, despite the existence of a well-established
standard, the achievement of inter-laboratory reproducibility is not straightforward.
According to Annex F of ISO 10534-2,7 the diffuse incidence sound absorption coefficient can
also be estimated from measurement results obtained by the impedance tube method, but only for locally reacting materials. Another approach for this type of materials was proposed by McGrory et al.,10 using a statistical analysis to establish a relationship between the absorption coefficients
resulting from impedance tube and reverberation room. However, despite being porous, the materi-als tested in this work cannot be considered as locally reacting because of the continuity existing between laterally adjacent points in the surface layer. Moreover, as outlined by Jeong,11 a perfectly
with respect to the test sample and to the room geometry. These considerations must be kept into account when examining the sound absorption values obtained with the two methods. A summary of the main characteristics of reverberation room and impedance tube sound absorption measure-ment techniques is shown in Table 1.
Measuring techniques for sound insulation
The sound insulation of a partition is usually expressed by the sound reduction index R, in decibels. The most commonly used method for the measurement of the sound reduction index is described in standard ISO 101405 series based on the measurement of time- and space-average of the sound
pressure level in two rooms separated by the partition under test. The standard accounts for the modal behaviour of the rooms occurring below the Schroeder frequency, by introducing an addi-tional measurement procedure under 400 Hz which allows the sound field in the centre of the room to be considered diffuse. Nevertheless, under 100 Hz, the measurement uncertainty is still high12
and this behaviour is found also in on-site measurements.13,14 From a theoretical point of view, the
sound reduction index for diffuse sound field R is a function of the sound transmission coefficient for diffuse incidence τd
R= −10logτ (1)d τ τ ϕ ϕ ϕ ϕ ϕ d lim d =2
∫
( )
0 cos sin (2)where φlim is the limit angle for the maximum sound incidence of the acoustic wave on the panel.
According to Cremer,15 the sound transmission coefficient τ(φ) for a thin homogeneous panel can
be written as a function of the critical frequency fc, the mass per unit area μ″ and the overall loss
factor ηtot τ ϕ µ ω ρ ϕ ϕ η µ ω ρ ( )= + ′′ cos (sin ) co + ′′ 1 2 2 2 4 2 c f fc tot c ssϕ (sinϕ) f fc − − 2 4 2 1 1 (3)
where ω is the angular frequency and ρc is the wave impedance of the air at room temperature. For homogeneous single leaf panels, the critical frequency is defined as the frequency at which the trace matching between flexural waves on the panel and waves in the surrounding medium can occur
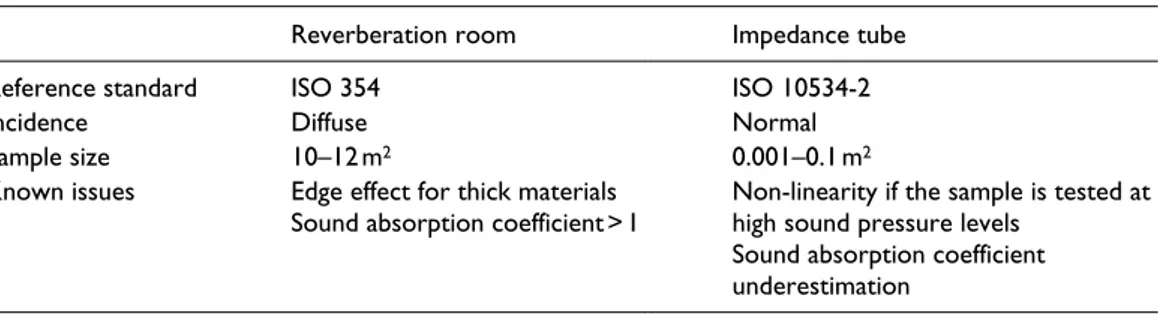
Table 1. Characteristics of measuring methods for sound absorption.
Reverberation room Impedance tube
Reference standard ISO 354 ISO 10534-2
Incidence Diffuse Normal
Sample size 10–12 m2 0.001–0.1 m2
Known issues Edge effect for thick materials
Sound absorption coefficient > 1 Non-linearity if the sample is tested at high sound pressure levels Sound absorption coefficient
f c D c = ′′′ 2 2π µ (4) where D′ is the bending stiffness per unit width of the structure and, for homogeneous structures, it can be considered constant in the frequency range of interest. In this case, the bending stiffness can be easily computed from Young’s modulus E and the thickness h of the wall
′ =
D Eh3
12 (5)
For more complex structures, such as sandwich materials, the bending stiffness is frequency-dependent and can be replaced by an apparent bending stiffness per unit width ′Dx, which, as shown in Nilsson and Liu,16 can be described by the following equation
A f D B f D D C x x x ′3 2/ − ′1 2/ + ′ − =0 (6) Parameters A, B and C depend on the geometric, physical and mechanical properties of the panel, some of which are seldom known beforehand and difficult to estimate. For this reason, ′Dx
can be determined using experimental methods. Depending on the type, size and mounting condi-tions of the product to be tested, the apparent bending stiffness can be determined by two simple test procedures that proved to give consistent results.17 The former procedure is based on the
meas-urement of the natural frequencies of suspended beams, cut from a panel of the tested material and generally provides accurate results with limited experimental and computational effort.18,19
However, when the panels under investigation are very large20 or already installed,21 they cannot
be brought inside the sound transmission rooms, nor beams can be cut away from them. In this case, the apparent bending stiffness can be estimated by point mobility measurements.20 The latter
procedure was used for sound insulation estimations proposed in this work.
A space- and frequency-average of the real part of the point mobility, measured on a finite struc-ture in positions far from the boundaries, is equal to the real part of the point mobility of an equiva-lent infinite structure16
ReY( )ω =Re(Y∞( )ω ) (7)
This statement is typically valid in the medium- to high-frequency range, where the modal den-sity within a certain frequency band is quite high and then does not depend on the size and on the boundary conditions of the panel. In the low-frequency range, with a poor modal density, this assertion still applies if at least five modes are included in an extended frequency band.20 The
space-average of the point mobility can be considered representative of the dynamic properties of the panel, provided that the mobility is measured over a sufficiently high number of points and that such points are randomly distributed over the panel surface. If these conditions are satisfied, the frequency- and space-average of the mobility can be written as
ReY Dx = ′ ′′ 1 8 µ (8)
As a consequence, the bending stiffness per unit width at the central frequency of each fre-quency band is obtained from
′ = ′′ D Y x 1 64µ [Re ]2 (9)
Once the mobility measurements have produced a dataset of the type (fk; ′Dxk), the least squares
(LS) method can be applied to find a frequency-dependent bending stiffness function through equation (6). In turn, this function can be used to compute the sound reduction index of the panel, according to equations (1)–(4).
Experimental campaign
Description of the coating nano-material
The innovative material is a low-carbon-footprint plaster made of nano-structured compounds, pure and eco-friendly binder (ultra-low CO2 emission) and recycled raw materials (cellular glass,
inerted fly-ashes). In particular, the binder is a non-conventional compound with sulphoaluminate and inorganic nano-composites. The material includes cellular-glass waterproof non-capillary micro-sphere aggregates for thermal insulation, acicular aggregates to enhance tensile and bending resistance and organic polyolefin fibres to improve laying and sound absorption capability. The density varies between 390 and 420 kg/m3. Main fields of application include the following:
•
• Plastering of outer walls to decrease sound reflections in noisy, densely populated areas (e.g. near airport areas8 and urban canyons22);
•
• Plastering of inner walls to increase stiffness and sound absorption in all the situations where the traditional absorbing systems cannot be applied (e.g. schools in seismic areas); •
• Plastering of inner and outer solid, perforated, new and old brick masonry walls for sound insulation improvement.
The nano-material under test offers interesting possibilities when compared to traditional coat-ings. In particular, its behaviour can be easily varied depending on the percentage of the different elements: the addition of cellular glass makes the coating more porous, giving it a greater sound absorption capability; on the other hand, if the coating is less porous and added with alumina, the stiffness can be fairly increased.
Sound absorption measurements
The sound absorption characteristics of the material were tested according to the procedures described in ISO 3546 and in ISO 10534-27 standards. To determine the sound absorption
coeffi-cient of the material when subjected to a diffuse sound field in the reverberation room, at least 10 m2 of sample are required. On the other hand, for the determination of the normal incidence
sound absorption coefficient, a 60-mm-diameter test sample is adequate to cover the frequency range from 100 to 3150 Hz.
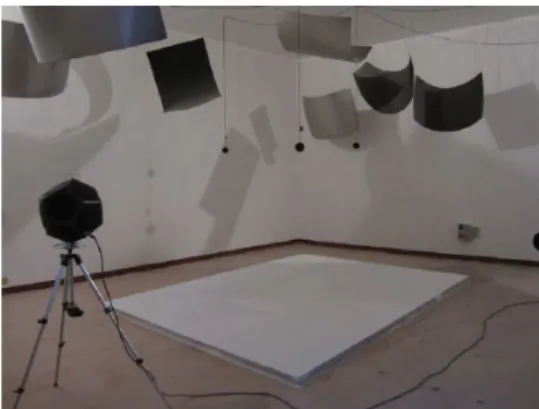
The material has been laid into 1 m × 1 m shutterings and dried with a curing time of 3 weeks. The square tiles obtained in this way have then been laid on the reverberation room floor close to each other, and sealed with silicone to avoid leakages between tiles, so to obtain an overall testing surface of 12 m2. Figure 1 shows the tested sample laid on the floor of the room. The reverberation
time inside the room was determined before and after the installation of the sample, in six receiving microphone positions distributed in the room at different heights and for three source locations,
with three sets of measurements performed at each microphone/loudspeaker position. The meas-urements were carried out using the interrupted noise method.
The sound absorption of the coating was measured for two thicknesses: 60 mm, corresponding to the thickness of an external coating, and 20 mm, corresponding to the typical thickness of an internal lining. The samples were also tested with a finish layer consisting of a thin paint layer spread on the absorbing side.
The normal incidence absorption coefficient was measured in an impedance tube. The 60-mm diameter sample was cut from a tile of the same material tested in the reverberation room. The sample has been cut slightly undersize with respect to the sample holder diameter and sealed around the edges using petroleum jelly. The sample has then been placed into the sample holder and kept in the correct position by means of double-sided adhesive tape. Once mounted, any remaining gap between the sample and the sample holder has been completely filled with petro-leum jelly so to avoid air leakages that may have a dramatic impact on the results. The equipment used is a BSWA SW260 impedance tube (Figure 2).
The thicknesses tested are the same used for the measurements in the reverberation room. The test signal used is a sine sweep from 30 to 3300 Hz, with a duration of 30 s. The sweep was recorded using two 1/4″ microphones connected to a multichannel analyser. The .wav files were then post-processed computing the impulse response after convolving them with the inverse filter, deriving the transfer functions and applying the procedure described in standard ISO 10534-2.7
Sound insulation measurements
Sound transmission rooms method. The nano-material under test was designed as a coating for an
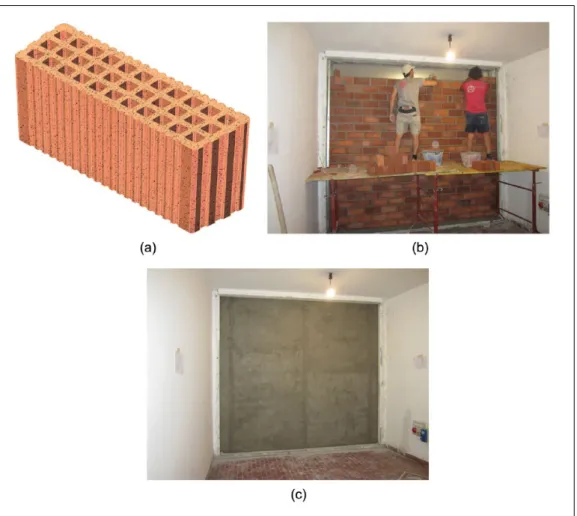
existing wall, so its insulation properties were estimated on a double brick wall (double basic wall), consisting of two identical walls of 80 mm in thickness, separated by a 100-mm air gap. Each of the two walls consists of perforated bricks (dimensions D × H × L: 80 × 120 × 280 mm) with void percentage below 45% (Figure 3) and was assembled using a concrete compound to fill the hori-zontal and vertical brick courses. The double basic wall, whose mass per unit area is 220 kg/m2,
was coated on both sides with a concrete compound of 10 mm in thickness. The total thickness of the double basic wall is 280 mm. Therefore, the double basic wall does not present any leakages, that, otherwise, may have a considerable impact on its sound reduction index, so the changes found in the sound insulation can be attributed exclusively to the nano-material applied to the basic wall. The tests were performed on the double basic wall, on the double basic wall coated with the nano-material on the external side (60 mm in thickness), and finally on the double basic wall coated on
both sides (60 mm external and 20 mm internal, with a mass per unit area equal to 255 kg/m2). The
dimensions of the wall under test are 3.3 m × 3.0 m. Measurements of the double basic wall were repeated until the sound reduction index curve trend did not show significant variations.23 For the
Figure 2. Impedance tube used for normal incidence sound absorption tests.
Figure 3. From left to right: (a) brick type, (b) installation in laboratory of the double basic wall and (c)
double basic wall coated with 60 mm external lining, the curing time was about a month, while for the internal lining the curing time was about 2 weeks.
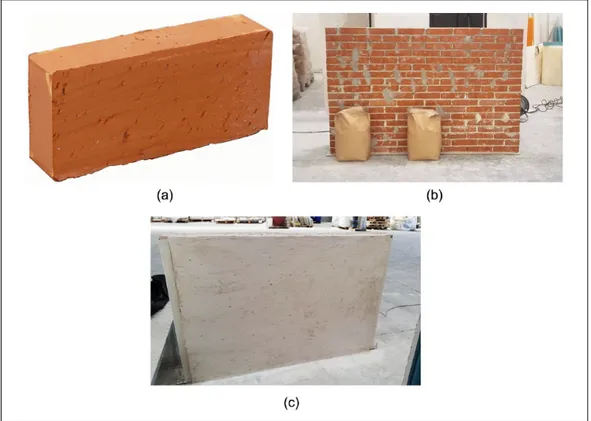
Point mobility method. The tests for the determination of the influence of the coating according to
the point mobility method were carried out on a 120 mm-thick masonry brick wall and dimensions 1.78 m × 1.05 m. The 120 mm × 55 mm × 250 mm solid bricks used were assembled using a concrete compound to fill the horizontal and vertical brick courses. The single basic wall with no coating and the wall with 15 mm coating on the two sides were tested. As pointed out in the previous sec-tions, the mass per unit area of a structure, its bending stiffness and the value of the total losses are the three main parameters for the calculation of the sound reduction index according to the point mobility method (equation (3)). The mass per unit area of the uncoated wall is 276 kg/m2. Such
sample is equivalent to a homogeneous panel, whose constant bending stiffness can be calculated by means of equation (5). The same brick wall was then finished with 15 mm of plaster made by a particular compound of the nano-composite material under investigation (Figure 4), with a slightly different composition when compared to the one used for sound absorption tests. In this case, the compound is stiffer because of the addition of alumina and steel fibres. The mass per unit area for the coated wall is 426 kg/m2.
In both cases, the determination of the sound reduction index was carried out by measuring a space- and frequency-average of the point mobility over 20 measurement positions randomly dis-tributed on the surface of the wall, at a minimum distance of 150 mm from the edges. The
Figure 4. From left to right: (a) brick type, (b) single basic wall and (c) coated wall used for point mobility
measurements were carried out using a multichannel analyser, a PCB impact hammer 086C03 and a PCB 352C33 accelerometer.
The apparent bending stiffness function was computed by applying the LS method to the experi-mental frequency-dependent bending stiffness points, according to equation (6). The impulse responses, obtained in the various measurement positions, were post-processed to determine the total losses through the structural reverberation time technique.24
Results and discussion
Sound absorption coefficient
Figure 5 shows the sound absorption coefficient results, measured in the reverberation room for 12 m2 of material, thickness 60 mm, with and without finish, where the sound absorption
coeffi-cient αs is the ratio of the equivalent sound absorption area of the test sample divided by the area of the test sample.
The sound absorption coefficient seems to be slightly higher for the 20-mm sample in the low- to medium-frequency range (from 250 to 500 Hz) and in the high-frequency range (from 2500 to 5000 Hz). This result can be explained by the laying procedure: since the product is added in layers, the surface of the 60-mm sample is more compact than the surface of the corresponding 20-mm sample. The result is that the porosity of the 20-mm sample is more open than that of the 60-mm sample and therefore the resulting absorption is higher.
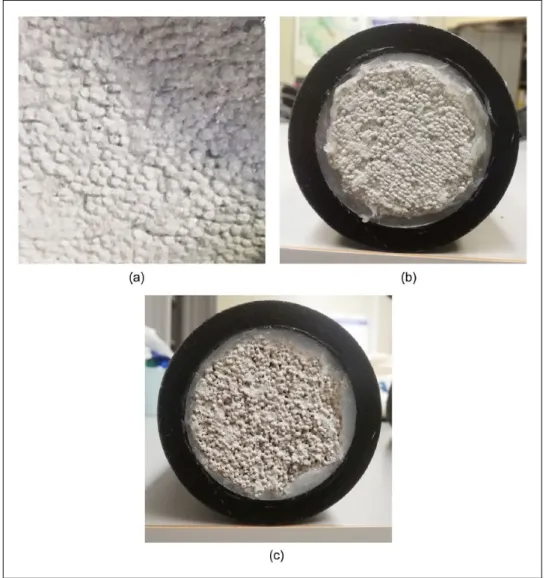
Some tiles of the same material tested in the reverberation room are used to obtain the samples for the impedance tube, after scraping the finish layer off the surface. The results of the measure-ments are shown in Figure 6.
Measurements on the 60-mm sample provide similar values to those obtained in reverberation room on the finished sample. The 20-mm sample shows on average higher sound absorption val-ues, which confirms the trend recorded in reverberation room. Differently from what obtained for the 60-mm sample, the effect of scraping emerges above 630 Hz, when porosity is open and absorp-tion capability increases. The different behaviour displayed by the two samples is arguably due to the variability in the manual scraping operation. As previously mentioned, the surface of the sam-ple exposed to the sound field had already been painted for the diffuse-field tests, so the samsam-ples had been treated in order to remove both the finishing and an additional layer of material that looked packed together. The amount of material to be removed was evaluated by visual inspection, but the comparison between Figure 7(b) (60 mm) and Figure 7(c) (20 mm) reveals that very differ-ent surfaces were created by this operation in the two cases.
The nano-structured plaster, which is composed by eco-friendly and recycled raw materials, shows an absorption behaviour similar to that of other mortars having some natural materials derived from waste from agricultural processing25 in their composition, which are characterised by
absorption coefficient values varying between 0.2 and 0.3. In the case of the tested nano-structured plaster, the absorption coefficient values vary between 0.1 and 0.3 with a maximum around 2000 Hz for diffuse incidence, and between 0.15 and 0.3 with the maximum value observed at 3150 Hz for normal incidence.
Sound insulation
Figure 8 shows the results of the tests carried out in sound transmission rooms on the uncoated (double basic wall) and on the coated wall. The composition of the coating is the same as in the case of sound absorption measurements; the material density is around 400 kg/m3.
Figure 5.
Sound absorption coefficient for diffuse incidence (reverberation room) of (a) 60-mm sample with (solid line) and without finis
h (dashed line)
Figure 6.
Sound absorption coefficient for normal incidence (impedance tube), for scraped samples of different thickness: (a) 60
mm and (b) 20
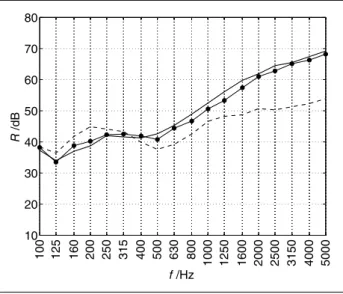
It can be observed that the curves are modified by the application of the plaster, especially above 500 Hz, where the slope changes from 5 to 8 dB/oct. Since the sound reduction index depends on the bending stiffness of the structure and on the losses, this behaviour may be related to the increase in these parameters introduced by the additional layers. Moreover, the application of the coating layers changes the mass per unit area of the two leaves, making them different from each other. The local minimum at 125 Hz corresponds to normal modes (0, 1) and (1, 0) of the wall.
Considering the single number quantity (SNQ), that is, the weighted sound reduction index Rw,
the following considerations can be done: the improvement of sound insulation due to the applica-tion of the material on the external side is equal to 3 dB; by adding the addiapplica-tional 20 mm to the internal side, the improvement of the sound insulation increases by one extra decibel. The SNQs are shown in Table 2.
Figure 7. Samples used in the tests: (a) finished coating material as used in the reverberation room, (b)
Figure 9 shows the results of the mobility measurements for the single basic wall and for the coated wall. As pointed out in the previous paragraphs, the two basic walls, double and single, are different: the double basic wall, used to measure the sound reduction index in the transmission rooms, is a double wall made of perforated bricks with 100-mm air gap, while the single basic wall, used to measure the point mobility, is a single wall made of solid bricks. Moreover, the coating used for point mobility measurements has higher density (700 kg/m3) because originally meant to
ensure enhanced anti-seismic properties.26
The mobility measurements for the uncoated wall distinctively show a modal behaviour at low frequency, while peaks start overlapping above 100 Hz. The mobility values are higher for the single basic wall when compared to the coated wall, indicating that the application of alumina-rich material makes the sample stiffer. Moreover, for the coated wall, the peaks in the bending stiffness plot start overlapping at frequencies above 200 Hz.
Figure 10(a) shows the comparison of the bending stiffness for the single basic wall and for the coated wall. The uncoated wall has a constant bending stiffness that can be computed on the basis of Young’s modulus of the bricks and the thickness of the wall. On the other hand, for the coated wall, the experimental bending stiffness points calculated by mobility measurements are well approximated by the function represented by equation (6), which suggests that the wall can be considered a sandwich panel due to the stiffness of the coating material.
Figure 8. Sound reduction index of the basic and the coated wall. Dashed line: uncoated wall; solid line
with bullets: 60 mm external coating; solid line: both sides coated, 60 mm external and 20 mm internal.
Table 2. Weighted sound reduction index, Rw, with spectrum adaptation terms C and Ctr, of the measured
systems, in transmission rooms.
Double basic wall 60 mm out 60 mm out + 20 mm in
Rw 46 49 50
C −1 −2 −2
Figure 9.
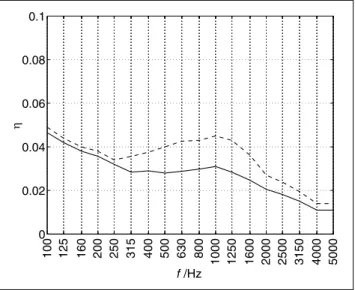
From the point of view of sound insulation, the change in the sound reduction index is shown in Figure 10(b) and confirms that the application of the material substantially changes the properties of the wall. In particular, the sound reduction index in the low-frequency range is considerably higher around the coincidence region of the single basic wall, and the critical frequency is shifted from 200 to 360 Hz because of the increased mass per unit area with an almost equivalent static bending stiffness. Differently from the behaviour observed in sound transmission rooms, in this case, the wall insulation above the coincidence region decreases with the application of the coat-ing. The reason may lie in the different effect that the application of the coating has on the original wall in terms of loss factor, in particular at and above the coincidence region. The predictions shown in Figure 10(b) were obtained using the losses measured on the tested samples as input data (Figure 11). The evaluation of the losses was carried out using the structural reverberation time technique applied on the wall built for the tests, thus including radiation and internal losses. Since the wall was not fixed to any other structure, the components due to the presence of adjoining structures are not considered, and this causes the coincidence dip to be sharper than expected, especially for the uncoated sample. Below the coincidence region, the mass law is dominating the sound reduction index and the losses have only minor or no effects. At higher frequencies, the sound reduction index curve is considerably flatter for the coated wall due to the addition of a rigid layer, which increases the stiffness and reduces the losses.
Despite the very different behaviour of the two curves in Figure 10(b), the weighted sound reduction index in the two cases is the same (Rw = 48 dB), while the corrections C and Ctr increase from (−3; −7) dB for the uncoated wall to (−1; −3) dB for the coated wall. Finally, from the same graph of Figure 10(b), it can be concluded that the mass law does not provide a good estimation of the single basic wall sound reduction index.
Conclusion
In this article, an innovative coating nano-structured material, aimed at building retrofitting, has been experimentally evaluated from the point of view of sound absorption and sound insulation performances. Both standardised and simplified methods have been used, to the aim of exploring the possibility of applying them during the development stage, when the production of the large quantities required for the standardised methodologies is usually expensive.
The tested material is a low-carbon-footprint plaster obtained from waste and recycled com-pounds. In terms of sound absorption, the coating is similar to other materials containing waste composites. Sound absorption measurements were carried out using both an impedance tube and a reverberation room. The former measurement is relatively simple, quick to perform and not very demanding in terms of sample size. On the other hand, this method only allows to determine the normal incidence sound absorption coefficient, and in general it should not be used to evaluate the diffuse-field absorption behaviour of stiff materials. The reverberation room measurements are suitable to estimate the diffuse incidence sound absorption coefficient and require at least 10 m2
surface of the absorbing material, which is a downside in terms of cost and experimental effort, but ensures that the results are representative of the average behaviour of the material. On the other hand, the small samples used in impedance tube tests can only provide local information: as shown in this study, different results may therefore be obtained for a nominally identical material in case of production or application variability. The addition of a surface finish (paint) considerably degrades the coating performances, especially in the medium-high-frequency range. However, the application of this innovative nano-plaster can lead to moderate benefits if used for large surfaces: on outer walls, it can decrease sound reflections in noisy, densely populated areas (e.g. near airport areas and urban canyons), and on inner walls it can be used to increase stiffness and sound
Figure 10.
(a) Bending stiffness of the single basic wall (equation (5), horizontal grey line), and of the coated wall (equation (6), bla
ck line) as obtained from
LS applied to mobility measurements (bullets) and (b) sound reduction index calculated with equations (1)–(3) (in black) and
with mass law (in grey) for the
absorption in all the situations where the traditional absorbing systems cannot be applied (e.g. schools in seismic areas).
The evaluation of the sound insulation was done using both transmission rooms method and point mobility method. Measurement in transmission rooms, performed on the double basic wall and on the externally coated and internally/externally coated wall, showed that the sound reduction index curve is modified by the application of the nano-composite plaster. In particular, considering
Rw, the improvement of sound insulation due to the application of the material on both sides of a double wall, made of two leaves of perforated bricks separated by an air gap, is equal to 4 dB. The evaluation made using the point mobility method was carried out by comparing the sound reduc-tion index of a simple brick wall without plaster to that of the same wall plastered on both sides. While the single basic wall can be considered a homogeneous material and displays a poor sound reduction index in the low-frequency range, the plastered wall behaves like a layered material and its insulation properties can be estimated using the sandwich theory. The difference found in the trend of the sound reduction index confirms that the application of the plaster modifies the proper-ties of the wall at and above the coincidence frequency, changing the losses of the wall on which it is laid. If the stiffer version of the plaster is used, the coincidence frequency of the wall can be noticeably modified.
Possible future developments of the study include the experimental measurement of the coating properties laid on a real building, the systematic analysis of the coating performance dependency on composition and porosity, and the optimisation of the material aimed at obtaining a general purpose plaster suitable for several types of retrofitting applications.
Acknowledgements
The authors would like to thank Delta Phoenix Srl, and in particular Stefano Sacrato, for producing, delivering and installing the material. The authors gratefully acknowledge Paolo Cardillo of Construction Technologies Institute for revising the English text of the manuscript.
Figure 11. Losses computed by applying the structural reverberation time technique on the single basic
Declaration of conflicting interests
The author(s) declared no potential conflicts of interest with respect to the research, authorship and/or publi-cation of this article.
Funding
The author(s) disclosed receipt of the following financial support for the research, authorship, and/or publica-tion of this article: The laboratory measurements were co-founded by Lombardy Region and ITC-CNR. The material was developed in the framework of the NINIVE project, sponsored by the Lombardy Region and the Italian Ministry of University and Research MIUR.
References
1. Terkaj W, Danza L, Devitofrancesco A, et al. A semantic framework for sustainable factories. Proc
CIRP 2014; 17: 547–552.
2. Salamone Belussi L, Danza L, Galanos T, et al. Design and development of a nearable wireless system to control indoor air quality and indoor lighting quality. Sensors 2017; 17: 1–17.
3. Asdrubali F, Schiavoni S and Horoshenkov KV. A review of sustainable materials for acoustic applica-tions. Build Acoust 2012; 19(4): 283–312.
4. Schiavoni S, D’Alessandro F, Bianchi F, et al. Insulation materials for the building sector: a review and comparative analysis. Renew Sust Energ Rev 2016; 62(1): 988–1011.
5. ISO 10140-2:2010. Acoustics – laboratory measurement of sound insulation of building elements – part 2: measurement of airborne sound insulation.
6. ISO 354:2003. Acoustics – measurement of sound absorption in a reverberation room.
7. ISO 10534-2:1998. Acoustics – determination of sound absorption coefficient and impedance in imped-ance tubes – part 2: transfer-function method.
8. Scrosati C, Scamoni F, Piana EA, et al. Innovative and sustainable coating system: preliminary acoustic evaluation results. In: Proceedings of the 24th international congress on sound and vibration (ICSV
2017), London, 23–27 July 2017.
9. Pompoli F, Bonfiglio P, Horoshenkov KV, et al. How reproducible is the acoustical characterization of porous media? J Acoust Soc Am 2017; 141(2): 945–955.
10. McGrory M, Castro Cirac D, Gaussen O, et al. Sound absorption coefficient measurement: re-examining the relationship between impedance tube and reverberant room methods. In:
Proceedings of the Australian Acoustical Society conference, acoustics 2012: acoustics, develop-ment, and the environment (ed T McMinn), Fremantle, WA, Australia, 21–23 November 2012,
pp. 135–142. Magill North, SA: AAS.
11. Jeong CH. A correction of random incidence absorption coefficients for the angular distribution of acoustic energy under measurement conditions. J Acoust Soc Am 2009; 125(4): 2064–2071.
12. Wittstock V. Determination of measurement uncertainties in building acoustics by interlaboratory tests. Part 1: airborne sound insulation. Acta Acust United Ac 2015; 101: 88–98.
13. Scrosati C, Scamoni F, Bassanino M, et al. Uncertainty analysis by a Round Robin Test of field measure-ments of sound insulation in buildings: single numbers and low frequency bands evaluation: airborne sound insulation. Noise Control Eng J 2013; 61(3): 291–306.
14. Scrosati C, Scamoni F, Prato A, et al. Uncertainty of Façade sound insulation by a Round Robin Test. Evaluations of low frequencies and single numbers. Build Environ 2016; 105: 253–266.
15. Cremer L. Theorie der Schalldämmung dünner Wände bei schrägem Einfall. Akust Z 1942; 7: 81–104 (in German).
16. Nilsson A and Liu B. Vibro-acoustics, vol. 2. Berlin: Springer, 2015.
17. Piana EA, Marchesini A and Nilsson AC. Evaluation of different methods to predict the transmission loss of sandwich panels. In: Proceedings of the 20th international congress on sound and vibration
(ICSV 2013) (ed M Crocker), Bangkok, Thailand, 7–11 July 2013, pp. 3552–3559. Auburn, AL:
18. Piana EA and Nilsson AC. Prediction of the sound transmission loss of sandwich structures based on a simple test procedure. In: Proceedings of the 17th international congress on sound and vibration (ICSV
2010) (ed M Crocker), Cairo, Egypt, 18–22 July 2010, pp. 109–116. Auburn, AL: IIAV.
19. Piana EA, Milani P and Granzotto N. Simple method to determine the transmission loss of gypsum panels. In: Proceedings of the 21st international congress on sound and vibration (ICSV 2014) (ed M Crocker), Beijing, China, 13–17 July 2014, pp. 3700–3706. Auburn, AL: IIAV.
20. Piana EA. A method for determining the sound reduction index of precast panels based on point mobility measurements. Appl Acoust 2016; 110: 72–80.
21. Piana EA, Petrogalli C and Solazzi L. Dynamic and acoustic properties of a joisted floor. In: Proceedings
of the 6th international conference on simulation and modeling methodologies, technologies and appli-cations (SIMULTECH 2016) (eds MS Obaidat, Y Merkuryev and T Oren), Lisbon, 29–31 July 2016, pp.
277–282. Setúbal: Scite Press.
22. Magrini A and Lisot A. A simplified model to evaluate noise reduction interventions in the urban envi-ronment. Build Acoust 2016; 23(1): 36–46.
23. Scrosati C, Scamoni F and Valentini F. The drying process influence on the brick walls sound reduction index: laboratory evaluations and theoretical analysis. In: Proceedings of the 7th European conference
on noise control 2008 (EURONOISE 2008), Paris, 29 June–4 July 2008.
24. Hopkins C. Sound insulation. London: Routledge, 2008.
25. Martellotta F, Ayr U, Talamo F, et al. Caratteristiche acustiche di malte addizionate con prodotti naturali e di scarto agricolo (Acoustics characteristics of mortar with the addition of natural products and agri-cultural waste). In: Proceedings of the 44th conference of the Acoustical Society of Italy, Pavia, 7–9 June 2017 (in Italian).
26. Messali F, Metelli G and Plizzari G. Experimental results on the retrofitting of hollow brick masonry walls with reinforced high performance mortar coatings. Constr Build Mater 2017; 141: 619–630.