Differentiation of human neuroblastoma cells toward
the osteogenic lineage by mTOR inhibitor
A Carpentieri1,6, E Cozzoli1,6, M Scimeca2, E Bonanno2, AM Sardanelli3,4,7and A Gambacurta*,1,5
Current hypothesis suggest that tumors can originate from adult cells after a process of 'reprogramming' driven by genetic and epigenetic alterations. These cancer cells, called cancer stem cells (CSCs), are responsible for the tumor growth and metastases. To date, the research effort has been directed to the identification, isolation and manipulation of this cell population. Independently of whether tumors were triggered by a reprogramming of gene expression or seeded by stem cells, their energetic metabolism is altered compared with a normal cell, resulting in a high aerobic glycolytic 'Warburg' phenotype and dysregulation of mitochondrial activity. This metabolic alteration is intricately linked to cancer progression.The aim of this work has been to demonstrate the possibility of differentiating a neoplastic cell toward different germ layer lineages, by evaluating the morphological, metabolic and functional changes occurring in this process. The cellular differentiation reported in this study brings to different conclusions from those present in the current literature. We demonstrate that 'in vitro' neuroblastoma cancer cells (chosen as experimental model) are able to differentiate directly into osteoblastic (by rapamycin, an mTOR inhibitor) and hepatic lineage without an intermediate 'stem' cell step. This process seems owing to a synergy among few master molecules, metabolic changes and scaffold presence acting in a concerted way to control the cell fate.
Cell Death and Disease (2015) 6, e1974; doi:10.1038/cddis.2015.244; published online 12 November 2015
Cancer stem cells are currently viewed as the cells capable of generating cancer (tumor-initiating cells), owing to their intrinsic features of self-renewal and longevity.1 However, emerging evidence suggests a surprising ability of normal committed cells to act as reserve stem cells upon reprogram-ming following tissue damage resulting from inflammation and wound healing. This brings to the alternative hypothesis that tumors may originate from differentiated cells that have recovered stem cell properties owing to genetic or epigenetic reprogramming.1,2 Possibly, both models are correct, and consequently there is a continuum of cells capable of generating cancer, ranging from early primitive stem cells to committed progenitor or even terminally differentiated cells.
The development of methods for reprogramming somatic cells to induced pluripotent stem cells (iPSCs) through ectopic expression of a few pluripotency factors holds the promise for disease modeling, drug screening studies and treatment of several diseases.3Generating iPSCs from cancer cells might also clarify the mechanisms that underlie oncogenic transformation.4,5Thus reprogramming and oncogenic trans-formation are processes that have interesting common steps, while iPSCs generated from cancer cells could give clues to molecular mechanisms underlying the pathogenesis of human cancer.6 To date, there are only few reports
demonstrating a successful reprogramming of human primary cancer cells. Only one report describes the repro-gramming of human primary cancer cells7while the remaining studies used established cell lines.8–12 Carrete et al.9 generated iPSCs from the chronic myeloid leukemia (CML) cell line KBM7 carrying the BCR-ABL fusion oncogene by expressing four ectopic reprogramming factors (OCT4, KLF4, SOX2, and c-Myc (OKSM)). Conversely, Choiet al.10 reprogrammed EBV-immortalized B lymphocytes to pluripo-tency using non-integrative episomal vectors. Lin et al.11 reprogrammed human skin cancer cell lines to pluripotency using the microRNA miR-302. Miyoshiet al.12reprogrammed gastrointestinal-transformed cell lines using retroviral vectors expressing c-Myc and BCL2. Finally, Hu et al.8successfully reprogrammed primary human lymphoblasts from a BCR-ABL+CML patient using transgene-free iPSC technology to ectopically express OKSM and LIN28. In addition, Ramos-Mejiaet al.4in a recent review emphasize the importance of deciphering the barriers underlying the reprogramming process of primary cancer cells to obtain information on the links between pluripotency and oncogenic transformation that would be instrumental for therapy development.
Cancer cells show distinct metabolic features. In fact, neoplastic cells adapt their metabolic pathways to face the
1Biochemistry Laboratory, Department of Experimental Medicine and Surgery, University of Rome 'Tor Vergata', Rome 00133, Italy;2Department of Biomedicine and
Prevention, University of Rome 'Tor Vergata', Rome 00133, Italy;3Department of Basic Medical Sciences, Neurosciences and Sense Organs, University of Bari 'Aldo Moro',
Bari, Italy;4Center of Integrated Research, Campus Bio-Medico, University of Rome, Rome 00128, Italy and5NAST Centre for Nanoscience, University of Rome 'Tor Vergata', Rome 00133, Italy
*Corresponding author: A Gambacurta, Biochemistry Laboratory, Department of Experimental Medicine and Surgery, University of Rome 'Tor Vergata', via Montpellier 1, Rome 00133, Italy. Tel: +39 06 72596488; Fax: +39 06 72596488; E-mail:[email protected]
6These authors contributed equally to this work. 7
Also senior author.
Received 15.4.2015; revised 23.7.2015; accepted 28.7.2015; Edited by RA Knight
Abbreviations: iPSC, induced pluripotent stem cell; LDH, lactate dehydrogenase; PK, pyruvate kinase; IDH, isocitrate dehydrogenase; PEP, phosphoenolpyruvate; HK, hexokinase; Bid, BH3 interacting-domain death agonist; Mdm2, mouse double-minute 2 homolog; SIRT3, Sirtuin-3
demands of abnormal proliferation. For example, cancer cells increase glucose uptake and the rate of glycolysis even under normoxic conditions; this process of aerobic glycolysis was first described by Warburg et al.13,14 and thence called Warburg effect. Recent studies are increasingly highlighting the importance of metabolic manipulation in cancer cells and how bio-energetic and biosynthetic changes could be exploited to stop tumor cells progression.15–17 Reprogram-ming, pluripotency, oncogenic transformation and metabolic changes are therefore connected processes that share interesting similarities.18,19The fact that the same alterations driving tumorigenesis can influence the reprogramming of non-cancer somatic cells is a double-edged sword. It poses safety concerns for the cell therapy applications with iPSCs, while at the same time it promotes further studies aimed to analyzing the mechanisms and barriers underlying the direct reprogramming of cancer cells. This is a fundamental attempt to acquire valuable new insight on reprogramming and cell transformation.20
Along these concepts, here we have investigated the possibility to revert cancer progression by targeting cancer cells, seen as deprogrammed cell and therefore similar to adult stem cells. Using a human neuroblastoma cell line (SH-SY5Y) as model, our work has been designed to experimentally explore different aspects. We show how these
cells can differentiate toward a germ line different from the original one, modifying their morphology and acquiring metabolic changes which are distinctive of a more normal phenotype.
Results
Morphological analysis of differentiated SH-SY5Y cells. In order to test the possibility to differentiate tumor cells, we used the human neuroblastoma SH-SY5Y cell line as experimental model. Using different types of scaffolds, such as hydroxyapatite and acellular bone matrix and rapamycin 5μM as inductor, these cells differentiate into osteoblasts, that is, from an ectodermal to a mesodermal lineage. Figure 1 shows, by immunocytochemistry analysis, how the osteo-genic differentiation was indeed taking place, as shown by the presence of osteocalcin, a protein typical of osteoblasts. The neuroblastoma cells begin to get in contact with the support already on the early days of differentiation (day 5). Then a gradual colonization of the scaffolds followed by morphological change of the cells was observed along with an increase in size of the supports (Supplementary Figure S1A). The staining with Alizarin Red demonstrated extensive deposits of calcium phosphate (Supplementary Figure S1B) and western blotting analysis further evidenced the presence
Figure 1 SH-SY5Y cells morphological changes during osteogenic differentiation. SH-SY5Y cells were cultured in osteogenic medium in the presence of hydroxyapatite scaffolds with rapamycin (5μM) and analyzed for osteocalcin expression by immunocytochemistry. (a) SH-SY5Y cells on the scaffolds during differentiation (in green, osteocalcin; in blue, DAPI; bar= 50 μm). (b) Osteocalcin secretion by SH-SY5Y during differentiation (in green, osteocalcin; in blue, DAPI; bar = 50 μm)
of osteocalcin (Supplementary Figure S1C), thus confirming the presence of osteoblast-like cells. The end point of the differentiation process was reached after 20 days (Supplementary Figure S1A), Time-course differentiation experiments showed that metabolic/protein changes were already occurring in the first 5 days from induction (Supplementary Figure S2E). In all the experiments, the SH-SY5Y control cells were plated and maintained in the same culture time and media conditions (without rapamycin). Scanning electron microscopy (SEM) of the differentiated cells shows the colonization of the scaffold (Figure 2). Accordingly, larger tissue-like structures forming agglomer-ates of several highly differentiated columnar-shaped cells (20–30 μm in diameter) morphologically similar to osteoblasts can be observed. Finally, we performed a Ki67 proliferation assay to determine the percentage of proliferating and non-proliferating cells (Supplementary Figures S2A–C).
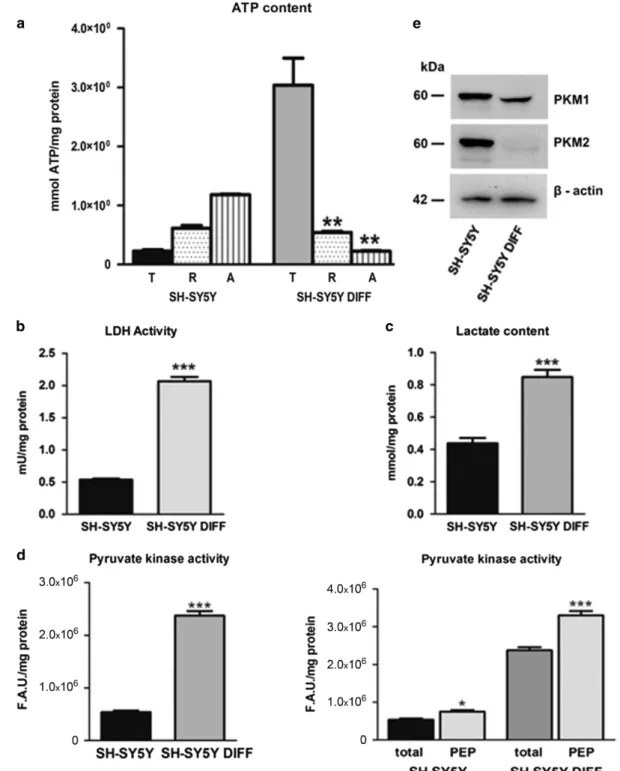
Differentiated SH-SY5Y cells change their energy meta-bolism. The energy metabolism of control and differentiated SH-SY5Y cells was checked in parallel to the morphological change. Figure 3a reports the intracellular ATP content and its source (mitochondrial versus extra mitochondrial), the activity of lactate dehydrogenase (LDH) and the L-lactate production in untreated and differentiated SH-SY5Y cells (Figures 3b and c, respectively). Figure 3d shows the pyruvate kinase (PK) activity experiments before and after adding the substrate phosphoenolpyruvate (PEP), and Figure 3e shows the western blotting analysis for PKM1 and PKM2 expression in control and differentiated SH-SY5Y
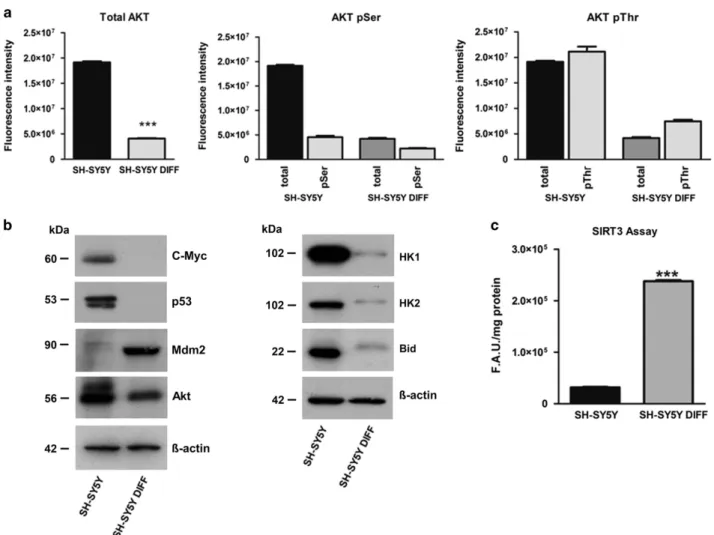
cells. All the experiments were performed in triplicate and repeated three times. The errors reported represent the mean± S.E.M. of the three independent experiments. Differentiated SH-SY5Y cells: metabolic and functional analysis. In parallel with the analysis of the energetic metabolism, we also checked the change in protein expres-sion taking place during the differentiation process. The more significant differences detected between controls and SH-SY5Y differentiated cells are reported in Figure 4, showing Akt expression and its phosphorylation (Figure 4a) and the change in c-Myc, p53, mouse double-minute 2 homolog (Mdm2), hexokinase (HK) 1/2 and BH3 interacting-domain death agonist (Bid) protein expression (Figure 4b). We also checked the changes in the expression of isocitrate dehy-drogenase (IDH) 1/2 and mTOR/phosphorylated mTOR. The results of these analysis are reported in Supplementary Figure S2D. A quantitative measurement of Sirtuin-3 (SIRT3) activity performed on SH-SY5Y control and differentiated cells, respectively, is reported in Figure 4c.
Additional evidence of SH-SY5Y cancer cells' plasticity is reported in Supplementary Figure S3, showing that these cells can also differentiate toward an (ectodermal) hepatic phenotype. To demonstrate how this differentiative ability is not limited only to a neuroblastoma cell line, similar experi-ments were also performed on the human CML K-562 (Supplementary Figure S4). These preliminary results showed how these cells were able to secrete calcium phosphate and synthesize osteocalcin (Supplementary Figures S4A and B, respectively). From a point of view of energetic metabolism,
Figure 2 SEM of SH-SY5Y cells after osteogenic differentiation. SEM allowed us to demonstrate scaffold colonization by differentiated SH-SY5Y cells (arrows) forming large tissue-like agglomerates (a–c). Higher magnification of area indicated in the rectangles display differentiated SH-SY5Y cells colonizing both scaffold surface (b) and scaffold fracture (c). Bar= 300 μm in panel (a), 200 μm in panel (b), 20 μm in panel (c). (d and e) Colonizing cells show morphological heterogeneity. Asterisks indicate numerous differentiated osteoblast-like cells. (f) Notably, electron micrograph capture an osteoblast matrix vesicle just as it initiated the exocytosis of hydroxyapatite (square). Bar= 20 μm in panel (d), 10μm in panel (e), 2 μm in panel (f)
K562 cells after osteogenic differentiation show the switch toward the oxidative metabolism with a decrease in the activity of LDH and an increase in the activity of SIRT3 (Supplementary Figures 4C–E, respectively). These results
are comparable to those obtained with the neuroblastoma cell line SH-SY5Y.
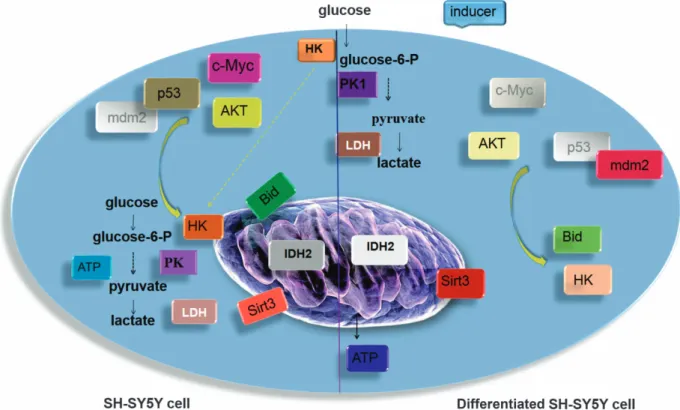
An overall view of the differences between the control and the differentiated cells is shown in Figure 5.
Figure 3 Energy metabolism in differentiated SH-SY5Y cells. (a) Intracellular ATP levels. ATP content in SH-SY5Y control and differentiated SH-SY5Y cells (DIFF), total (T) or incubated in the presence of Rotenone (R) and Antimycin A (A) (error bars represent data from three independent experiments; **Po0.01). (b) Lactate dehydrogenase activity (LDH) in SH-SY5Y control and differentiated SH-SY5Y cells (DIFF) (***Po0.001). (c) L-Lactate production in SH-SY5Y control and differentiated SH-SY5Y cells (DIFF) (***Po0.001). (d) PK activity in SH-SY5Y control and differentiated SH-SY5Y cells (DIFF) measuring the ATP derived from reaction using PEP as substrate (*Po0.05, ***Po0.001). All the experiments were performed in triplicate and repeated in three separate tests. The errors reported represent the means ± S.E.M. of the three independent experiments. (e) Western blotting analysis for PKM1 and PKM2 on SH-SY5Y control and differentiated SH-SY5Y cells (DIFF)
Discussion
A core question in cancer biology is the identity and nature of the cancer 'cell of origin', that is, the target cell where the first oncogenic-driving mutation occurs leading to tumor initiation. The concept of cancer stem cells has recently emerged in view of their intrinsic ability of self-renewal and of their longevity, antiapoptotic and differentiation capabilities that makes them quite similar to the early primitive stem cells.1However, new evidence on the plasticity of normal cells, able to acquire stem cell features, suggest that committed progenitor cells or deprogrammed differentiated cells (possibly in response to tissue damage and wound healing) can also trigger tumor initiation.21–23 Consequently, an alternative hypothesis sug-gests that tumors may originate from differentiated cells that can get back stem cell properties owing to genetic or epigenetic modifications. To date, the term cellular reprogram-ming is linked to the work of Takahashi and Yamanaka3 showing the possibility of obtainingin vitro pluripotent stem cells starting from adult cells. In cancer cells, reprogramming is the possibility to obtain iPSCs, by inserting genes of stem cells and then differentiate them into different cell types.24This may offer a novel differentiative approach by reprogramming
the cancer cells without creating or isolating the stem precursors.
We used, as an experimental model, a human neuroblas-toma cell line, namely SH-SY5Y, to perform a differentiation protocol leading the cells toward a different germ layer (from ectoderm to mesoderm). To this end, we directed them toward an osteoblastic lineage using rapamycin as inducer, a compound able to promote thein vitro osteogenic differentia-tion of stem cells by acting on Akt/mTOR pathway.25–27 Compared to the work of Jonhsenet al.,26we decided to use rapamycin in combination with hydroxyapatite scaffolds, thus allowing a more extended differentiation of the cells in culture. As shown, the SH-SY5Y cells are not affected by the different types of support in the differentiation process, demonstrating that the presence of the scaffold is always required regardless of its characteristics. The concept was to utilize matrices derived from the stem cell studies, where the use of scaffolds allows an improvement in the osteogenic differentiation. The cellular differentiation was visualized by morphological and metabolic analysis. Figures 1 and 2 (and Supplementary Figure 1) show that, already few days after the induction, a colonization of the scaffolds was taking place followed by an increase in size of the supports, the formation of calcium
Figure 4 Akt, p53 and cMyc expression in differentiated SH-SY5Y cells. (a) Total Akt expression (tot-Akt) and Akt phosphorylated at Ser473 and in Thr308 detected by luminescence assay (***Po0.001). (b) Western blotting analysis for c-Myc, p53, Mdm2, Akt, HK 1/2 and Bid. (c) SIRT3 activity is reported in control and differentiated SH-SY5Y cells (DIFF). The errors reported represent the means± S.E.M. of the three independent experiments (***Po0.001)
deposits and the expression of the osteocalcin (demonstrating an osteoblastic lineage) with an inhibition of cell proliferation (Supplementary Figures 2A–C). Furthermore, time-course experiments demonstrated that the observed variations were indeed related to the differentiation process and did not depend on other phenomena such as exit from cell cycle or senescence owing to prolonged time culture (Supplementary Figure 2E). We then investigated the metabolic and functional changes occurring during differentiation (Figures 3 and 4). We observed relevant metabolic changes. Although cancer cells display elevated glycolysis under normoxic conditions (Warburg effect),13–15 Figure 3a shows that differentiation causes a switch from glycolytic to oxidative metabolism. However, unexpectedly, the differentiated cells showed higher levels of LDH activity and of L-Lactate production (Figures 3b and c, respectively), when compared with the control cells growth in the same culture conditions but without the inducer.28–31
To explain these data, we studied the PK activity, that is, the final rate-limiting step of glycolysis. Of the four mammalian PK isoforms (L, R, M1, M2), tumor cells mainly express the M2 isoform. In contrast, neuroblastoma cells express all four isoforms.32PKM2 is subject to a complex regulation by both
oncogenes and tumor suppressors, which allows a fine tuning of its activity, so lowering PK activity it is expected to produce less pyruvate.33In this context, an increase of Akt expression could be a key player in the Warburg effect induction (aerobic glycolysis).34 In 2011, Kosugi et al.35 observed that an increase in p-Akt was responsible for the activation of PKM2. A recent work confirmed that indeed Akt2 is responsible for the PKM2 upregulation.36 Furthermore, switching PKM2 expression to PKM1 in tumor cells can reverse the Warburg effect, reducing the ability of the cells to form tumors in nude mice.37,38 PKM1 expression also correlates with terminal differentiation.36,39Figure 3d shows that PK enzymatic activity on its substrate PEP was significantly higher in differentiated cells with respect to controls as shown by the increase of ATP when compared with the respective untreated cells, whereas the PKM2 isoform expression is reduced.36Thus we hypothesize that the PKM1 isoform was responsible for the increased PK enzymatic activity observed in the differentiated cells. Accordingly, inhibition of the PK seems responsible for the low levels of L-Lactate and LDH activity in the control cells.36,40
The activation of PK during differentiation might induce pyruvate channeling to the mitochondria for ATP synthesis and
Figure 5 Scheme of the metabolic effect in control and differentiated SH-SY5Y cells. Major metabolic transformations in differentiated SH-SY5Y cells compared with control cells are shown. The brighter colors indicate the increased expression and/or activity of the indicated protein. White nuanced indicate the total absence of protein expression found in the performed experiments. In cancer cells, a high rate of glycolysis is observed with highly increased glucose uptake even under normoxic conditions, while respiration remains almost unchanged (aerobic glycolysis). The major mediators of the metabolic shift toward increased glycolytic flux are, in our experiments, c-c-Myc, p53, Akt, PK and IDH. The less PK activity in cancer cells increases the concentrations of glycolytic intermediates. The survival signals lead to translocation of HK to the mitochondrial membrane through the Akt signaling pathway helped by c-Myc and p53. Mitochondria-bound HK confers an advantage to utilize ATP for phosphorylating glucose and, at the same time, mitochondrial HK negatively modulates Bid preventing the release of cytochrome c into cytosol and cell death.58High IDH expression probably are involved in the early steps of initiating
Warburg effect and help the cancer cells to maintain this metabolic state. After induction, in SH-SY5Y differentiated cells the shift in energy metabolism eventually leads to the oxidation of nutrients via oxidative phosphorylation. An increase in the PK activity, due mainly to the PKM1, continuously generates pyruvate, which is transported into mitochondria and further metabolized via the tricarboxylic acid cycle. The almost nonexistent IDH2 expression helps to maintain the citrate in this oxidative metabolic way. The disappearance of c-Myc and p53 with the lowest Akt expression and the increase in SIRT3 activity also induce the detachment of HK and increase the mitochondrial activity
address the cellular metabolism of these cells toward the oxidative metabolism.40 This finding correlates with the extremely low expression of IDH isoforms (IDH1 and IDH2) in the differentiated cells. An increased glycolysis appears to be an advantage for cancer cells, providing not only energy but also the basic metabolites needed to a rapidly dividing cell,41,42 and IDH1/2 may represent the mechanism for triggering this metabolic shift.43–45This is a further evidence for the role of Akt and PK as key molecules in the control of glycolysis in cancer cells.39 Figure 4 shows the different expression of some known tumor master genes in SH-SY5Y cells in comparison to the differentiated cells. An increased expression of Akt, c-Myc, p53, Bid, HK2/HK1, IDH1/2, PKM1/2, a low SIRT3 activity and no Mdm2 expression was observed in SH-SY5Y controls, whereas in SH-SY5Y differ-entiated cells there was a lower Akt, Bid, HK2/HK1, IDH1/2 and PKM2 expression, no c-Myc and p53 expression but a higher amount of Mdm2 and a strong SIRT3 activity. Collectively, these data are summarized in Figure 5.
In SH-SY5Y control cells, the elevated c-Myc and p53 levels promote the synthesis and/or upregulation of many glycolytic enzymes, including HK 2, owing to an increased transcription46and insufficient p53-mediated control,18as this protein is abnormally sequestered in the cytoplasm.32,47–49 HKs have multifunctional roles besides glucose phosphoryla-tion. There is evidence that HKs bound to the mitochondrial membranes participate in the apoptotic pathway.50–54 The HK2 association with mitochondria is promoted by Akt activity, which also induces aerobic glycolysis and increases the uptake of glucose.55,56In the apoptotic process, mitochondrial HK negatively modulates the cleaved form of Bid and may directly inhibit Bad, while Bid is inhibited by Akt. All these activities are able to prevent apoptosis and cell death, thus leading to an immortalized cancer cell.52,57,58
The differentiated SH-SY5Y cells had a decreased level of Akt associated with an increase in the PK activity leading to a metabolic switch from glycolytic to oxidative. This switch is also facilitated by the decreased expression of IDH2 and consequently leaving the citrate to flow through the tricar-boxylic acid cycle. The absence of c-Myc transcriptional activity, and the synthesis of Mdm2 which promotes the p53 degradation, allow a regulation of glycolysis and glycolytic enzymes and might explain the decreased expression of HKs.47,59–62 An increased mitochondrial activity was also consistent with a greater SIRT3 activity, which also induces dissociation of HK from mitochondria.63 These data are in agreement with recent reports demonstrating that SIRT3 is a crucial regulator of the Warburg effect.64Probably this might be the biochemical basis of the anticancer activity of resveratrol particularly toward neuroblastoma, which has been attributed to thein vitro or in vivo activation of SIRT1 and SIRT3.65
According to our results, it seems feasible to change the fate of a cancer cell by two different approaches, that is, by differentiating a cancer cell in a germ line different from the original one and by obtaining differentiated cells by acting on glucose metabolism and on the expression of some key proteins working in concert. This reversal to a 'committed' state was until now only suggested by few reports.66–69
In conclusion, this paper shows the ability to induce a non-canonical differentiation in cancer cells, accompanied by unexpected metabolic changes. In this model, it is crucial the combination of two components namely rapamycin as inductor and a scaffold to obtain an extensive osteogenic differentiation. In our opinion, the study of these processes can represent an advancement in the understanding of the molecular mechanisms able to cause a reversal state of the tumor cell and possibly a hint to new therapeutic approaches.
Materials and Methods
Cell cultures. The cell line of human neuroblastoma SH-SY5Y (ATCC, Manassas, VI, USA, CRL-2266) was grown on tissue culture dish (BD Falcon, Durham, NC, USA, cat. no. 353003), in DMEM-F12 with 15 mM HEPES and 2 mM L-glutamine (Lonza, Verviers, Belgium, cat. no. BE12-719 F) supplemented with 10% (v/v) fetal bovine serum (FBS) (Lonza, cat. no. DE14-830 F), 1% (v/v) penicillin (100 units/ml)/streptomycin (100 mg/ml) (Lonza, cat. no. DE17-602E) maintained in an humidified incubator at 37 °C with 5% (v/v) CO2. The medium was changed
every 4 days at confluence, the cells were detached with cold phosphate-buffered saline (PBS), centrifuged for 10 min at 200 × g and reseeded at a density of approximately 3 × 10⁵cells in complete media.
The cell line of human CML K-562 (ATCC, CCL-243) was grown on tissue culture flask (Corning, Durham, NC, USA, cat. no. 353108) in RPMI1640 (Biowest, Nuaillé, France, cat. no. L0501-500) supplemented with 2 mM L-glutamine, 10% (v/v) FBS (Lonza, cat. no. DE14-830F), 1% (v/v) penicillin (100 units/ml)/streptomycin (100 mg/ ml) (Lonza, cat. no. DE17-602E) and 1% of non-essential amino acids (Biowest, cat. no. X0557-100) maintained in an humidified incubator at 37 °C with 5% (v/v) CO2.
Every 3 days, the medium was changed and the cells centrifuged for 10 min at 200 × g and reseeded at a density of approximately 3 × 10⁵cells in complete media.
The coating plate protocol required a 0.1 mg/ml collagen type I rat tail high concentration solution (BD Pharmigen, BD, Bedford, MA, USA, cat. no. 354249) added to the 24 multi-well plates and incubated for 1 h at 37 °C. After incubation, the plates were washed three times with PBS and kept at +4 °C until use.
Osteogenic differentiation. Neuroblastoma SH-SY5Y cells (1 × 10⁴) were
plated for each experiment. The differentiation medium was composed as follows: DMEM-F12 with 15 mM HEPES and 2 mM L-glutamine (Lonza, cat. no. BE12-719 F), 10% FBS (Lonza, cat. no. DE14-830 F), 1% penicillin (100 units/ml)/ streptomycin (100 mg /ml) (Lonza, cat. no. DE17-602E) and as an osteogenic inductor rapamycin 5μM (Calbiochem, Darmstadt, Germany, cat. no. CAS 53123-88-9, Sigma, St. Louis, MI, USA, cat. no. R0395).25
K562 cells (6 × 10⁴) were plated for each experiment. The differentiation medium
was composed as follows: DMEM-F12 with 15 mM HEPES and 2 mM L-glutamine (Lonza, cat. no. BE12-719 F), 10% FBS (Lonza, cat. no. DE14-830 F), 1% penicillin (100 units/ml)/streptomycin (100 mg/ml) (Lonza, cat. no. DE17-602E) and 1% of non-essential amino acids (Biowest, cat. no. X0557-100) and as an osteogenic inductor rapamycin was used at a final concentration of 10μM (Sigma, cat. no. R0395). A mechanical scaffold was added to each well, as follows: CompactBoneB (Dentegris, Duisburg, Germany, cod. BOV10S) and OsteOXenon (Bioactivia, Vicenza, Italy, cod. OSP-OX31), both with grain size of 0.5–1 mm: the first is a hydroxyapatite ceramic and the latter is an acellular bone matrix of equine origin. The medium was changed twice a week, and after 20 days of differentiation, the cells were collected and used for all experiments reported below.
Hepatic differentiation. Neuroblastoma cells (7 × 10³) were plated for 2 days in the 'maintenance medium', as follows: hepatocyte defined medium, serum free (BD Biocoat, Bedford, MA, USA, cat. no. 05449), Human EGF (epidermal growth factor) 5μg/ml (BD Biosciences, Bedford, MA, USA, cat. no. 354052); 2 mM L-Glutamine (Euroclone, Pero (MI), Italy, cat. no. ECB3000D), 1% penicillin (100 units/ml)/streptomycin (100 mg/ml) (Lonza, cat. no. DE17-602E), and 10 ng/ml IGF-1 (insulin growth factor 1) (Provitro, Berlin, Germany, cat. no. 1480950020). After 2 days, the cells were plated in 'differentiation medium': hepatocyte defined medium, serum free, EGF 5μg/ml, 2 mM L-Glutamine, 1% penicillin (100 units/ml)/ streptomycin (100 mg/ml), human HGF (hepatocyte growth factor) 20 ng/ml (Provitro, cat. no. 1468954010), 20 ng/ml FGF-4 (fibroblast growth factor 4) (Provitro, cat. no. 1372 9500 05). The culture medium was added every 2 days. After about 20 days, the cells were collected and used for the experiments.
Alizarin Red staining. The presence of calcium phosphate deposits in SH-SY5Y and K562 cells following differentiation compared with control cells was evaluated by staining with Alizarin Red S (Sigma, cat. no. A5533-25G). The cells were fixed with 4% (v/v) formaldehyde overnight, washed with distilled water, stained with 1% (v/v) Alizarin Red S and incubated at room temperature in the dark for 10 min. The excess of dye was removed with distilled water, and the cells were observed by optical microscopy.
Glycogen storage. Intracellular glycogen was analyzed by Periodic Acid-Schiff staining. The cells were fixed with 4% (v/v) formalin (Applychem, Darmstadt, Germany, cat. no. A3697-5000) for 45 min. The samples were then oxidized in 1% (v/v) periodic acid for 5 min, rinsed three times in deionized water, incubated with Schiff’s reagent for 15 min in the dark at room temperature (RT) and washed three times with H2O for 10 min. The nuclei were stained with hematoxylin for 1 min and
rinsed with H2O.
Immunocytochemistry analyses. After differentiation, the cultured cells were washed twice with PBS and fixed with 4% (v/v) formalin for 30 min at RT and permeabilized in blocking solution: 1% (v/v) BSA, 10% (v/v) goat serum, PBS with 0.3% (v/v) Triton X-100 for 45 min at +4 °C. After 20 min, the cells were washed and then incubated with the primary antibody mAb mouse anti-osteocalcin 10μg/ml (R&D System, Minneapolis, MN, USA, cat. no. MAB1419), mAb mouse anti-HK 1 (Abcam, Cambridge, MA, USA, cat. no. ab55144) 1 : 500, mAb mouse anti-AFP-01 (alpha 1-fetoprotein) (Abcam, cat. no. ab3980) 5μg/ml, mAb rabbit anti-Ki67 (Neo Markers, Fremont, CA, USA) 1 : 1000 overnight at +4 °C. Subsequently, the cells were incubated with the corresponding secondary anti-mouse or anti-rabbit Alexa Fluor 488 (Invitrogen, Grand Island, NY, USA, cat. no. A21202) 1 : 1000 and DAPI (4’,6-diamidino-2-phenylindole) (Sigma, USA, cat. no.101032341) 1 : 1000. Scanning electron microscopy. Small scaffold support were fixed in 4% (v/v) paraformaldehyde and postfixed in 2% osmium tetroxide. After washing with 0.1 M phosphate buffer, the sample was dehydrated by a series of incubations in 30, 50 and 70% (v/v) ethanol. Dehydration was continued by incubation steps in 95% (v/v) ethanol, absolute ethanol and acetone. Critical point drying (Agar Scientific, Essex, UK, ElektronTechnology UK Ltd., Cambridge, UK) with supercritical CO2was
then performed to prevent cell deformation. Surfaces of the scaffolds were coated with gold and scanned using SEM LEO 1450VP (Carl Zeiss Meditec, Oberkochen, Germany).70
Protein extraction and western blotting analysis. Cells were homogenized directly into the following buffer: Tris 50 mM, NaCl 150 mM, EDTA 10 mM, and Triton-X 1%, and centrifuged at 10 000 × g for 2 min. Protein concentrations were determined by the Bradford assay. Proteins were resolved by 12% SDS-PAGE, electrotransferred on PVDF membranes (Amersham Hybond, GE Healthcare Life Science, Buckinghamshire, UK, cat. no. 28906837) and blocked with 5% (v/v) milk/0.1% (v/v) TBS-T. The blots were probed with the following primary antibodies: mAb mouse anti-osteocalcin 1 : 500 (Abcam, cat. no. ab13420), mAb mouse anti-beta actin 1 : 10000 (Sigma, cat. no. A5541), mAb rabbit anti-HK 1 1 : 1000 (Cell Signaling, Beverly, MA, USA, cat. no. 2024), mAb rabbit anti-HK 2 1 : 1000 (Cell Signaling, cat. no. 2867), mAb mouse anti-c-Myc (1μg/ml) (BD Pharmigen, cat. no. 551101), mAb mouse anti-p53 1 : 500 (Santa Cruz Biotechnology, Dallas, TX, USA, cat. no. sc-126), anti-Mdm2 (2μg/ml) (Oncogene, cat. no. OP145), polyAb rabbit anti-Bid (1:500) (Gene Tex, Irvine, CA, USA, cat. no. GTX110568), polyAb rabbit anti-Akt 1 : 1000 (Gene Tex, cat. no. GTX121937), polyAb rabbit anti-IDH1 (2μg/ml) (Sigma, cat. no. SAB3500511), polyAb goat anti-IDH2 (0.3μg/ml) (Sigma, cat. no. SAB2501533), mAb rabbit anti-PKM1 1 : 1000 (Cell Signaling, cat. no. 7067), polyAb rabbit anti-PKM2 1 : 1000 (Cell Signaling, cat. no. 3198), polyAb rabbit anti-mTOR 1 : 500 (Cell Signaling, cat. no. 2972), and polyAb rabbit anti-phospho-mTOR (Ser2448) 1 : 500 (Cell Signaling, cat. no. 2971). Western blotting analysis for mTOR and phospho-mTOR (Ser2448) was performed using a precast Bolt 4–12% Bis-Tris Plus Gel (Invitrogen, cat. no. BG04120BOX).
Membranes were then incubated with the appropriate horseradish peroxidase-conjugated donkey anti-mouse secondary antibody (Jackson Immuno Research, Baltimore Pike, PA, USA, cat. no. 715-035-151), goat anti-rabbit secondary antibody (Jackson Immuno Research, USA, cat. no. 111-036-047) 1 : 10000 and donkey anti-goat (Santa Cruz Biotechnology, cat. no. sc-2020) 1 : 2000. Immunodetection was performed by the enhanced chemoluminescence system Western Lighting Plus ECL (Perkin Elmer, Waltham, MA, USA, cat. no. NEL105001EA).
Enzymatic assays. To evaluate the cellular metabolic pathway, for the ATP levels, LDH activity, L-Lactate production, Akt expression/phosphorilation and PK activity, the cells were collected, centrifuged for 10 min at 200 × g, washed in PBS and counted by TC10 Automated Cell Counter (Bio-Rad, Hercules, CA, USA, cat. no. 145-0009), while for SIRT3 activity the cells were lysed by performing three cycles of freezing/thawing. All assays were performed in triplicate on 96-well microplates, and the results were repeated in three separate experimental sessions. The ATP levels were determined by the luciferin/luciferase method using the luciferase ATP Assay Kit (Sigma, cat. no. FLASC) according to the manufacturer’s instructions. For the evaluation of ATP content under strict glycolytic conditions, the cells (3 × 10⁵) in each well were incubated for 1 h at 37 °C in the presence of rotenone (1μmol/l), a specific inhibitor of complex I, and antimycin A (1 μmol/l), which is a specific inhibitor of complex III, washed with PBS twice and suspended in PBS. The ATP content was measured using a luminometer (Victor X, Perkin Elmer) with high sensitivity (0.01 pmol). An ATP calibration curve was made using titrated ATP solutions following the manufacturer’s instructions. To determine the LDH activity the LDH Assay Kit (Abcam, cat. no. ab102526) was used, for the L-Lactate production the L-Lactate Assay Kit (Abcam, cat. no. ab65331) was used and for SIRT3 activity the SIRT3 Direct Florescent screening Assay Kit (Cayman Chemical Company cat. no. 10011566) was utilized. All the assays were performed following the manufacturer’s instructions. To measure Akt expression and its phosphorylation, the Phospho-TracerAkt 1/2/3 pThr308+, pSer473+Akt (Total) Assay Kit (Abcam, cat. no. ab119675)
was used following the manufacturer's instructions. This kit detects endogenous levels of Akt 1/2/3 in cellular lysates. Furthermore, it is able to detect Akt 1/2/3 when phosphorylated at Thr308 and when phosphorylated at Ser473. All assays were performed in triplicate.
For the PK activity, the cells were plated on a 96 multi-well microplates and incubated 10 min in: 150 mM triethanolamine, 75 mM ADP, and 0.04 mM PEP. After incubation, a mixture of luciferase–luciferin was added to the reaction and the plate read by a luminometer (Bedwildbadi, Germany). The amount of ATP produced was compared with the total amount of ATP. For all the assays, the measurements obtained have been normalized for the protein content. All assays were performed in triplicate, and the results were repeated in three separate experimental sessions. Statistical analyses. Data are expressed as means± S.E.M. and statistically analyzed by Student's t test.
Conflict of Interest
The authors declare no conflict of interest.
Acknowledgements. We thank Professor Alessandro Finazzi-Agro’ for helpful discussion, technical criticisms and reading the manuscript and Graziano Bonelli for technical support. This work has been supported by the Italian Ministry of Research grant no. '2007KAWXCL_002'. We also thank the sources of private funding who have provided the basis for this study: 'Progetto cellule staminali' NAST Centre.
1. Song IY, Balmain A. Cellular reprogramming in skin cancer. Semin Cancer Biol 2014; 32: 32–39.
2. Hu Y, Yu X, Liu S, Liu S. Cancer stem cells: a shifting subpopulation of cells with stemness? Med Hypotheses 2013; 80: 649–655.
3. Takahashi K, Yamanaka S. Induction of pluripotent stem cells from mouse embryonic and adult fibroblast cultures by defined factors. 2006. Cell 2006; 126: 663–676.
4. Ramos-Mejia V, Fraga MF, Menendez P. iPSCs from cancer cells: challenges and opportunities. Trends Mol Med 2012; 18: 5–8.
5. Suvà ML, Riggi N, Bernstein BE. Epigenetic reprogramming in cancer. Science 2013; 339: 1567–1570.
6. Hochedlinger K, Blelloch R, Brennan C, Yamada Y, Kim M, Chin L et al. Reprogramming of a melanoma genome by nuclear transplantation. Genes Dev 2004; 18: 1875–1885. 7. Zhang X, Cruz FD, Terry M, Remotti F, Matushansky I. Terminal differentiation and loss of
tumorigenicity of human cancers via pluripotency-based reprogramming. Oncogene 2013; 32: 2249–2260.
8. Hu K, Yu J, Suknuntha K, Tian S, Montgomery K, Choi KD et al. Efficient generation of transgene-free induced pluripotent stem cells from normal and neoplastic bone marrow and cord blood mononuclear cells. Blood 2011; 117: 109–119.
9. Carette JE, Pruszak J, Varadarajan M, Blomen VA, Gokhale S, Camargo FD et al. Generation of iPSCs from cultured human malignant cells. Blood 2010; 115: 4039–4042. 10. Choi SM, Liu H, Chaudhari P, Kim Y, Cheng L, Feng J et al. Reprogramming of
EBV-immortalized B-lymphocyte cell lines into induced pluripotent stem cells. Blood 2011; 118: 1801–1805.
11. Lin SL, Chang DC, Chang-Lin S, Lin CH, Wu DT, Chen DT et al. Mir-302 reprograms human skin cancer cells into a pluripotent ES-cell-like state. RNA 2008; 14: 2115–2124. 12. Miyoshi N, Ishii H, Nagai K, Hoshino H, Mimori K, Tanaka F et al. Defined factors
induce reprogramming of gastrointestinal cancer cells. Proc Natl Acad Sci USA 2010; 107: 40–45.
13. Warburg O, Posener K, Negelein E. Ueber den stoffwechsel der tumoren. Biochem Z 1924; 152: 319–344. Reprinted in English in the book 'On metabolism of tumors'. Constable, London,1930.
14. Warburg O. On the origin of cancer cells. Science 1956; 123: 309–314.
15. Menendez JA, Joven J, Cufí S, Corominas-Faja B, Oliveras-Ferraros C, Cuyàs E et al. The Warburg effect version 2.0: metabolic reprogramming of cancer stem cells. Cell Cycle 2013; 12: 1166–1179.
16. Ward PS, Thompson CB. Metabolic reprogramming: a cancer hallmark even Warburg did not anticipate. Cancer Cell 2012; 21: 297–308.
17. Jones RG, Thompson CB. Tumor suppressors and cell metabolism: a recipe for cancer growth. Genes Dev 2009; 23: 537–548.
18. Phan LM, Yeung SC, Lee MH. Cancer metabolic reprogramming: importance, main features, and potentials for precise targeted anti-cancer therapies. Cancer Biol Med 2014; 11: 1–19. 19. Hanahan D, Weinberg RA. Hallmarks of cancer: the next generation. Cell 2011; 144:
646–674.
20. Lang JY, Shi Y, Chin YE. Reprogramming cancer cells: back to the future. Oncogene 2013; 32: 2247–2248.
21. Marfe G, Massaro-Giordano M, Ranalli M, Cozzoli E, Di Stefano C, Malafoglia V et al. Blood derived stem cells: an ameliorative therapy in veterinary ophthalmology. J Cell Physiol 2012; 227: 1250–1256.
22. Marfe G, Rotta G, De Martino L, TafaniM, Fiorito F, Di Stefano C et al. A new clinical approach: use of blood-derived stem cells (BDSCs) for superficial digital flexor tendon injuries in horses. Life Sci 2012; 90: 825–830.
23. Alaimo G, Cozzoli E, Marfe G, Esposito L, Ranalli M, Hmada D et al. Blood-derived stemcells (BDSCs) plasticity: in vitro hepatic differentiation. J Cell Physiol 2013; 228: 1249–1254. 24. Takahashi K, Yamanaka S. Induced pluripotent stem cells in medicine and biology.
Development 2013; 140: 2457–2461.
25. Lee KW, Yook JY, Son MY, Kim MJ, Koo DB, Han YM et al. Rapamycin promotes the osteoblastic differentiation of human embryonic stem cells by blocking the mTOR pathway and stimulating the BMP/Smad pathway. Stem Cells Dev 2010; 19: 557–568. 26. Johnsen JI, Segerström L, Orrego A, Elfman L, Henriksson M, Kågedal B et al. Inhibitors of
mammalian target of rapamycin downregulate MYCN protein expression and inhibit neuroblastoma growth in vitro and in vivo. Oncogene 2008; 27: 2910–2922.
27. Misawa A, Hosoi H, Tsuchiya K, Sugimoto T. Rapamycin inhibits proliferation of human neuroblastoma cells without suppression of MycN. Int J Cancer 2003; 104: 233–237. 28. Feron O. Pyruvate into lactate and back: from the Warburg effect to symbiotic energy fuel
exchange in cancer cells. Radiother Oncol 2009; 92: 329–333.
29. Jeon SM, Chandel NS, Hay N. AMPK regulates NADPH homeostasis to promote tumour cell survival during energy stress. Nature 2012; 485: 661–665.
30. Kim J, Kim SK, Kim HK, Mattson MP, Hyun DH. Mitochondrial function in human neuroblastoma cells is up-regulated and protected by NQO1, a plasma membrane redox enzyme. PLoS One 2013; 8: e69030.
31. Deberardinis RJ, Sayed N, Ditsworth D, Thompson CB. Brick by brick: metabolism and tumor cell growth. Curr Opin Genet Dev 2008; 18: 54–61.
32. Beemer FA, Vlug AM, Rousseau-Merck MF, van Veelen CW, Rijksen G, Staal GE. Glycolytic enzymes from human neuroectodermal tumors of childhood. Eur J Cancer Clin Oncol 1984; 20: 253–259.
33. Wong N, De Melo J, Tang D. PKM2, a central point of regulation in cancer metabolism. Int J Cell Biol 2013; 2013: 242513.
34. Plas DR, Thompson CB. Akt-dependent transformation: there is more to growth than just surviving. Oncogene 2005; 24: 7435–7442.
35. Kosugi M, Ahmad R, Alam M, Uchida Y, Kufe D. MUC1-C oncoprotein regulates glycolysis and pyruvate kinase m2 activity in cancer cells. PLoS One 2011; 6: e28234.
36. Smolková K, Plecitá-Hlavatá L, Bellance N, Benard G, Rossignol R, Ježek P. Waves of gene regulation suppress and then restore oxidative phosphorylation in cancer cells. Int J Biochem Cell Biol 2011; 43: 950–968.
37. Christofk HR, Vander Heiden MG, Harris MH, Ramanathan A, Gerszten RE, Wei R et al. The M2 splice isoform of pyruvate kinase is important for cancer metabolism and tumor growth. Nature 2008; 452: 230–233.
38. Clower CV, Chatterjee D, Wang Z, Cantley LC, Vander Heiden MG, Krainer AR. The alternative splicing repressors hnRNP A1/A2 and PTB influence pyruvate kinase isoform expression and cell metabolism. Proc Natl Acad Sci USA 2010; 107: 1894–1899. 39. Diaz-Ruiz R, Uribe-Carvajal S, Devin A, Rigoulet M. Tumor cell energy metabolism and its
common features with yeast metabolism. Biochim Biophys Acta 2009; 1796: 252–265. 40. Meseure D, Drak Alsibai K. Cancer metabolic and immune reprogramming: the intimate
interaction between cancer cells and microenvironment. J Cancer Prev Curr Res 2014; 1: 00006.
41. De Berardinis RJ, Mancuso A, Daikhin E, Nissim I, Yudkoff M, Wehrli S et al. Beyond aerobic glycolysis: transformed cells can engage in glutamine metabolism that exceeds the
requirement for protein and nucleotide synthesis. Proc Natl Acad Sci USA 2007; 104: 19345–19350.
42. Thompson CB. Metabolic enzymes as oncogenes or tumor suppressors. N Engl J Med 2009; 360: 813–815.
43. Xu W, Yang H, Liu Y, Yang Y, Wang P, Kim SH et al. Oncometabolite 2-hydroxyglutarate is a competitive inhibitor ofα-ketoglutarate-dependent dioxygenases. Cancer Cell 2011; 19: 17–30.
44. Gottlob K, Majewski N, Kennedy S, Kandel E, Robey RB, Hay N. Inhibition of early apoptotic events by Akt/PKB is dependent on the first committed step of glycolysis and mitochondrial hexokinase. Genes Dev 2001; 15: 1406–1418.
45. Panasyuk G, Espeillac C, Chauvin C, Pradelli LA, Horie Y, Suzuki A et al. PPARγ contributes to PKM2 and HK2 expression in fatty liver. Nat Commun 2012; 3: 672.
46. Mathupala SP, Heese C, Pedersen PL. Glucose catabolism in cancer cells. The type II hexokinase promoter contains functionally active response elements for the tumor suppressor p53. J Biol Chem 1997; 272: 22776–22780.
47. Dang CV, Lewis BC, Dolde C, Dang G, Shim H. Oncogenes in tumor metabolism, tumorigenesis, and apoptosis. J Bioenerg Biomembr 1997; 29: 345–354.
48. Moll UM, Riou G, Levine AJ. Two distinct mechanisms alter p53 in breast cancer: mutation and nuclear exclusion. Proc Natl Acad Sci USA 1992; 89: 7262–7266.
49. Moll UM, La Quaglia M, Bénard J, Riou G. Wild-type p53 protein undergoes cytoplasmic sequestration in undifferentiated neuroblastomas but not in differentiated tumors. Proc Natl Acad Sci USA 1995; 92: 4407–4411.
50. Tumor metabolism II: multiple roles of hexokinase in tumor development. BioWave 2006; 8: 1. Available at http://bric.postech.ac.kr/myboard/read.php?Board= review0&id =
1308 (accessed 17 March 2009).
51. Pedersen PL. Warburg, me and Hexokinase 2: multiple discoveries of key molecular events underlying one of cancers' most common phenotypes, the "Warburg Effect", i.e., elevated glycolysis in the presence of oxygen. J Bioenerg Biomembr 2007; 39: 211–222. 52. Mathupala SP, Ko YH, Pedersen PL. The pivotal roles of mitochondria in cancer: Warburg
and beyond and encouraging prospects for effective therapies. Biochim Biophys Acta 2010; 1797: 1225–1230.
53. Patra KC, Wang Q, Bhaskar PT, Miller L, Wang Z, Wheaton W et al. Hexokinase 2 is required for tumor initiation and maintenance and its systemic deletion is therapeutic in mouse models of cancer. Cancer Cell 2013; 24: 213–228.
54. Bryson JM, Coy PE, Gottlob K, Hay N, Robey RB. Increased hexokinase activity, of either ectopic or endogenous origin, protects renal epithelial cells against acute oxidant-induced cell death. J Biol Chem 2002; 277: 11392–11400.
55. Escoté X, Fajas L. Metabolic adaptation to cancer growth: from the cell to the organism. Cancer Lett 2015; 356(Pt A): 171–175.
56. Neary CL, Pastorino JG. Akt inhibition promotes hexokinase 2 redistribution and glucose uptake in cancer cells. J Cell Physiol 2013; 228: 1943–1948.
57. Kim JW, Dang CV. Multifaceted roles of glycolytic enzymes. Trends Biochem Sci 2005; 30: 142–150.
58. Majewski N, Nogueira V, Robey RB, Hay N. Akt inhibits apoptosis downstream of BID cleavage via a glucose-dependent mechanism involving mitochondrial hexokinases. Mol Cell Biol 2004; 24: 730–740.
59. Yeung SJ, Pan J, Lee MH. Roles of p53, MYC and HIF-1 in regulating glycolysis - the seventh hallmark of cancer. Cell Mol Life Sci 2008; 65: 3981–3999.
60. Dang CV. c-Myc target genes involved in cell growth, apoptosis, and metabolism. Mol Cell Biol 1999; 19: 1–11.
61. Haupt Y, Maya R, Kazaz A, Oren M. Mdm2 promotes the rapid degradation of p53. Nature 1997; 387: 296–299.
62. DeBerardinis RJ, LumJJ, Hatzivassiliou G, Thompson CB. The biology of cancer: metabolic reprogramming fuels cell growth and proliferation. Cell Metab 2008; 7: 11–20. 63. Shulga N, Wilson-Smith R, Pastorino JG. Sirtuin-3 deacetylation of cyclophilin D induces
dissociation of hexokinase II from the mitochondria. J Cell Sci 2010; 123: 894–902. 64. Chen Y, Fu LL, Wen X, Wang XY, Liu J, Cheng Y et al. Sirtuin-3 (SIRT3), a therapeutic target
with oncogenic and tumor-suppressive function in cancer. Cell Death Dis 2014; 5: e1047. 65. Lee MK, Kang SJ, Poncz M, Song KJ, Park KS. Resveratrol protects SH-SY5Y
neuroblastoma cells from apoptosis induced by dopamine. Exp Mol Med 2007; 39: 376–384. 66. Marie SK, Shinjo SM. Metabolism and brain cancer. Clinics (Sao Paulo) 2011; 66: 33–43. 67. Hu T, Chung YM, Guan M, Ma M, Ma J, Berek JS et al. Reprogramming ovarian and breast cancer cells into non-cancerous cells by low-dose metformin or SN-38 through FOXO3 activation. Sci Rep 2014; 4: 5810.
68. Liu GJ, Cimmino L, Jude JG, Hu Y, Witkowski MT, McKenzie MD et al. Pax5 loss imposes a reversible differentiation block in B-progenitor acute lymphoblastic leukemia. Genes Dev 2014; 28: 1337–1350.
69. Campos B, Wan F, Farhadi M, Ernst A, Zeppernick F, Tagscherer KE et al. Differentiation therapy exerts antitumor effects on stem-like glioma cells. Clin Cancer Res 2010; 16: 2715–2728.
70. Jones CG. Scanning electron microscopy: preparation and imaging for SEM. Methods Mol Biol 2012; 915: 1–20.