RSCAS 2020/32
Robert Schuman Centre for Advanced Studies
Global Governance Programme-395
Aid for trade and trade in services
European University Institute
Robert Schuman Centre for Advanced Studies
Global Governance Programme
Aid for trade and trade in services
Bernard Hoekman and Anirudh Shingal
Terms of access and reuse for this work are governed by the Creative Commons Attribution 4.0 (CC-BY 4.0) International license. If cited or quoted, reference should be made to the full name of the author(s), editor(s), the title, the working paper series and number, the year and the publisher.
ISSN 1028-3625
© Bernard Hoekman and Anirudh Shingal, 2020
This work is licensed under a Creative Commons Attribution 4.0 (CC-BY 4.0) International license. https://creativecommons.org/licenses/by/4.0/
Published in May 2020 by the European University Institute. Badia Fiesolana, via dei Roccettini 9
I – 50014 San Domenico di Fiesole (FI) Italy
Views expressed in this publication reflect the opinion of individual author(s) and not those of the European University Institute.
This publication is available in Open Access in Cadmus, the EUI Research Repository:
Robert Schuman Centre for Advanced Studies
The Robert Schuman Centre for Advanced Studies, created in 1992 and currently directed by Professor Brigid Laffan, aims to develop inter-disciplinary and comparative research on the major issues facing the process of European integration, European societies and Europe’s place in 21st century global politics.
The Centre is home to a large post-doctoral programme and hosts major research programmes, projects and data sets, in addition to a range of working groups and ad hoc initiatives. The research agenda is organised around a set of core themes and is continuously evolving, reflecting the changing agenda of European integration, the expanding membership of the European Union, developments in Europe’s neighbourhood and the wider world.
For more information: http://eui.eu/rscas
The EUI and the RSCAS are not responsible for the opinion expressed by the author(s).
The Global Governance Programme
The Global Governance Programme is one of the flagship programmes of the Robert Schuman Centre. It is a community of outstanding professors and scholars that produces high quality research and engages with the world of practice through policy dialogue. Established and early-career scholars work on issues of global governance within and beyond academia, focusing on four broad and interdisciplinary areas: Global Economics, Europe in the World, Cultural Pluralism and Global Citizenship.
The Programme also aims to contribute to the fostering of present and future generations of policy and decision makers through its executive training programme: the Academy of Global Governance, where theory and ‘real world’ experience meet and where leading academics, top-level officials, heads of international organisations and senior executives discuss on topical issues relating to global governance. For more information: http://globalgovernanceprogramme.eui.eu
The European University Institute and the Robert Schuman Centre are not responsible for the opinions expressed by the author(s).
Abstract
Existing research generally finds weak positive effects of aid for trade (AfT) on aggregate merchandise trade of recipients once endogeneity in the AfT-trade relationship is accounted for. In this paper, we confirm weak findings for both aggregate merchandise and services trade of recipients, using GMM and IV estimations. Moreover, estimates lose statistical significance if non-AfT explanatory variables are treated as endogenous in estimation suggesting identification issues may not have been adequately addressed in extant work. We then examine an alternative proposition: that effects of AfT and different categories of AfT may be observed along the conditional distributions of exports and imports. Our findings confirm this hypothesis. AfT allocated to economic infrastructure, productive capacity building in services and trade policies and regulation is more effective for smaller trading economies, especially in services. We also observe considerable heterogeneity in the trade effects of AfT allocated to individual services sectors, indicating the importance of country-specific diagnostics in targeting AfT allocation.
Keywords
Aid for trade, services trade, endogeneity, quantile analysis.
1
1. Introduction
*The launch of the WTO Aid for Trade (AfT) initiative reflected a recognition that negotiations to lower trade barriers would benefit lower income countries more fully if complemented with development assistance targeted at improving the supply side of the economy (Njinkeu and Cameron, 2007). The international development community has provided significant volumes of aid for trade since the early 2000s (OECD and WTO, 2017). Much of this assistance has been devoted to economic infrastructure, improving productive capacities of firms and efforts to lower trade costs through trade facilitation projects.
Most of the empirical literature is devoted to examining the effects of AfT on different dimensions of merchandise trade, generally finding statistically significant correlations between AfT and different dimensions of goods trade. Work that accounts for endogeneity in the aggregate AfT-trade relationship generally finds weaker effects of AfT on aggregate merchandise trade of recipient countries. More recently, attention has moved to also studying the services trade effects of AfT (Ferro et al. 2014; Martínez-Zarzoso et al. 2017; Hoekman and Shingal, 2020). The focus on services emanates from the increasing role that services are playing in all sectors of the economy and in international trade. A wide range of producer services activities such as finance, information and communications, transport, logistics and professional services are inputs into modern production processes. The availability and cost of services determines economic opportunities and the performance of manufacturing and agricultural sectors. Many services are high productivity activities (Young, 2014) that offer prospects for positive external effects by contributing to the performance of other sectors. Many services are also critical for achieving the sustainable development goals (Fiorini and Hoekman, 2018).
In this paper, we further explore the effects of AfT on trade in services and make two contributions. First, using GMM and IV estimation, we confirm the findings on the weak effect of AfT on aggregate merchandise and services trade of recipients, but show that adding controls for the possible endogeneity of non-AfT explanatory variables results in estimates of the AfT-trade relationship that are no longer statistically significant. Second, since the theoretical AfT-trade literature provides reasons why AfT may or may not be associated with positive trade effects, we examine an alternate proposition: that trade effects of AfT and its sub-types are more likely to be observed along the conditional distribution of exports and imports. We examine this hypothesis using quantile analysis, incorporating recent advancements in the estimation of non-additive fixed-effects IV quantile regressions (Powell, 2015).1
Three stylized facts provide the economic intuition for the alternative proposition. First, the bulk of AfT is allocated to sectors classified as services according to the OECD, including transport and storage infrastructure and information and communications technology (ICT) services. Second, trade costs for services are higher than those for goods, and the rate of decline observed in services trade costs since the early 2000s has been much less than that for goods (Miroudot and Shepherd, 2016), in part reflecting ad valorem equivalents of policy restrictions on services trade that are significantly higher than average import tariffs on goods (Jafari and Tarr, 2017; WTO, 2019). Third, many developing economies have seen significant growth in trade in so-called commercial services. During the 2000s, the group of least developed countries (LDCs) taken together expanded their services exports more rapidly than the world average, suggesting services are an area of revealed comparative advantage. The LDC share of global trade in services rose from 0.4 percent in 2005 to 0.8 percent in 2015, with commercial services exports
*
The project leading to this paper received funding from the European Union's Horizon 2020 research and innovation programme under grant agreement No 770680 (RESPECT). The data used in this study are available on request.
1
This extends the aggregate AfT-trade analysis in Hoekman and Shingal (2020), which focuses on average effects at the mean.
Bernard Hoekman and Anirudh Shingal
2 Robert Schuman Centre for Advanced Studies Working Papers
growing by 14 percent over this period, more than twice the rate of other countries (WTO, 2016), faster than exports of merchandise.
Given that services trade costs are high as a result of policy barriers to trade, technology-related supply constraints and weaknesses in services-related infrastructure and institutions in developing countries, we expect that if AfT is effective, it would have a greater marginal impact in expanding services trade of low-income countries than on trade in goods or on trade of countries that have better infrastructure and institutions. The quantile regression analysis in this paper does not reject this hypothesis. Our results suggest that the heterogeneity of trade in services matters for responses to AfT: the effects of AfT allocated to services are both larger and more precisely estimated at lower quantiles of the services export distribution, and has more limited and smaller effects on merchandise trade relative to those observed for services trade. We also find that AfT allocated to non-services activities is not associated with a statistically significant positive effect on either exports or imports of goods and services.
Our identification strategy exploits changes in the AfT-recipient status of some of our sample countries over the time period of analysis (2002-2015) and instruments AfT with the average AFT in the geographical neighbourhood of a recipient country following Uberti and Jackson (2020). In a departure from existing literature, we also treat non-AfT explanatory variables as endogenous in our estimation strategy as these variables are unlikely to be exogenous to goods and services trade.2 This more complete treatment of endogeneity results in estimated effects of AfT on aggregate merchandise trade of recipients no longer being statistically significant, in contrast to the positive, if weak, effects of AfT on merchandise trade found in existing literature.
The plan of the paper is as follows. Section 2 briefly discusses insights and hypotheses emerging from previous analysis on the relationship between AfT and trade and reviews the related literature. Section 3 describes the AfT variables and the allocation of AfT across countries and sectors. Section 4 presents the empirical methodology and data used in the analysis. Section 5 presents the findings. Section 6 concludes.
2. Related literature: conceptualizing the AfT-trade relationship and previous research
In their survey of the AfT-trade literature, Suwa-Eisenmann and Verdier (2007) note that “aid flows may affect trade flows, either because of the general effects they induce in the recipient country, or because aid is directly tied to trade, or because it reinforces bilateral economic and political links (or a combination of all three).” However, considerable ambiguity persists on the major transmission channels for the trade-enhancing effects of AfT, “not to speak of the relative effects on trade in opposite directions” (Hühne et al. 2014).From a macroeconomic perspective, aid supplements domestic savings, permitting more investment, which in turn leads to higher rates of economic growth in the recipient country (White, 1992). An increase in growth also increases the absorption capacity of the recipient, including for imports from donor countries. Aid is often conditional upon structural reforms in the recipient country and if these reforms include trade liberalization there is a direct effect of AfT on trade. Alternatively, the effect is indirect insofar as other reforms stimulate economic growth, which in turn enhances trade. But these effects can work in the opposite direction if aid crowds out domestic investment or if aid is tied to counterpart funds or if aid is fungible (Heller, 1975). Similarly, the ‘Dutch-disease’ effects of aid can lead to an appreciation of the real exchange rate in the recipient country, increasing the demand for imports, worsening the external balance and making the recipient even more ‘aid-dependent’.
2
This has been largely overlooked in existing cross-country studies using aggregate data. We thank an anonymous referee for pointing this out.
Aid for trade and trade in services
European University Institute 3
In contrast, if aid is tied to donor exports to the recipient, it becomes an instrument of trade policy (Morrissey, 1991). Tied aid can also have dynamic effects in the recipient country, encouraging follow-up orders and expanding future exports from the donor country. At the same time, given the tendency for tied exports to be over-priced (Jepma, 1991), higher prices of imported capital goods can stall growth and subsequent trade capacity of the recipient country. Thus, tied aid may increase trade flows in the short run but decrease them in the long run. Moreover, the recipient country might reduce overall imports if its terms of trade deteriorate as a result of high-cost tied aid (Tajoli, 1999), so the effect on donor exports is likely to depend on the degree and direction of trade diversion.
In sum, while aid may be expected to have a positive impact on aggregate trade, there are several potential reasons why such an impact might not be observed. Given that the use of tied aid should in principle have declined over time following donor implementation of the Paris principles on aid effectiveness, there is a presumption that positive effects are more likely to be observed in more recent time periods. Of course, this is conditional on donors no longer tying aid, on both a de facto as well as a de jure basis.
Aid allocated to economic infrastructure (transport, ICT and energy) is expected to have the most direct effect on economic growth and trade, especially on recipient exports (Calì and Te Velde, 2011; Vijil and Wagner, 2012). If donors target AfT by selecting infrastructure projects that primarily serve their own export interests, they may also enhance recipient imports (Hühne et al. 2014). As the following section will show, economic infrastructure accounts for the bulk of AfT allocated to developing countries over 2002-2015 and all its three constituent sectors are classified as “services” by the OECD Secretariat. This, together with the increasing servicification of economic activity, explains the a priori positive and most direct relationship between AfT allocated to services activities and trade of recipient countries (both merchandise and services trade).
Most empirical research on AfT is cross-sectional in nature and involves cross-country analysis, assessing the effects of AfT on (different dimensions of) merchandise trade. Cadot et al. (2014) review much of the literature. Examples include Brenton and von Uexkull 2009; Cali and te Velde, 2011; Königer et al. 2011; Busse et al. 2012; Helble et al. 2012; Portugal-Perez and Wilson, 2012; Vijil and Wagner, 2012; Nowak-Lehmann et al. 2013; Pettersson and Johansson 2013; Ferro et al. 2014; and Hühne et al. 2014.
A particular focus within this literature has been on AfT in support for trade facilitation, reflecting the effort to negotiate an agreement on trade facilitation in the WTO and efforts by developing countries to reduce trade costs. Martínez-Zarzoso et al. (2009), Skärvall (2012), Bearce et al. (2013) find that aid for trade has a strongly trade-promoting effect, especially AfT for trade facilitation. The latter type of AfT has also been found to support greater diversification. See e.g., Beverelli et al. (2015) and Persson (2013).
The present paper is most closely related to three contributions to this literature. Ferro et al. (2014) focus on AfT directed towards service sector-related projects and activities and investigate the relationship between such AfT and merchandise exports. They find that AfT allocated to services sectors increases manufactured exports of the recipient countries. Hoekman and Shingal (2020) use both aggregate and available bilateral data for a subset of countries on merchandise and services trade and AfT allocated to services and non-services sectors, respectively, to examine the effect of AfT on trade. Their dyadic analysis suggests that AfT, in particular that allocated to economic infrastructure, has a positive effect on donors’ merchandise imports from recipient countries. In this paper we use a different instrument for AfT, control for the potential endogeneity of non-AfT explanatory variables and undertake quantile analysis to examine the effects of AfT for small versus large-value trading economies.
Martínez-Zarzoso et al. (2017) also examine the effects of AfT on goods and services exports using quantile regressions and find that AfT mainly promotes goods exports for the lower quantiles of the conditional export distribution, with no effects observed on services exports. We complement this paper
Bernard Hoekman and Anirudh Shingal
4 Robert Schuman Centre for Advanced Studies Working Papers
by studying disaggregated effects of AfT by sector and examining the effects of AfT and its sub-types on imports. Moreover, we account for non-additive fixed effects in the quantile regressions using the single-step procedure of Powell (2015), which likely explains the difference in our findings relative to Martínez-Zarzoso et al. (2017) who use the two-step approach of Canay (2011).
Another strand of research has examined the impact of AfT on investment. Such work includes Harms and Lutz (2006), Selaya and Sunesen (2012), Donaubauer et al. (2016) and Lee and Ries (2016). These studies generally find positive associations between measures of AfT and investment. We add to this literature as well by analyzing the relationship between AfT and Mode 3 services trade flows (sales through a commercial presence), utilizing a new WTO dataset, TiSMoS, that breaks down trade in services by modes of supply.3
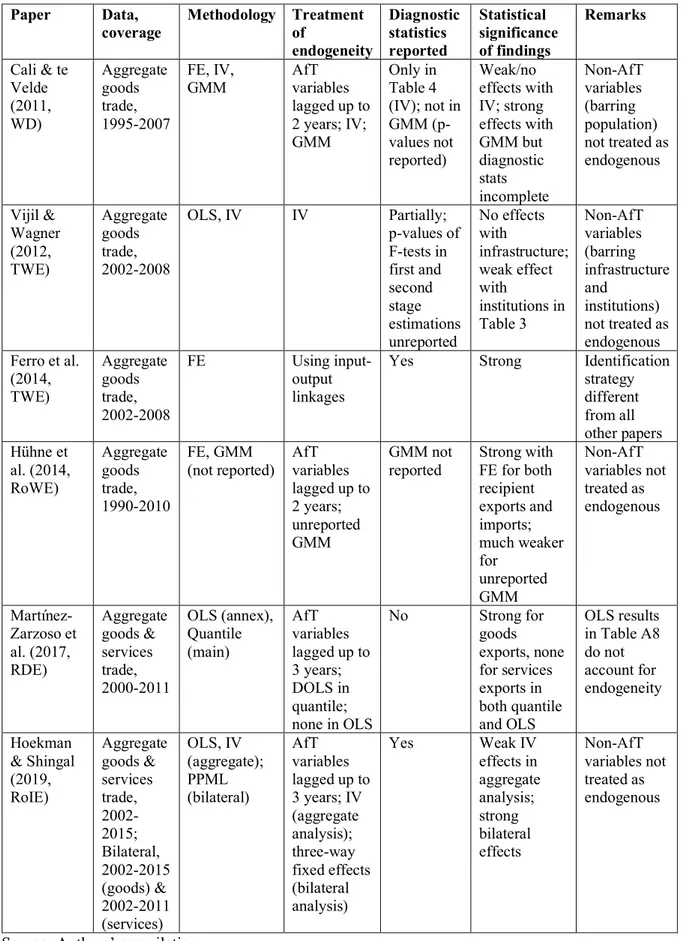
Table 1 summarizes estimation methodologies, the treatment of endogeneity, reporting of diagnostic statistics on IV/GMM specifications and statistical significance of findings in existing cross-country AfT-trade studies that use aggregate trade data. Early work finding positive AfT effects on merchandise trade was based on OLS estimations. Subsequent research using IV and GMM specifications to account for endogeneity in the AfT-trade relationship reports weak results but most studies do not report complete diagnostic statistics on the validity of the instruments used in the IV/GMM specifications. More importantly, none of these studies treat all non-AfT explanatory variables as endogenous in their estimation strategy, which we do.
3. AfT definitions and allocations
In the empirical analysis that follows we use data from the OECD Creditor Reporting System (CRS). The CRS spans data on official development assistance (ODA) that is committed and disbursed by donor countries in recipient countries. The dataset spans a large sample of countries and sectors for the 2002-2015 period. AfT is a subset of total ODA and comprises the following three categories: (i)technical assistance for trade policy (e.g. helping countries to develop trade strategies and negotiate trade agreements); (ii) trade-related infrastructure (e.g. roads, ports, and telecommunications networks); and (iii)productive capacity building for trade (e.g. supporting the private sector to expand exports).4
The CRS does not provide data that exactly match these AfT categories. Only parts of ODA data are reported as aid going to building economic infrastructure and to the creation of “productive capacity”. Infrastructure includes several services sectors – e.g., transport, storage, and information and telecommunications networks – for which data are reported separately. Aid for productive capacity spans all sectors of the economy, and thus includes services. Three services activities are split out in the CRS for this productive capacity AfT category: banking and financial services, business and other services, and tourism. Note that CRS data are proxies at best for aid targeting trade-related infrastructure and productive capacity building, as not all of ODA reported under these headings is trade-related. This said, ODA statistics reported under these headings are the closest approximation of AfT going to services.5
3
The WTO General Agreement on Trade in Services (GATS) distinguishes between four modes through which services trade can be transacted. These comprise cross-border trade or Mode 1 (e.g. services transactions using the internet); consumption abroad or Mode 2 (e.g. education, health and tourism services where a buyer goes to the location of the provider of services); commercial presence or Mode 3 (e.g. sales of retail financial services by an affiliate or branch of a foreign commercial bank); and the movement of natural persons or Mode 4 (e.g. IT programmers working abroad).
4
The OECD includes two other categories of AfT: trade-related adjustment assistance and aid to address other trade-related needs identified as development priorities by partner countries' national development strategies. Donors report very little aid falling under these categories and we do not use them in the analysis.
5
No data are reported regarding allocations to services sectors for other categories of AfT (technical assistance for trade policy and regulations, trade-related adjustment and other trade-related needs).
Aid for trade and trade in services
European University Institute 5
Total AfT disbursements increased from US$9.1bn in 2002 to an average of US$21bn in 2006-2008 to $39.8bn in 2015 (OECD and WTO, 2017). Asian and African countries have been the major recipients of AfT disbursements, each region accounting for around 40 percent of total AfT global aid since 2002. The global distribution is qualitatively similar when we look at AfT allocated to services sectors. We define AfT for services to span the following six categories of AfT: (1) assistance to economic infrastructure in three sectors, transport/storage; ICT and energy; and (2) assistance for productive capacity building in financial services, business services and tourism activities. We do so largely because these six categories are identified in the OECD data on AfT as services.6 Globally, AfT mapped to these six categories increased from 59 percent of total AfT to 72.4 percent in 2015. Thus, most AfT over the period was allocated to services sectors, a feature of AfT that is generally not emphasized in AfT reporting or analysis.7 Within services, the transport and energy sectors have been the largest recipients of global ODA disbursements, accounting for 45.9 and 30.2 percent, respectively, of total AfT in services disbursed over 2012-2015 on average.
In the empirical analysis that follows, we abstract from the quality and suitability of the data on hand. As is stressed in the literature on trade in services, data quality is a concern and a constraint. The availability and quality of even aggregate services trade data in low-income countries is poor and the coverage of bilateral disaggregated services trade data amongst non-OECD countries is extremely limited.8 We also take the OECD sector definitions of AfT as given but recognize there may be concerns whether annual AfT disbursements adequately capture the allocation and implementation of AfT within recipient countries and across sectors. There is considerable variation across countries between types of AfT. Similarly, there is variation in the time required for disbursing commitments, implementing projects and the duration of AfT projects. There will also be variable lags in the impact of completed projects on exports and imports of different types, all of which could have a bearing on estimates from empirical analysis.
These data quality problems could affect the results of the analysis. In the case of trade data, use of bilateral data will greatly improve the quality of inference. But as these do not exist for many of the countries that are the focus of AfT,9 there is no choice but to use aggregate data. This has the advantage of being consistent across countries – similar classifications are used by all countries. Lags in disbursement and average length of implementation of projects are both project- and country-specific. Infrastructure takes more time than AfT going to trade policy regulation, so estimates of the trade effects of AfT allocated to economic infrastructure may be biased downwards. Similarly, countries with weak institutions and governance may experience longer lags between commitments and completion of projects. In the absence of detailed data on projects/countries/donors we rely on our explanatory variables and their variation to control for these factors.
Concerns have also been expressed by practitioners about the quality of AfT data, notably the definition of AfT (i.e., differentiating between trade and non-trade-related ODA), which inherently embodies an element of subjectivity. While we recognize these concerns, data compilation by the OECD has been informed by regular consultations and review by donors and recipients, including through the
6
Although technically energy is not regarded as a services sector in the national accounts or the BOP(e.g., electricity is a good), part of the AfT going to this sector involves distribution of energy grids, pipelines, storage, etc.).
7
Ferro et al. (2014) and Hoekman and Shingal (2020) are exceptions.
8
Shingal (2015) provides an in-depth discussion of collection, measurement and reporting of services trade statistics in low-income countries.
9
One attempt at addressing this constraint is the OECD-WTO Balanced Trade in Services Database (BaTiS) which provides bilateral and disaggregated services export and import data among 190 reporting and partner countries from 1995 to 2002 according to the EBOPS 2002 sector classification. While this database covers all AfT recipients in this paper, their bilateral services trade data is constructed in BaTiS using empirical techniques. Using these constructed data to evaluate the effect of AfT is therefore not appropriate as the bilateral flow data is estimated and does not reflect actual bilateral services trade flows.
Bernard Hoekman and Anirudh Shingal
6 Robert Schuman Centre for Advanced Studies Working Papers
bi-annual Aid for Trade review meetings that are held at the WTO and that bring together the international development community working on trade. Moreover, whatever biases may be embedded in the data as a result of categorization decisions will apply to all flows reported by the OECD, and thus should not be a concern in terms of influencing only our results, as they will have a bearing on the findings observed in the entire empirical AfT-trade literature.
4. Empirical methodology and data
4.1 AfT and aggregate trade
Following previous studies, we assess the relationship between AfT and aggregate goods and services trade by estimating the following augmented export supply and import demand functions using fixed effects specifications:10
xjt = 𝛼0+𝛼1aftjt-1+𝛼2NAfTjt-1+𝛽kzkjt-3+j+t+𝜀jt (1)
mjt = 𝛼0+𝛼1aftjt-1+𝛼2NAfTjt-1+𝛽kzkjt-3+j+t+𝜀jt (2)
where xjt is the log of services (goods) exports of AfT recipient j in year t; mjt is log of (goods) services imports of recipient j in year t; aftjt-1 is the log of AfT in recipient j in year t-1; zkjt-3 is a vector of recipient-time varying non-AfT controls lagged by three time periods to mitigate endogeneity-related concerns in estimation; j are recipient fixed effects; t are year fixed effects and jt is the error term.
Consistent with other papers analyzing the AfT-trade relationship, we allow trade flows to respond to AfT with a lag and also experiment with alternative lag structures. To accommodate zero AfT flows in the analysis (which are more prevalent in the disaggregated decompositions of AfT data), following the methodology suggested by Wagner (2003), we define aftjt-1 as ln(max{1,AfTjt-1}) and include a NAfTjt-1 dummy in the estimating equations, which takes the value of 1 when AfT=0 and is zero otherwise. Thus, the coefficient of aftjt-1 measures the elasticity of exports (or imports) where AfT is positive while the coefficient of NAfTjt-1 serves as an adjustment to the constant in cases where AfT is zero. The log of trade when AfT is positive exceeds the log of trade when AfT is zero by 𝛼1lnAfT- 𝛼2 i.e. xjt|AfT>0-xjt|AfT=0 = 𝛼1lnAfT- 𝛼2.
To enhance comparability of results, we also follow the existing literature in the choice of explanatory variables (Cali and Te Velde, 2011; Martínez-Zarzoso et al. 2017). The control vector comprises a measure of country size – the log of population(POPjt-3); a measure of geographic distance to global markets – the log of market penetration (MPjt-3), computed as a distance (dij) weighted measure of other countries’ GDP (GDPit-3),11 i.e. MPjt-3 = i(GDPit-3/dij); a measure of domestic prices – (log of) the consumer price index (CPIjt-3),12 and a measure of government effectiveness (GEjt-3) that reflects the institutional strength of the AfT recipient country. We expect each of these variables to be positively correlated with aggregate goods and services exports and imports, which justifies their choice as controls in the estimating equations.
10
This is consistent with other studies in the literature such as Cali and te Velde (2011), Martínez-Zarzoso et al. (2017) and Hoekman and Shingal (2020).
11
Note that the market potential of country j at time t is calculated as the sum of the (inverse) bilateral distance weighted GDPs of all other countries and not only of all countries for which we analyse the effect of AfT on trade - which are primarily developing countries.
12
Using the CPI instead of the real effective exchange rate (REER) maximizes the number of observations for empirical analysis. Our overall findings are robust to using the REER.
Aid for trade and trade in services
European University Institute 7
Following Hoekman and Shingal (2020), we also include inward foreign direct investment (FDIjt-3) in the recipient country as an additional control. This is motivated by the observation that some two-thirds of international provision of services occurs through sales of services by foreign affiliates that have established a commercial presence in export markets (WTO, 2019). Moreover, FDI is a key element of many global value chains (GVCs) and a driver of the associated cross-border flows of services that occur within GVCs, both directly through the provision of “headquarters services” and indirectly through embodiment of services in the value of the products that are produced.
Finally, in the spirit of Hühne et al. (2014), we include trade costs as additional controls in equations (1) and (2). The TCjt-3 variable is constructed from a structural gravity model of bilateral (services and merchandise) trade over 1999-2012 with time-varying importer (j) and exporter (i) fixed effects and standard gravity controls (bilateral distance, contiguity, common language, common colonial antecedents and common legal systems) as well as membership of preferential trade agreements (PTAs). The estimated coefficients (k1-k7) are used as weights in constructing TCjt-3 as follows:
TCjt − 3 = ∑𝑛 𝑙𝑛𝐷𝐼𝑆𝑇𝑖𝑗𝑘1𝐶𝑁𝑇𝐺𝑘2𝐿𝐴𝑁𝐺𝑘3𝐶𝐿𝑁𝑌𝑘4𝐶𝑂𝑀𝐶𝑂𝐿𝑘5𝐶𝑂𝑀𝐿𝐸𝐺𝑘6𝑃𝑇𝐴𝑘7
𝑖=1 (3)
where n is the total number of exporting countries per importing country. The time-varying exporter and importer fixed effects in the gravity model also control for GDP and population of the partner countries. Since GDP (via market potential) and population are already included as control variables in equations (1) and (2), we do not include these variables in constructing TCjt-3 as that is likely to lead to multicollinearity.
To study trade effects by type of aid, we follow the OECD classification and decompose aggregate AfT into two parts, ‘services’ and ‘non-services’ as well as into three broad categories: AfT for economic infrastructure, AfT for productive capacity building and AfT for trade policies and regulation. In addition, AfT in productive capacity building is further decomposed into services and non-services. Finally, we also examine the sectoral relationship between trade and AfT for seven disaggregated services sectors: business, communications, computer-and-related services, energy, financial, tourism and transport services.13
To control for endogeneity in the aggregate AfT-trade relationship, we deploy both IV and GMM (difference and system) estimations. Following Uberti and Jackson (2020), we instrument for AfT in each recipient country j at time t by the average AfT received by all its neighbouring countries in the geographical neighbourhood at the same time t.14 This differentiates the IV analysis from that in Hoekman and Shingal (2020) who follow the synthetic instrument approach of Temple and Van der Sijpe (2017). In a departure from existing literature, we also treat non-AfT explanatory variables as endogenous in our estimation strategy in both GMM and IV specifications. In the latter, these variables are also instrumented using their “neighbourhood-averages” as done in the construction of the AfT instruments.
4.2 Quantile analysis
We use quantile regressions to examine whether the trade effects of AfT depend on the magnitude of the trade of AfT recipient countries, to reflect the possibility that AfT effects are more likely to be observed for countries with low levels of exports or imports (i.e., the marginal effect of AfT may be higher for such countries) and/or countries that already have an established ‘trade footprint’ and can use
13
Computer-and-related services are included in the communications sector in OECD AfT data.
14
A recipient's neighbouring countries are likely to be associated with similar determining characteristics for attracting AfT given proximate geographical location. The geographical regions include North Africa, Sub-Saharan Africa, Caribbean, Central America, South America, Central Asia, West Asia, South Asia, South-east Asia, Europe and Oceania.
Bernard Hoekman and Anirudh Shingal
8 Robert Schuman Centre for Advanced Studies Working Papers
AfT more effectively than other nations to scale up trade flows further. In both cases, such effects could work through the intensive or the extensive margin.
In quantile regression models, the quantiles of the conditional distribution of the dependent variable are expressed as functions of the observed covariates. Their main advantage lies in interpreting potentially different solutions at distinct quantiles as differences in the response of the dependent variable to changes in the regressors at various points on the conditional distribution of the dependent variable. In the context of this paper, quantile regressions allow us to trace the entire export and import distribution, for goods and services, respectively, conditional on the regressors included in equations (1) and (2).
The estimation of these equations based on the qth quantile regression (0<q<1) and the set of covariates Zjt minimizes the absolute value of the residual. The objective function is as follows (Cameron and Trivedi, 2009):
(𝑄(𝛽q)= 𝑚𝑖𝑛𝛽 ∑𝑛𝑗=1[|Yjt − Zjt 𝛽q|]= min[∑𝐽:𝑌𝑗𝑡≥𝑍𝑗𝑡𝛽q|Yjt − Zjt 𝛽q|+ ∑𝐽:𝑌𝑗𝑡<𝑍𝑗𝑡𝛽(1 − q)|Yjt − Zjt 𝛽q|] (4)
where yjt is the dependent variable and 𝛽 is the vector of estimated parameters.
To account for non-additive fixed effects in the quantile regressions, we use the single-step procedure of Powell (2015). This is an improvement over the two-step approach of Canay (2011), as it addresses a fundamental problem posed by fixed-effect quantile estimators, i.e. inclusion of fixed effects alters the interpretation of the estimated coefficient on the treatment variable. In conditional quantile models, the parameters of interest are assumed to vary based on a nonseparable error term. Canay (2011) assumes the fixed effects to be location shifters and uses estimates of these fixed effects from a within-FE model in stage one to demean the dependent variable, the transformation of which is then used as the dependent variable in quantile analysis in stage two. This treatment of fixed effects alters the structure of the quantile function, causing a bias even if the treatment variable is randomly assigned. The single-step estimation of Powell (2015) circumvents this problem by maintaining the nonseparable error term commonly associated with quantile estimation.
4.3 Data sources and summary statistics
As noted previously, annual AfT data come from the OECD CRS and span the 2002-2015 period. Aggregate goods and services trade data for this period are sourced from UN Comtrade. Data on services trade by modes of supply come from WTO (2019) and are available for 2005-2017, yielding an eleven year overlap with the AfT data. The control variables are sourced as follows: the consumer price index (CPIjt-3), foreign direct investment (FDIjt-3) and population (POPjt-3) are taken from the World Development Indicators; market penetration (MPjt-3) is computed using bilateral distance data from CEPII (Head et al. 2010); GDP data come from the World Development Indicators and government effectiveness (GEjt-3) is sourced from the Worldwide Governance Indicators (Kaufmann et al. 2011). Standard gravity covariates used in the gravity model to construct TCjt-3 are sourced from CEPII (Head et al. 2010) while the PTA membership dummy was constructed using data from the WTO RTA-IS database, for goods and services agreements notified under Article XXIV of the GATT and Article V of the GATS, respectively. Bilateral merchandise trade data for the gravity model is from BACI (Gaulier and Zignago, 2010), while bilateral services trade data were taken from the OECD-WTO BaTiS database. The bilateral trade data (both goods and services) span the years 1999-2012 to enable construction of TCjt with a three-year lag.
The analysis is carried out on 159 ODA recipients over 2002-2015; the sample of recipients is reported in Annex Table A. Fourteen countries in our sample witnessed a change in their AfT-recipient
Aid for trade and trade in services
European University Institute 9
status over the period of analysis, a fact that we exploit in identification.15 Summary statistics are reported in Annex Table B. The dataset has over 1800 observations on goods and services trade and the aid variables.
5. Results
5.1 Aggregate analysis (IV)
Equations (1) and (2) are estimated separately for goods and services exports and imports, using IV and GMM specifications with three decompositions of AfT: (i) distinguishing AfT allocated to services (AfT_Ser) from AfT going to non-services sectors (AfT_Non_Ser); (ii) splitting AfT into four types: AfT allocated to economic infrastructure (AfT_EI), productive capacity building in services (AfT_PCB_Ser), productive capacity building in non-services (AfT_PCB_Non_Ser), and support for trade policies and regulations (AfT_TPR); and (iii) differentiating between the sectoral allocation of services AfT. The data permit us to distinguish between AfT allocated to transport services, communications services, financial services, energy services, computer-and-related services, other business services and travel services. The AfT variables were lagged by one, two and three time periods, in distinct specifications, while the non-AfT regressors were lagged by three time periods. All regressions controlled for country (recipient) and year fixed effects, with standard errors clustered by country-year.
The 2SLS IV estimates for AfT and its sub-types for both goods and services exports and imports, were found not to be statistically different from zero across all lag structures. This is a significant departure from the positive, albeit weak, effects of AfT on merchandise trade that have been found in the IV results in existing literature. This is likely attributable to our treatment of the non-AfT regressors as endogenous. While the GMM results show some evidence of positive effects for disaggregated and sectoral AfT, especially on the export side, the validity of the instruments was consistently rejected in the diagnostic statistics.
Given the country and time coverage of our data, we also examined the sensitivity of our IV results to including different sub-samples. We excluded the Gulf countries and Libya from the dataset, given the oil-dependent nature of their economies; decomposed the country sample by World Bank income classification; split the panel into two time periods, pre and post global financial crisis; and considered cross-sectional analysis by averaging all data over 2002-2015. In all these instances, the 2SLS IV estimates for AfT and its decompositions, for both goods and services exports and imports were found to be statistically insignificant. These results are not reported here but are available upon request.
As services trade effects of AfT might vary across modes of supply used, we used a new database released by the WTO Secretariat, TiSMoS, breaking down aggregate trade in services across modes of supply for 200 economies over 2005-2017 to replicate the analysis for different modes for the overlapping time period (2005-2012). The IV estimates were found not to be statistically significant irrespective of the mode of service delivery and lag structure.16
15
These include Bahrain, which became a non-AfT recipient after 2004; Malta and Slovenia that only received AfT in 2002; Saudi Arabia and Turks & Caicos Islands that became AfT-non-recipients after 2007; Kosovo that only began receiving AfT after 2008; Croatia, Mayotte, Oman and Trinidad & Tobago that became AfT-non-recipients after 2010; Belarus, Libya and Ukraine that only began receiving AfT after 2004; and South Sudan that was an AfT-non-recipient before 2011.
16
These results are not reported and available upon request. Note that much of Mode 4 trade is associated with – or comprises – the cross-border movement of intra-corporate transferees from FDI home countries to FDI destination countries, or movements between affiliates located in different host countries. This justifies the use of FDI as a control variable in the Mode 4 regressions.
Bernard Hoekman and Anirudh Shingal
10 Robert Schuman Centre for Advanced Studies Working Papers
5.2 Quantile analysis (IV)
The lack of a statistically significant relationship between aggregate trade in goods or services and AfT received by a country is consistent with the theoretical AfT-trade literature which concludes that the sign of the association is ambiguous for both recipient country exports and imports. In this subsection, we examine an alternate proposition, that trade effects of AfT and its sub-types may more likely be observed along the conditional distribution of trade, than at the conditional mean. The economic intuition underlying this proposition was discussed in Section 1.
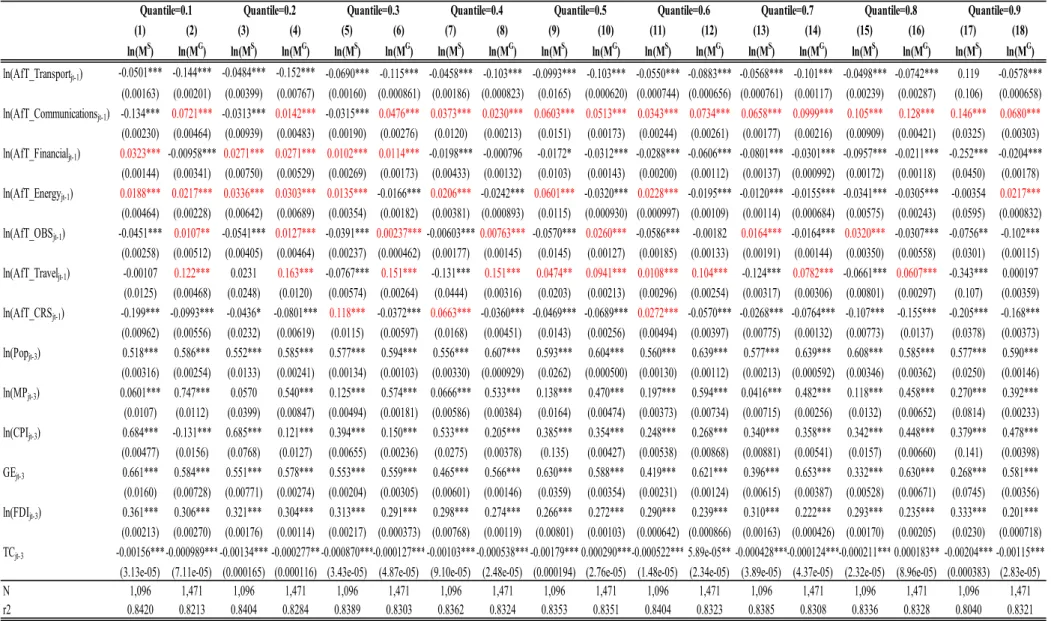
We examine this hypothesis using fixed effects IV quantile regressions.17 The results from these regressions, for AfT variables lagged by one time period, are reported in Tables 2 and 3 for exports and imports, respectively. Estimates of all the non-AfT regressors were found to be statistically significant with the expected signs, suggesting that the empirical model is well-specified for both exports and imports. In all cases, the R-squares range from 75-85 percent, indicating that the explanatory variables account for substantial variation in the dependent variables.
The results reported in Tables 2 and 4 reveal that the effects of AfT allocated to services, including economic infrastructure and productive capacity building, as well as AfT allocated to trade policies and regulation, are both larger and more precisely estimated for lower quantiles of the services export distribution. As the countries that account for this part of the distribution tend to be lower-income and smaller economies these results suggest such AfT is more likely to achieve its purported objective – trade promotion – for certain types of recipients. Illustratively, a doubling of AfT allocated to services activities is associated with a 3.5 percent increase in services exports at the first quantile, an 18.6 percent increase at the third quantile, 1.3 percent increase at the fifth quantile, and a 4.8 percent increase at the seventh quantile (see columns 1, 5, 9 and 13 of Table 2). The effects of AfT and its broad sub-types on services imports, reported in Tables 3 and 5, follow a similar pattern as that for services exports but are smaller in magnitude.
In contrast, evidence on the relationship between AfT in services and merchandise trade in the results reported in Tables 2-5 is more limited and the effects are also smaller in magnitude relative to those for services trade. We observe a positive effect of AfT allocated to services activities only on merchandise imports for the second and eighth quantiles of the merchandise imports distribution – a doubling of such AfT is associated with a 3.4 and 0.96 percent increase, respectively (see columns 4 and 16 of Table 3). In contrast, AfT allocated to productive capacity building in services reports larger effects on both merchandise exports and imports at the lower quantiles, with the maximum impact observed for the first quantile in the case of exports (estimated coefficient of 0.05 in column 2 of Table 4) and for the second quantile in the case of imports (estimated coefficient of 0.11 in column 4 of Table 5). The effects of AfT allocated to trade policies and regulation also decline along the distribution of merchandise exports and imports and are smaller in magnitude to those for services exports (see Table 4).
AfT allocated to non-services activities does not have a positive effect on either exports or imports of goods and services – the quantile analysis results for non-services AfT are not statistically significant in the results reported in Tables 2-5. The complete absence of a statistically significant positive effect of AfT allocated to non-services activities on trade in both aggregate and quantile analysis is likely attributable to a “volume” effect given that AfT allocated to the six services categories accounted for more than 70 percent of total AfT in 2015.
Our findings contrast with Martínez-Zarzoso et al. (2017), where the trade effects of AfT decline along the conditional distribution and are observed primarily for goods exports. This is likely attributable to accounting for non-additive fixed effects in the quantile regressions using the single-step procedure
17
The quantile regressions were estimated in STATA using the Qregpd estimator developed by Powell (2015) to account for non-additive fixed effects. The optimization technique used was adaptive Markov Chain Monte Carlo. The explanatory variables were instrumented using the average received by a recipient's neighbouring countries in the geographical neighbourhood.
Aid for trade and trade in services
European University Institute 11
of Powell (2015), vis-a-vis the two-step approach of Canay (2011) employed by Martínez-Zarzoso et al. (2017).
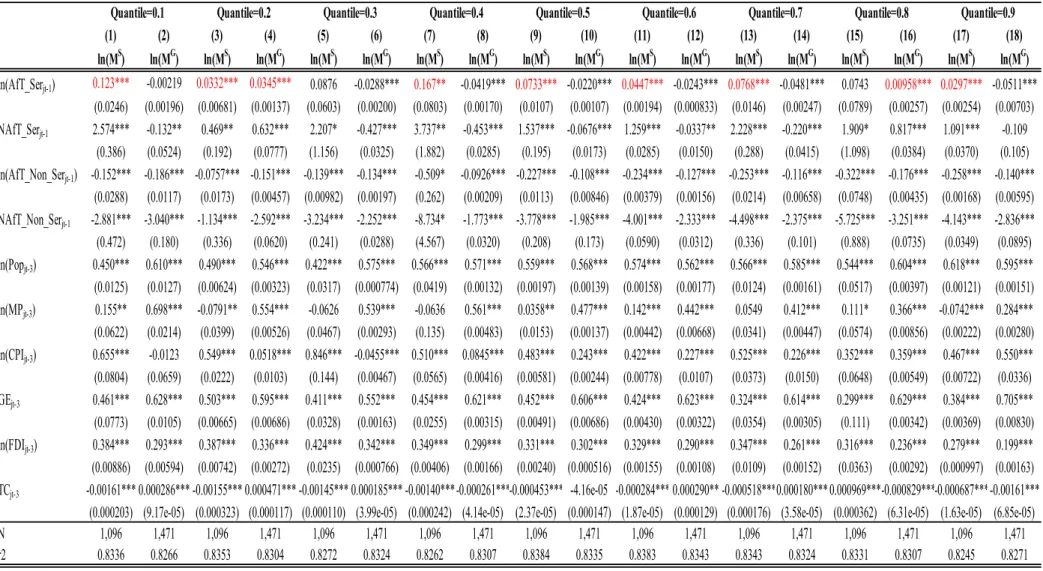
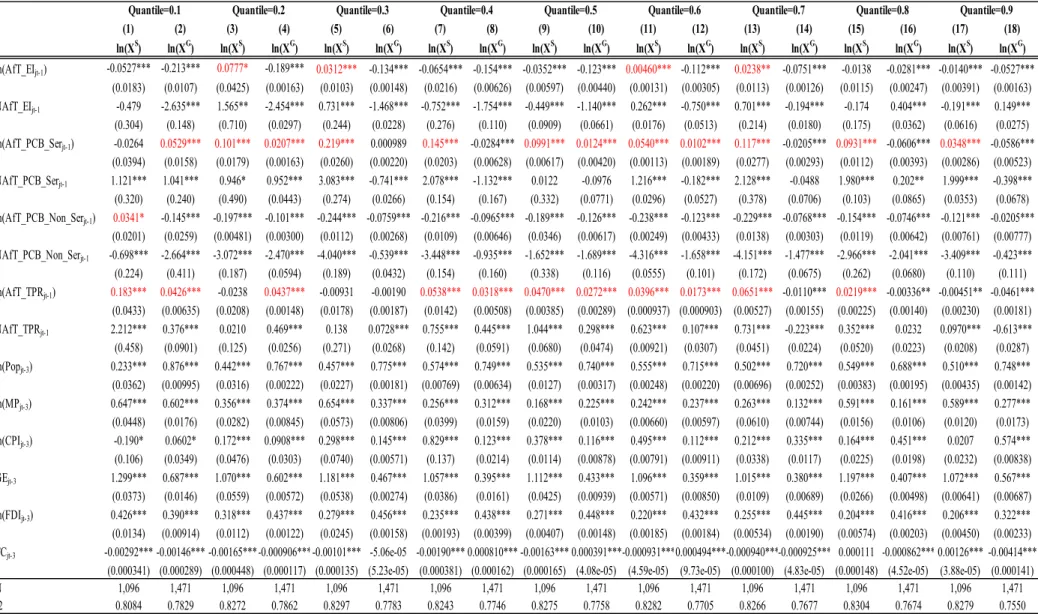
As expected, there is considerable heterogeneity in the quantile analysis results for AfT allocated to different services sectors in the results reported in Tables 6 and 7, for exports and imports, respectively. Effects of AfT allocated to communications and travel services (as well as computer-related services and services imports) follow a U-shape for both goods and services along the conditional distribution of exports and imports. In the case of financial services (as well as computer-related services and merchandise exports), the effects exhibit a declining pattern. Thus, AfT allocated to these sectors seem to matter for smaller trading economies, which presumably are the primary focus of AfT efforts. In contrast, AfT allocated to energy and other business services is more effective for larger services trading economies, with apparent limited salience for merchandise traders. Estimates for AfT allocated to transport services are not statistically significant for either exports or imports of goods and services.
In sum, AfT allocated to services sectors and activities is found to enhance services exports of smaller exporting countries, suggesting that such AfT meets its claimed objective. This is particularly true of AfT allocated to economic infrastructure and productive capacity building in services and AfT allocated to communications, financial and travel services at the sector-level. The finding that larger exporting countries benefit from AfT allocated to trade policies and regulation makes intuitive sense given that such countries are likely to be relatively less capacity constrained and hence, more capable of utilizing aid to their advantage.
An implication of these results for AfT design and implementation is that the heterogeneity of trade matters for responses to AfT. From a donor perspective, the same volume of aid allocated to services activities may be more effective for small services exporters and importers. If the objective includes maximizing returns on aid allocation from both the individual donor and the international donor community perspectives, then these results indicate that the marginal gains from AfT to small-value trading economies may be larger, which has important implications for aid-targeting. Moreover, in so far as some of this aid also enhances recipient imports from donors (and even recipient exports to donors in a world of GVCs where cheaper imported inputs matter), it also strengthens the political economy argument in favour of providing aid.
6. Conclusion
Many dimensions of the potential relationship between AfT and the trade performance of recipient economies have been studied in the literature on this subject. A common characteristic of this research is that it mostly focuses on the effects of AfT on merchandise trade, and to a lesser extent, on investment flows. The analysis in this paper complements Ferro et al. (2014) and Hoekman and Shingal (2020) by focusing on AfT and trade in services, and Martínez-Zarzoso et al. (2017) by examining the AfT-trade relationship along the conditional distribution of exports and imports using quantile regression analysis.
Our results suggest that the effects of AfT allocated to services, including economic infrastructure and productive capacity building, as well as AfT allocated to trade policies and regulation are both larger and more precisely estimated for smaller services exporting and importing countries. Thus, AfT disbursement seems to meet its purported objective – to expand recipient participation in global trade. The results also indicate that the heterogeneity of trade, especially trade in services, matters for its response to AfT. Thus, smaller services trading economies may be more responsive to the allocation of AfT and its major sub-types, which can be a useful take-away for AfT design and implementation. At the same time, AfT allocated to non-services activities does not have a positive effect on either exports or imports of goods and services, which again is relevant for AfT design and implementation. The effects of a given type of AfT may vary across recipient countries, suggesting that policy-makers need to target AfT carefully and avoid a “one-size-fits-all” approach in determining where to allocate AfT.
Bernard Hoekman and Anirudh Shingal
12 Robert Schuman Centre for Advanced Studies Working Papers
The finding of limited effects of services AfT on merchandise trade in the quantile analysis suggests limited complementarities between goods and services. This could be for several reasons. Most AfT recipients in our analysis already have an established ‘trade footprint’ in merchandise but are much more recent services traders. Their services trade is thus also at a much lower base relative to their merchandise trade, which makes any marginal effect of AfT more observable. Moreover, barriers to their services trade are much larger than those to their merchandise trade (Jafari and Tarr, 2017; WTO, 2019), which again makes the marginal impact of AfT on their services trade larger than that for their merchandise trade. This is suggestive of AfT allocated to services activities being well-targeted and the salience of the sector definitions used by the OECD Secretariat. Finally, the effects of services AfT on merchandise trade may be less pronounced than expected insofar as servicification of manufacturing is more likely to be observed in services value-added data than in the gross services trade data analyzed in this study.
From a methodological perspective, our analysis reveals the need to consider the possibility that endogeneity can affect the AfT-trade relationship not just through the AfT variables but also via the non-AfT controls. A more complete treatment of this endogeneity is important for identification of treatment effects. Finally, given the potential time lags involved in the impacts of AfT disbursements, we conclude with a caveat. It may well be the case that the time period for empirical analysis in this paper is not long enough to observe effects of AfT and its sub-types on aggregate trade flows at the mean. Thus, fourteen years and three lags may not be sufficient to examine longer-term effects of AfT on trade at the aggregate level. Assessing such longer-term effects of AfT on trade remains an important agenda for future research.18
18
Ideally AfT-trade analysis requires a sufficiently long panel dataset on bilateral AfT by type/sector and disaggregated bilateral trade data for many countries. This does not exist for services trade. There has been slow progress in disaggregating services trade flows but bilateral services trade data for most developing countries remains weak, impeding the ability to assess the effect of AfT on trade in services because this must use data on total trade in relatively aggregate services products of AfT recipients with the world.
Aid for trade and trade in services
European University Institute 13
References
Bearce, D. H., Finkel, S. E., Pérez-Liñán, A. S., Rodríguez-Zepeda, J., and Surzhko-Harned, L. (2013). Has the New Aid for Trade Agenda been Export Effective? Evidence on the Impact of US AfT Allocations 1999-2008. International Studies Quarterly 57(1): 163-170.
Beverelli, C., S. Neumueller and R. Teh (2015). Export Diversification Effects of the WTO Trade Facilitation Agreement. World Development 76: 293-310.
Brenton, P. and E. von Uexkull (2009). Product Specific Technical Assistance for Exports - Has It Been Effective? Journal of International Trade & Economic Development 18(2), 235-254.
Busse, M., R. Hoekstra and J. Königer. (2012). The Impact of Aid for Trade Facilitation on the Costs of Trading. Kyklos 65(2): 143-63.
Cadot, O., A. Fernandes, J. Gourdon, A. Mattoo, and J. de Melo (2014). Evaluating Aid for Trade: A Survey of Recent Studies. The World Economy 37(4): 516-529.
Cali, M. and D. te Velde (2011). Does Aid for Trade Really Improve Trade Performance? World Development 39(5): 725-40.
Cameron, A.C. and P.K. Trivedi (2009). Microeconometrics using stata. College Station, TX: Stata Press, 2009.
Canay, I.A. (2011). A simple approach to quantile regression for panel data. The Econometrics Journal 14(3): 368-386.
Donaubauer, J., Meyer, B., & P. Nunnenkamp (2016). Aid, infrastructure, and FDI: Assessing the transmission channel with a new index of infrastructure. World Development 78, 230-245.
Ferro, E., Portugal-Perez, A., and Wilson, J. S. (2014). Aid to the services sector: does it affect manufacturing exports? The World Economy 37(4): 530-541.
Fiorini, M. and B. Hoekman. (2018). Services Trade Policy and Sustainable Development. World Development 112: 1-12.
Francois, J. and B. Hoekman. (2010). Services Trade and Policy. Journal of Economic Literature 48(3): 642-92.
Harms, P., and Lutz, M. (2006). Aid, governance and private foreign investment: some puzzling findings for the 1990s. The Economic Journal 116(513): 773-790.
Helble, M., C.L. Mann and J.S. Wilson (2012). Aid-for-trade facilitation. Review of World Economics 148(2): 357-376.
Heller, P. (1975). A Model of Public Fiscal Behavior in Developing Countries: Aid, Investment and Taxation. American Economic Review 65: 313-27.
Hoekman, B. and A, Shingal (2020). Aid for trade and international transactions in goods and services. Review of International Economics 28(2): 320-40.
Hühne, P., Meyer, B., and P. Nunnenkamp (2014). Who benefits from aid for trade? Comparing the effects on recipient versus donor exports. Journal of Development Studies 50(9): 1275-1288. Jafari, Y. and D. Tarr (2017). Estimates of Ad Valorem Equivalents of Barriers against Foreign
Suppliers of Services in Eleven Services Sectors and 103 Countries. The World Economy 40(3): 544-73.
Jepma, C. (1991). EC-wide Untying. International Foundation for Development Economics and Department of Economics, University of Groningen.
Bernard Hoekman and Anirudh Shingal
14 Robert Schuman Centre for Advanced Studies Working Papers
Königer, J., M. Busse and R. Hoekstra (2011). The Impact of Aid for Trade Facilitation on the Costs of Trading. Kyklos 65(2): 143-63.
Lee, H. H., and J. Ries (2016). Aid for Trade and Greenfield Investment. World Development 84, 206-218.
Martínez-Zarzosa, I., F. Nowak-Lehmann D., S. Klasen and M. Larch (2009). Does German development aid promote German exports? German Economic Review 10(3): 317-338.
Martínez-Zarzoso, I., Nowak-Lehmann, F., and K. Rehwald (2017). Is Aid for Trade Effective? A Panel Quantile Regression Approach. Review of Development Economics 21(4): 175-203.
Miroudot, S., and B. Shepherd (2016). Trade costs and global value chains in services. Research handbook on trade in services, 66.
Morrissey, O. (1991). An Evaluation of the Economic Effects of Aid and Trade Provision. Journal of Economic Studies 28: 104-29.
Njinkeu, D. and H. Cameron (2008). Aid for Trade and Development. Cambridge: Cambridge University Press.
Nowak-Lehmann, F., Martínez-Zarzoso, I., Herzer, D., Klasen, S., and Cardozo, A. (2013). Does foreign aid promote recipient exports to donor countries? Review of World Economics 149(3): 505-535. OECD and WTO (2017). Aid for Trade at a Glance 2017: Promoting Trade, Inclusiveness and
Connectivity for Sustainable Development, WTO, Geneva and OECD Publishing, Paris.
Persson, M. (2013). Trade facilitation and the extensive margin. Journal of International Trade & Economic Development 22(5): 658-93.
Pettersson, J. and L. Johansson (2013). Aid, Aid for Trade, and Bilateral Trade: An Empirical Study. Journal of International Trade & Economic Development 22(6), 866-894.
Portugal-Perez, A. and J. Wilson (2012). Export Performance and Trade Facilitation Reform: Hard and Soft Infrastructure. World Development 40(7): 1295-1307.
Powell, D. (2015). Quantile Regression with Nonadditive Fixed Effects. Working Papers RAND Corporation Publications Department.
Rodrik, D. 2016. Premature Deindustrialization. Journal of Economic Growth 21(1): 1-33.
Schettkat, R. and L. Yocarini. 2006. The Shift to Services Employment: A Review of the Literature. Structural Change and Economic Dynamics 17(2): 127-147.
Selaya, P. and E. R. Sunesen (2012). Does foreign aid increase foreign direct investment? World Development 40(11), 2155-2176.
Shingal, A. (2015). Identifying good practices in LDC/LIC services trade statistics collection. ILEAP, CUTS International and CARIS: Toronto and Brighton.
Skärvall, L. (2012). Does Swedish aid help or hinder bilateral trade: An empirical study on the effect of Official Development Assistance and Aid for Trade.
Suwa-Eisenmann and Verdier (2007). Aid and trade. Oxford Review of Economic Policy 23(3): 481-507.
Tajoli, L. (1999). The Impact of Tied Aid on Trade Flows between Donor and Recipient Countries. Journal of International Trade & Economic Development 8(4): 373-88.
Temple, J., and N. Van de Sijpe (2017). Foreign aid and domestic absorption. Journal of International Economics 108: 431–443.
Aid for trade and trade in services
European University Institute 15
Uberti, L.J., and D. Jackson (2019). Does Aid Promote Electoral Integrity? The Journal of Development Studies, DOI: 10.1080/00220388.2019.1657572.
Vijil, M. and L. Wagner (2012). Does Aid for Trade Enhance Export Performance? Investigating the Infrastructure Channel. The World Economy 35(7): 838-68.
Wagner, D. (2003). Aid and trade: An empirical study. Journal of the Japanese and International Economies 17(2): 153-173.
White, H. (1992). The Macroeconomic Impact of Development Aid: A Critical Survey. Journal of Development Studies 28: 163-240.
WTO (2019). World Trade Report 2019: The future of services trade. Geneva: WTO.
Young, A. (2014). Structural Transformation, the Mismeasurement of Productivity Growth, and the Cost Disease of Services. American Economic Review 104(11): 3635–3667.
Data citations:
Gaulier, G. and S. Zignago (2010). BACI: International Trade Database at the Product-Level. The 1994-2007 Version. CEPII Working Paper 2010-23, October 2010, CEPII.
Head, K., Mayer, T., and Ries, J. (2010). The erosion of colonial trade linkages after independence. Journal of International Economics 81(1):1-14.
Kaufmann, D., Kraay, A., and Mastruzzi, M. (2011). The worldwide governance indicators: methodology and analytical issues. Hague Journal on the Rule of Law 3(02): 220-246.
ODA/AfT database; OECD; 2002-2015; Query Wizard for International Development Statistics; https://stats.oecd.org/qwids/
OECD-WTO BaTiS; OECD-WTO Balanced Trade in Services Dataset; 1995-2012; https://www.wto.org/english/res_e/statis_e/trade_datasets_e.htm
Trade in Goods and Services database; UN Comtrade; 2002-2015; International Trade Statistics Database; https://comtrade.un.org/data
Trade in Services by Modes of Supply (TISMOS); WTO; 2005-2017; https://www.wto.org/english/res_e/statis_e/trade_datasets_e.htm#TISMOS
World Development Indicators, World Bank. https://databank.worldbank.org/source/world-development-indicators
Table 1: Summary of cross-country studies using aggregate trade data to examine the
effects of aid for trade
Paper Data,
coverage Methodology Treatment of endogeneity Diagnostic statistics reported Statistical significance of findings Remarks Cali & te Velde (2011, WD) Aggregate goods trade, 1995-2007 FE, IV, GMM AfT variables lagged up to 2 years; IV; GMM Only in Table 4 (IV); not in GMM (p-values not reported) Weak/no effects with IV; strong effects with GMM but diagnostic stats incomplete Non-AfT variables (barring population) not treated as endogenous Vijil & Wagner (2012, TWE) Aggregate goods trade, 2002-2008 OLS, IV IV Partially; p-values of F-tests in first and second stage estimations unreported No effects with infrastructure; weak effect with institutions in Table 3 Non-AfT variables (barring infrastructure and institutions) not treated as endogenous Ferro et al. (2014, TWE) Aggregate goods trade, 2002-2008 FE Using input-output linkages
Yes Strong Identification
strategy different from all other papers Hühne et al. (2014, RoWE) Aggregate goods trade, 1990-2010 FE, GMM
(not reported) AfT variables lagged up to 2 years; unreported GMM
GMM not
reported Strong with FE for both recipient exports and imports; much weaker for unreported GMM Non-AfT variables not treated as endogenous Martínez-Zarzoso et al. (2017, RDE) Aggregate goods & services trade, 2000-2011 OLS (annex), Quantile (main) AfT variables lagged up to 3 years; DOLS in quantile; none in OLS No Strong for goods exports, none for services exports in both quantile and OLS OLS results in Table A8 do not account for endogeneity Hoekman & Shingal (2019, RoIE) Aggregate goods & services trade, 2002-2015; Bilateral, 2002-2015 (goods) & 2002-2011 (services) OLS, IV (aggregate); PPML (bilateral) AfT variables lagged up to 3 years; IV (aggregate analysis); three-way fixed effects (bilateral analysis) Yes Weak IV effects in aggregate analysis; strong bilateral effects Non-AfT variables not treated as endogenous
(1) (2) (3) (4) (5) (6) (7) (8) (9) (10) (11) (12) (13) (14) (15) (16) (17) (18) ln(XS) ln(XG) ln(XS) ln(XG) ln(XS) ln(XG) ln(XS) ln(XG) ln(XS) ln(XG) ln(XS) ln(XG) ln(XS) ln(XG) ln(XS) ln(XG) ln(XS) ln(XG) ln(AfT_Serjt-1) 0.0351** -0.140*** 0.0796 -0.280*** 0.186*** -0.116*** 0.128*** -0.0579*** 0.0134** -0.0297*** 0.161*** -0.0423*** 0.0476*** -0.0370*** 0.102*** -0.0475*** -0.0391*** -0.128*** (0.0168) (0.0197) (0.105) (0.0727) (0.00299) (0.00288) (0.0136) (0.00424) (0.00683) (0.00377) (0.0234) (0.0117) (0.00586) (0.00414) (0.00551) (0.00548) (0.0141) (0.0127) NAfT_Serjt-1 1.884*** -1.929*** 1.607 -3.055* 3.250*** -1.320*** 2.378*** -0.352*** 0.870*** 0.368*** 2.536*** 0.164 1.191*** 0.0826 1.883*** 0.412*** -0.589** 0.427 (0.485) (0.494) (1.647) (1.587) (0.0431) (0.0486) (0.152) (0.0775) (0.0896) (0.118) (0.163) (0.209) (0.0798) (0.0678) (0.0820) (0.0838) (0.234) (0.292) ln(AfT_Non_Serjt-1) 0.00759 -0.178*** -0.0273 -0.352*** -0.258*** -0.125*** -0.235*** -0.186*** -0.186*** -0.165*** -0.230*** -0.165*** -0.125*** -0.179*** -0.171*** -0.0862*** 0.00963 -0.00569 (0.0886) (0.0196) (0.151) (0.0850) (0.00269) (0.00496) (0.0385) (0.00953) (0.00761) (0.00651) (0.0150) (0.0185) (0.00890) (0.00305) (0.00496) (0.0214) (0.00685) (0.0202) NAfT_Non_Serjt-1 -1.873 -3.678*** -0.914 -8.533*** -4.352*** -2.723*** -4.184*** -3.623*** -3.799*** -3.257*** -3.628*** -3.303*** -2.397*** -3.299*** -2.951*** -2.049*** 0.0977 -1.903*** (2.011) (0.484) (2.238) (1.686) (0.0362) (0.0795) (0.598) (0.149) (0.110) (0.117) (0.155) (0.303) (0.141) (0.0494) (0.0746) (0.323) (0.126) (0.240) ln(Popjt-3) 0.360*** 0.729*** 0.486*** 0.956*** 0.446*** 0.674*** 0.514*** 0.679*** 0.553*** 0.670*** 0.472*** 0.660*** 0.491*** 0.632*** 0.515*** 0.629*** 0.483*** 0.736*** (0.0116) (0.00871) (0.0725) (0.0469) (0.00371) (0.00606) (0.00504) (0.00289) (0.00501) (0.00730) (0.0223) (0.00779) (0.0102) (0.00168) (0.00229) (0.00405) (0.00595) (0.0115) ln(MPjt-3) 0.513* 0.471*** 0.384** 0.889*** 0.518*** 0.385*** 0.349*** 0.202*** 0.266*** 0.303*** 0.0639 0.224*** 0.501*** 0.286*** 0.360*** 0.0512* 0.407*** 0.308** (0.264) (0.0302) (0.169) (0.173) (0.0116) (0.00859) (0.0197) (0.0405) (0.0201) (0.0156) (0.139) (0.0253) (0.0198) (0.00896) (0.00693) (0.0311) (0.0217) (0.135) ln(CPIjt-3) 0.160 0.0233 0.188 -1.173*** 0.211*** -0.217*** 0.353*** -0.0513** 0.480*** -0.0266 0.143 0.162*** 0.440*** 0.162*** 0.377*** 0.338*** 0.0274 0.935*** (0.181) (0.0649) (0.181) (0.147) (0.0118) (0.0194) (0.0106) (0.0230) (0.00974) (0.0285) (0.140) (0.0137) (0.0239) (0.00792) (0.00891) (0.00583) (0.0347) (0.148) GEjt-3 1.646*** 0.731*** 1.573*** 0.934*** 1.128*** 0.561*** 1.221*** 0.487*** 1.126*** 0.410*** 1.058*** 0.473*** 1.051*** 0.419*** 1.047*** 0.457*** 1.049*** 0.628*** (0.184) (0.0229) (0.237) (0.0438) (0.00716) (0.00667) (0.00272) (0.0154) (0.00922) (0.0154) (0.0302) (0.0107) (0.0102) (0.00231) (0.00306) (0.00324) (0.0120) (0.0339) ln(FDIjt-3) 0.325*** 0.482*** 0.235** 0.356*** 0.302*** 0.487*** 0.259*** 0.475*** 0.249*** 0.466*** 0.323*** 0.449*** 0.236*** 0.442*** 0.226*** 0.448*** 0.238*** 0.266*** (0.0178) (0.00843) (0.104) (0.0568) (0.00121) (0.00266) (0.00582) (0.00701) (0.00416) (0.00552) (0.0314) (0.0142) (0.00847) (0.00150) (0.00245) (0.00296) (0.00446) (0.0171) TCjt-3 -0.00317*** -0.00143*** -0.00331*** -0.00615 -0.00111***-0.000282***-0.00167*** 0.000134 -0.00212*** 0.00204*** -0.00150*** 0.000858***-0.000281***-0.000121** 0.000874***-0.000255***0.000907*** -0.00217**
(0.000702) (0.000275) (0.000604) (0.00380) (2.45e-05) (6.19e-05) (0.000394) (0.000136) (0.000149) (0.000212) (0.000138) (0.000196) (3.92e-05) (5.23e-05) (1.99e-05) (4.42e-05) (7.52e-05) (0.000994) N 1,096 1,471 1,096 1,471 1,096 1,471 1,096 1,471 1,096 1,471 1,096 1,471 1,096 1,471 1,096 1,471 1,096 1,471 r2 0.8182 0.7920 0.8239 0.7284 0.8325 0.7832 0.8303 0.7779 0.8235 0.7766 0.8262 0.7810 0.8312 0.7777 0.8274 0.7719 0.8259 0.7513 Note: The quantile regressions have been estimated in STATA using the Qregpd estimator developed by Powell (2015). Optimization technique used was adaptive MCMC. All variables were instrumented using their neighbourhood averages. All estimations include year and recipient fixed effects. Robust standard errors are included in parentheses. Levels of significance: *10%, **5%, ***1%.
Table 2: Impact of AfT in services versus non-services on exports (quantile results)
Quantile=0.6 Quantile=0.7 Quantile=0.8 Quantile=0.9