Series VII: Social Sciences • Law • Vol. 8 (57) No. 2 - 2015
ECONOMIC POLICIES FOR FEMALE
LABOUR AND FOOD NUTRITION
SECURITY: THE AL-GHAB REGION CASE
M. CIASCHINI
1V. CISTULLI
2S. MARTA
2R. PRETAROLI
3F. SEVERINI
3C. SOCCI
4F. TIMPANO
5Abstract: The Al-Ghab region in Syria is considered the typical resource
rich poor area in a developing country. The possibility of activating economic growth goes through diversification in output, in order to stimulate the value added generation, and reduction of social and economic disparities between female and male labour employment. In this way also the problem of food insecurity is effectively addressed given its strong connection with the poverty level of households. The most suitable tool of analysis for addressing this complex target is provided by an extended multi-sector model developed on the basis of the SAM for the area of interest. In this paper, we develop a SAM for the Al-Ghab region and quantify the effects of selected policy scenarios in terms of economic diversification, female labour efficiency and food nutrition security for the Al-Ghab region. This is done in order to identify the pillars of economic growth of the area.
Key words:
Food and Agriculture; fiscal policy; Multisectoral extendedmodel; SAM.
1 Department of Economics and Law, University of Macerata, Italy.
2 FAO.
3 Department of Economics and Law, University of Macerata, Italy.
4Corresponding author: [email protected], Department of Economics and Law, via Crescimbeni 14,
62100 Macerata – ITALY, phone number +3907332583263.
5 University of Sacred Hearth in Piacenza.
1. Introduction
Poverty, social disparities, Food and Nutrition Security (FNS) are multidimensional socio-economic development issues resulting from a set of
negative conditions that prevent economic growth. Especially during economic downturns, it becomes unavoidable for the policy maker to deal with low incomes, inequalities in access to productive assets,
unemployment, low health education and nutrition status, natural resource degradation, vulnerability to risk and weak political commitment [21].
Socio-economic and policy dynamics of geographic areas at the sub-national level are determinant in driving economic growth and downturn and in many cases strongly differ from each other since characterised by several physical, human, institutional and cultural resources. These
resources jointly constitute the development potential or “territorial capital” ([5], [6]) in each region or sub-region and should be attentively considered in designing economic policy measures.
Given these premises, a territorial (“place-based”) approach [1], [2] would be highly beneficial to the increase of the effectiveness of policies and strategies that address hunger and food insecurity as well as the increasing disparities between geographic areas. Indeed, the policy maker should combine the potential of each region with policy measures able to activate the process of income generation in order to drive the economic system growth [3]. In doing this, it is important to focus both on economic and social aspects of the economic system that might simultaneously interact in achieving the socio-economic objective [14].
In particular, in developing countries, where poverty and food and nutrition security (FNS) are complex from the multi-sector, multi-level and multi-actor viewpoints, the multi-sector analysis is undoubtedly a powerful methodology able to analyse the combined effects of policy measures, formulate and implement effective responses to the problem of food insecurity and social disparity. This latter, is a topic of prominent interest if we consider the social structure of developing countries and, as an example, the role of women in the process of income generation and distribution. Actually, the female contribution to the growth of a country is an important element still to be considered especially in developed countries where female labour force constitutes a huge resource.
All these aspects can be taken into consideration simultaneously when studying the economic system by means of the Social Accounting Matrix (SAM) and multi-sector analysis approach.
The SAM represents a powerful instrument to assess the “area-specific” determinants of social disparities and food and nutrition insecurity. Indeed, it allows the analysts to take into consideration the combined effects (tangible and intangible; formal and informal) of the policy maker action on the main macroeconomic variables within a given geographic area and across areas. It therefore provides policy makers with comprehensive territorial information to target food security policies and improve the allocation of resources. It allows a balanced design of short term and ad hoc assistance-led policies, to achieve social cohesion and equity, with longer term and efficiency-based policies, promoting endogenous development and strengthening the capacity of local institutions to make the best use of local assets [8].
In this paper, we propose an application of this approach to the Al-Ghab Region in Syria that is paradoxically considered a resource rich poor area. Indeed, although it encompasses a huge reservoir of agricultural resources, the level of development, social equality and Food and Nutrition Security is not proportionate to its potential. The region’s natural resource-based comparative advantages are yet to be converted into potential and sustainable sources of livelihood and wealth creation, and into enhanced competitiveness through value addition. Resource-based opportunities are plenty, but opportunities are not guarantees to the factors that foster economically efficient, ecologically friendly and socially desirable pattern of development.
The aim of this study is to analyse the social-economic structure of the Al-Ghab region by means of the SAM for Al-Ghab (year 2010) and develop the multi-sector extended model ([8], [10]) to identify the key productions for this area and thus to select the proper region-oriented policy.
developed to quantify the effects some selected polices in terms of some development indicators: Economic diversification (HHI), Female Labour Market efficiency (FLME), Food Nutrition Diversification (FND) and Food Availability (FA).
Diversification is considered a developing force because of the ability of a given sector to generate more value added, as agriculture that is typically the dominant sector in under developed countries. For Al-Ghab region, it seems that any development model for the region will hardly succeed if agriculture is not placed at the centre as the engine of growth. However, for a reformed agricultural sector to trigger the overall development of the region, other related sectors, at present poorly developed, need to help the modernization process of agriculture and the achievement of sustainable FNS.
According to a recent analysis that surveyed 5000 out of 51123 households in the Al-Ghab region [11], the 12.4% of the total population is considered as food insecure or borderline and strongly conditioned also by the gender factor. Indeed, 12% of men-headed households is food insecure vs 20% of women-headed households. Moreover, poor food security individuals are more prevalent in households whose heads have no education. During 2010, 19.8% of Al-Ghab population experienced food shortages and 16.3% are expecting to suffer from food shortage in the following year [11]. The critical situation of the area presses for finding out possible reasons grounded on territorial and social features.
In the next section some peculiar aspects of the Al-Ghab region will be described together with the procedure followed to build the SAM database for the region. The third section describes the extended multi-sector model used to develop the analysis, the fourth section discusses the
characteristics and the results of a set of policy scenarios aimed to stimulate diversification, labour efficiency and FNS in the area. The sixth session provides some conclusions.
2. The Social Accounting Matrix for the Syrian economy and the AL-Ghab Region
The SAM can be seen as a complete, flexible and disaggregated framework able to describe the income circular flow for the whole economy [8], [9]. Final demands determine total outputs and value added by commodity; the latter generates domestic incomes by factors which make up disposable income by institutional sectors; and these give rise to final demands closing the loop. The main feature of the SAM, given its matrix character, is the possibility of extending its accounting nucleus following the aims and borders of the actual research [26], [27]. Indeed, it can be extended to include a greater set of economic and social phenomena at a substantial level of detail. This means that a more articulated income circular flow can be described. Starting from input-output tables, the SAM can be derived by integrating those flows with disaggregated accounts for value added formation, primary and secondary income distribution (rows/columns for Primary Factors, Institutional Sectors and capital formation).
The need of measuring, assessing and monitoring the territorial assets that determine diversification, social disparities and FNS, calls for a SAM that integrates these territorial tangible and intangible assets with the socio-economic flows among Institutional Sectors. We can determine in this way the effectiveness of policies and strategies aimed to address food insecurity, social disparities and economic growth.
Since the “area of interest” is represented by the Al-Ghab region in Syria, the development of the SAM will follow three main steps. First, we rearrange the official national accounts provided by the Syrian National Bureau of Statistics for the year 2010 in order to obtain the National Accounting Matrix (NAM) for Syria as a general reference framework (paragraph 2.1). Then we derive the Social Accounting Matrix (SAM) for the Syrian economy for year 2010 at a level of disaggregation consistent with the main objectives of the research (paragraph 2.2). Finally, we provide the regionalisation of the matrix in order to analyse the problem of
food security in the region (paragraph 2.3).
2.1. The National Accounting Matrix for Syrian Economy
The description of the socio-economic flows within the Syrian economy requires the integration of the National Accounts and alternative sources of information with the economic theory. The National Accounts published by the Central Bureau of Statistics in 2011 [6] have been used to derive the Syrian National Accounting Matrix (NAM) for 2010 as a reference framework for the construction of the SAM.
“Macro” National Accounting Matrix Table 1
Com-modities Industries Primary Factors Institutional Sectors Formation Capital Rest of World
n. 1 2 3 4 5 6 Commodities 1 - B Ch + G Ij + Vs E Industries 2 X Primary Factors 3 Va Tr Institutional Sectors 4 IT GDP T + Tr Tr
Capital Formation 5 S (-)A
Rest of the World 6 M Tr Tr
The NAM can be extended following the detail of the national accounts and its aggregate structure (see Table 1) includes: Commodities, Industries, Primary Factors, Institutional Sectors, Capital formation and Rest of the world.
The first column, headed to Commodities, registers total supply of goods and services deriving from the sum of domestic supply (X) and imports (M). The first row represents total demand for goods and services and it is composed of intermediate consumptions (B), final consumptions by Institutional Sectors (Ch
+ G), Investments net of changes in
inventories (Ij + Vs) and exports (E). The
second column describes total output generation as the sum of intermediate consumption (B), Value added (Va) and indirect taxes (IT): it must be equal to the total of the second raw. The third column registers the primary income distribution as the attribution to the Institutional Sectors and the Rest of the World of the primary factors compensation (GDP and Tr). The fourth column describes the total
institutional sectors expenditure for final consumptions (Ch + G), transfers to other
institutional sectors (T + Tr ) and savings
Table 2
“Macro” National Accounting Matrix for Syrian Economy for 2010 – millions SP
Com-modities Industries Primary Factors Institutional Sectors FormationCapital Rest of World
N 1 2 3 4 5 6 Total rows Commodities 1 - 2.086.487 2.037.534 745.074 911.773 5.780.868 Industries 2 4.836.814 4.836.814 Primary Factors 3 41.448 2.661.975 9.294 2.712.717 Institutional Sectors 4 2.771.034 357.271 62.253 3.130.558 Capital Formation 5 88.352 629.220 182.966 900.568 Rest of the World 6 902.606 1.683 106.533 155.494 1.166.316 Total column 5.780.868 4.836.814 2.712.717 3.130.558 900.568 1.166.316
The last column and row refers to the balance of payments and describe the flows of goods and services (M and E) and income transfers (Tr) from and to the rest
of the world. Given this simple aggregate structure, we derive the NAM for Syria for 2010 rearranging and integrating the National Accounts published by the Central Bureau of Statistics for 2010 with information provided by IMF on international commerce. The final NAM is described in table 2.
2.2. From the NAM to the SAM for Syrian Economy
The Nam described in table 2 is the base framework to derive the SAM for Syrian economy: it is consistent with the official national accounts and represents a general reference for the main macroeconomic aggregates. The disaggregation of commodities, industries, primary factors and institutional sectors according to socio-economic criteria is fundamental in order to obtain the SAM [29], thus the full detailed income circular flow. Since the main drivers for FNS seem to be represented by sectoral diversification, education, labour market efficiency and
poverty [20], the disaggregation of the NAM accounts must be carried out in order to emphasise these important elements. Therefore, the final SAM for Syria6 will include a set of rows and
columns highlighting sectoral diversification, education, labour market efficiency and poverty. To be more specific, it includes accounts for: 40 commodities7; 40 industries8; 3 primary factors; 4 Institutional Sectors; Rest of the world; Capital formation.
The structure of the SAM derived in this paper can be identified by quadrants that describe the main phases of the income circular flow [30].
i. Quadrant of intermediate consumption: shows intermediate consumption, by commodity in rows and by industries in columns. We distinguish 40 commodities and 40 industries (see Table A.1 in the appendix), 22 of which are connected to agriculture/food production. The remaining 18 commodities refer to manufacturing,
6 See [32] for the full SAM. 7 See table A.1 in the appendix.
8 The disaggregation of industries corresponds to the disaggregation of the commodities.
building and construction, trade, transport and communication, Finance and insurance, social and personal services and government services. This
detail provided for the non-agricultural commodities aims to demonstrate the importance of non-food commodities, as well as sectoral diversification, to promote policies for FNS improvement.
Moreover, the commodity “government services” was disaggregated into “education” and “government services” in order to emphasize the role of education within the economic system, especially as an indicator of human development. The aggregate value of intermediate consumptions in the NAM was disaggregated to obtain the inputs of commodity by industry and thus the first quadrant of the SAM for 2010. ii. Quadrant of total output by industry:
shows industry supplies or “makes” i.e. which set of commodities is produced by each industry [35]. The aggregate value of the output/supply in the NAM was disaggregated to obtain a square matrix. This matrix is almost diagonal since each industry produces almost only one commodity which by definition is its principal output. However, it is possible to observe, even if minor, many side productions for some industries given by the non-diagonal elements of the matrix.
iii. Quadrant of generation of income or
value added: shows the activities in
which primary incomes originate, as distinct from the institutional sectors designed to receive such incomes, identified in primary income allocation. Primary incomes, or the value added of the economy, can be considered as the incomes paid to the primary factors for their involvement in processes of production. In this study we identify tree main components of value added: “Male labour”, “Female labour”,
“Other incomes” aside from “Indirect Net Taxes” and “Fixed Capital Consumption”. We decided to provide a disaggregation of the Labour employed by gender since gender represents a determining element of labour efficiency.
iv. Quadrant of primary income: the allocation of primary income account focuses on resident institutional sectors in their capacity as recipients of primary incomes. The allocation of primary income account shows where the items payable in the generation of income account are receivable and includes the amounts of property incomes receivable and payable by institutional sectors [35]. We provide a disaggregation of institutional sector in “low income Households”, “high income Households”, “Firms” and “Government”. The discrimination of Households in low income and high income is carried out taking into account the poverty line of 2US$ (ppp) per person per day that is estimated at 72.39 SL ppp day, i.e. 26420.6 SL ppp year [33]. The aim is to identify within the income circular flow the weight of poverty and the key policy that in a multi-sector approach are able to defeat it. Both low income and high income Households receive the compensation of Female and Male labour and other income or mixed income. Firms collect the other incomes and property incomes receivable from the ownership of financial assets and natural resources. The Government receive indirect taxes revenue and other incomes.
v. Quadrant of secondary distribution of
income: shows how the balance of
primary incomes of an institutional sector is transformed into its disposable income by the receipt and payment of current transfers. According to the SNA system, three main kinds of current
transfers are distinguished in the secondary distribution of income account: current taxes on income, wealth, etc.; social contributions and benefits; other current transfers. For each of these typologies of transfer we derive a sub-matrix whose rows are headed to the institutional sectors paying the transfers and columns headed to those institutional sectors receiving payments. As for the first typology of current transfer, “current taxes on income, wealth etc”, the rows are headed to low income Households, high income Households and Firms who pays the taxes and the single column is headed to Government who collects the tax revenue. The “Social contributions and benefits” are current transfers received by households intended to provide for the needs that arise from certain events or circumstances, for example, sickness, unemployment, retirement, housing, education or family circumstances. Social benefits may be provided under social insurance schemes or by social assistance. Therefore, the sub-matrix describing these flows has two rows headed to low income Households, high income Households and two columns headed to Firms and Government that are in charge of paying these transfers. As for the other transfers these may occur indifferently between high income and low income households or between Government and Firms. The aggregate value of transfers among Institutional Sectors in the NAM (table 2) has been disaggregated according to the structure of these matrices derived from the data on “Family Income and expenditure survey” published by Syrian Central Bureau of Statistics [6] and the report of United Nation Development Program on Poverty in Syria [12].
vi. Quadrant of the use of income: the income circular flow closes with the determination disposable income by institutional sectors. The related quadrant of the SAM shows how institutional sectors allocate their disposable income between final consumption and saving. The disposable income is the balancing item carried forward from the secondary distribution of income account. The aggregate final consumption showed in the NAM has been disaggregated according to the structure of final consumption of low income and high income Households9 and Government.
The difference between disposable income and final consumption constitutes institutional sectors’ savings.
vii. Quadrant of capital formation: includes the gross fixed capital formation, changes in inventories and net lending/borrowing. It is calculated as a balancing item in order to assure the SAM correspondence between total of rows and total of columns.
viii. Quadrant of the Rest of the World: the SAM for Syria closes with a column and a row headed to the Rest of the World corresponding to the balance of payment accounts. In particular, the column registers the exports of goods and services and the Syrian current transfers debit to the Rest of the World. The row includes the imports of goods and services and the Syrian current transfers’ credit.
2.3. Regionalisation of the SAM for the Al-Ghab Region
The Al-Ghab region is situated in the
9 The shares are calculated from “Family Income and expenditure survey” published by Syrian Central Bureau of Statistics [6] and the report of United Nation Development Program on Poverty in Syria (2005) [12].
Hama Governorate (Syria). Official data on total production, value added generation and final demand for this area are not available. As a result, the regionalisation of the national SAM for the Al-Ghab region can be carried out only using other sources of information, not provided by official institution. However, several useful information are collectable from the survey “The State of Socio Economic Condition of Al-Ghab”, [13]. This study describes the poverty conditions of households in Al-Gahb and provide a survey on households final consumption.
Using these data, it is possible to operate a regionalisation of the national SAM for Al-Ghab assuming that the total production of this area has the same structure as the households final consumption. To be more specific, we use the structure of the national SAM as a reference for the construction of an extended multisectoral model. This model is used to derive the matrix of flows for Al-Ghab through the reconstruction of the structure of commodity output in the region. This vector allows to derive the Make and Use tables and consequently all the blocks of the income circular flow in Al-Ghab.
3. The extended multi-sector model
The SAM for Al-Ghab represents the extended multi-industry, multi-factor and multi-sector model [9], [10]. It is an extension of the Miyazawa approach [17] through the integration of the previous model with secondary income distribution [25] to be able to quantify the policies modelled on each target variable (Commodities output, Primary Factors Income and Institutional Sectors demand) in every phases of the Income Circular Flow. We assume fixed prices and constant coefficients and shares.
Following the above mentioned structure of the SAM we can describe the model
starting from the production process, that takes place at industry level, and generates total output, x, and gross value added by the I-O industries, v(x) that is allocated to the c value added components (factors),
vc(x). Value added by components is
distributed to the h institutional sectors,
vsi(x). The disposable income by s sectors
y(x) results after the redistribution of
income among institutional sectors through. Finally, disposable income will generate final demand by sectors, which will be transformed into final demand by I-O industries.
Given this extended output-income loop, it is possible to study the propagation effects of a policy measure in the economic system. Indeed, after choosing the flow variable to change, we can observe the effects of the shock on a selected variable that we consider as objective. The direct, indirect and income induced changes in the policy objective, such as the total output ∆x, generated by change in the policy control, that is represented by the final demand, ∆f, the policy control, will be calculated as follow [8]:
∆
x
= ⋅
R
∆
f
(1) with 1 [ ( m) ( m) ( ) ]− = − − − − ⋅ + ⋅ ⋅ ⋅ R I A A F F I T P V L (2)where A is intermediate coefficients domestic matrix; Am is the intermediate
coefficients imports matrix; L is a diagonal matrix whose elements give the constant residual shares of value added by industry. V is the structural matrix of value added components; P is a matrix of constant shares of value added by factor attributed to the institutional sectors; T represents a matrix of the net income transfers shares among institutional sectors. F and Fm are
matrices (domestic and import) of the constant shares for final demand formation with: F=F0+K, where F0= F1C. F1
represents the consumption demand of the commodity produced by each industry and C is a diagonal matrix of the consumption propensities by institutional sector that transforms the consumption expenditure by institutional sectors into consumption by industries. K matrix is the investment demand given by K=K1s(I-C), where K1
matrix is the investment demands to I-O industry by institutional sectors, s is a scalar for the share of private savings which is transformed into investment i.e. “active savings”.
From R matrix, we get a set of disaggregated multipliers able to show how the different impact on output depends on which industry has undergone a shock in final demand. Indeed the ith total output multiplier measures the sum of direct and indirect input requirements needed to satisfy a unit final demand for goods produced by industry i [4]. Rasmussen define these multipliers as "summary measures for the inverse matrix". He noted that the sum of column elements corresponds to the total increase in output from the whole system of industries needed to match an increase in the final demand for the product of industry j by one unit, called backward dispersion index. Similarly, the sum of row elements gives the increase in output of industry i required to meet a unit increase in final demand for the product of each industry.
Taking the average we obtain an estimate of the (direct and indirect) increase in output to be supplied by an industry randomly chosen, when final demand for the products of industry j increases by one unit [28]. Similarly, we can calculate a forward dispersion index as the average increase in output to be supplied by industry i if the final demand for the products of an industry chosen at random is increased by one unit.
4. Policies implication for the Al-Ghab region thought SAM and extended multi-sector model
The Al-Ghab Region is considered a strategic area within Syria for its morphological characteristic and economic activities. For these reasons it requires a special attention when implementing political economic measures. The use of the Social Accounting Matrix (SAM) and the multi-sector model allows to operate with a high level of detail and flexibility.
In this phase we developed several simulation exercises to better understand the reaction of the Al-Ghab region to policy measures aimed at reducing food insecurity, stimulate female labour efficiency and poverty. After implementing a dispersion analysis, that allows calculating the sensitivity and the power indexes, we simulate 6 different policy measures:
1. Change in low income Households final consumption composition: increase in food commodities final demand compensated by a decrease in non-food commodities final demand by low income Households;
2. Reduction in income tax on low income Households (-1,042 millions of SP) financed by an increase in income tax on high income Households (+1,042 millions of SP);
3. a) Increase in food processing commodities final demand (+1,042 millions of SP) balanced by a decrease in all the other commodities final demand (-1,042 millions of SP);
b) Increase in food processing commodities final demand (+1,042 millions of SP), not balanced;
4. Policy to promote economic diversification: we increased indirect taxes on agricultural goods (from 1 to 21) and reduced indirect taxes on the other commodities;
5. Policy focused on education:
a) increase in the final demand of all commodities (+1,042 millions of SP) and measure the effects on education total output;
b) increase in the final demand of education (+1,042 millions of SP) and measure the effects on total output; 6. Policy for female labour: a higher use
of female labour is compensated with the reduction of indirect taxes.
Dispersion analysis: sensitivity and power indexes.
The evaluation of policies effects on Al-Ghab economy requires a preliminary dispersion analysis in order to identify the key productions for this area and thus to select the proper region-oriented policy.
The figure 1 illustrates the values of the “sensitivity of dispersion” index [27]. This index can be assimilated in conceptual terms to the forward linkage and highlights the importance of each production to the final demand formation.
The forward dispersion index [FD], measures the degree to which one industry output is used by other industries as an input. The significant threshold is equal to one meaning that when FD has a value greater than 1, for a unitary increase in final demand, the industry we are observing will have to increase its output more than other industries. This index therefore expresses the extent to which the
system of industries relies on each singular industry and the degree to which each singular industry is affected by an expansion in the system of industries [10].
In AlGhab economy, given a unitary increase in all commodities final demand, we observe that non-food commodities receive the greater stimulus. That means that non-food commodities are affected by an expansion in the system of industries more than the other commodities.
Differently the figure 2 shows the value of the “power of dispersion” index [28] a version of backward index. The aim of this index is to measure the potential stimulus to other industries from a demand shock in any industry. The significant threshold is one, meaning that when BD has a value greater than 1, an industry will need a comparatively large production increase to meet a unit increase in final demand for the products of the observed industry. When the index is less than one, the observed industry relies heavily on the system of industries and vice versa. Therefore, this index describes the relative extent to which an increase in final demand for the products of a singular industry is dispersed throughout the system of industries [9]. For the AlGhab economy, the BD index is greater than one for commodities form 14 to 33 that includes some food commodities (Eggs, Fisheries, Honey, Food beverages and tobacco) and manufactures. Services are all below the significant threshold.
0,00 1,00 2,00 3,00 4,00 5,00 Cerea ls Indu st ri al c rops Frui ts Ve ge table s le gu m es Pas toral s Ru ra l i n d u st ri es Seed Plants G innin g o f c o tto n O the r p lan t pr oducts M
ilk & Its de
ri vative s Live sto ck Eggs Woo l A n im al hair Ski n Fi sheri es Silk co co o n s Ho n ey Ho ne y w ax Food be ve ra ge s and t o bacco Te xtile s, c lo thing & le athe r Wood and fur n itur e Pape r, print
ing & publis
h ing em ical industr ie s, th ei r pr oductions and pe tr ole u m No n-m etallic Ba si c m et al Me tal pr oducts M isce llane o u s Ex tr ac ti ve In d u str ie s Ele ct ricity and w ate r B u ilding & c o ns tr uctio n Wh ol es al e & r et ai l t ra d e Tr anspor t &c o m m unicatio n Finance & ins u ra nce Social & pe rs o n al s er vi ce s G o ve rn m en t s ervic es Educatio n Pr ivat e non-p rofit s er vi ce s Forward Dispersion Coefficient change
Fig. 1. Forward dispersion index for the Al-Ghab Region
Change in low income Households final consumption composition
The first policy focuses on the low income Households final demand. To be more specific it simulates a change in low income Households final consumption composition. We increase the final demand of food commodities10 by 10% and reduce the final demand of non-food commodities11 by the same amount in
10 Food Commodities: 1.Cereals, 2.Industrial crops, 3.Fruits, 4.Vegetables, 5.Legumes, 6.Pastorals, 8.Seed, 9.Plants, 11.Other plant products, 12.Milk and its derivatives, 13.Livestock, 14.Eggs, 18.Fisheries, 20.Honey, 21.Honey wax, 22.Food beverages and tobacco. 11 Non-Food Commodities: 23.Textiles, clothing
& leather, 24.Wood and furniture, 25.Paper, printing and publishing, 26.Chemical industries, their productions and petroleum refinement, 27.Non-metallic, 28.Basic metal, 29.Metal products, 30.Miscellaneous, 31.Extractive Industries, 32.Electricity and water, 33.Building and construction, 34.Wholesale and retail trade, 35.Transport and communication, 36.Finance and insurance, 37.Social and personal services,
order to not affect the total final demand. The overall effect on total output is positive (+19,7 millions of SP) given that an increase in food commodities final demand stimulate the production of food commodities but also non-food commodities such as “Building and construction”, “Government services” and “Education”.
Reduction in income tax on low income Households
In the second policy, we evaluate the effects on the economic system of a redistribution of the tax burden within the Households’ Institutional Sectors.
38.Government services, 39.Education, 40.Private non-profit services.
0,00 1,00 2,00 Cer ea ls In d u st ria l c ro p s Fr u it s Veget ab les le gu m es Pa st or al s R u ra l i ndus tr ie s See d Pl an ts G inni n g of cot ton O the r pl ant pr oduc ts M ilk & It s d er iva ti ve s Li ve st oc k Eg gs W ool An im al h ai r Sk in Fi sh er ie s Si lk co co o n s Hon ey Ho n e y w ax Food be ve ra ge s and t o bac co Te xt iles, cl ot hi ng & le at her W ood and f u rn it ur e Pa pe r, pr in ti ng & publ is hi ng em ica l i ndus tr ie s, th ei r pr oduc ti ons and pe tr ol eu m N o n -m e ta lli c Ba si c m et al M et al pr oduc ts Mi sc e lla n e o u s Ex tr ac ti ve Indus tr ie s E le ct ric it y a n d w at e r B u ild in g & c o ns tr uc ti on W h ol es al e & r et ai l t ra d e Tr ans p or t & com m uni ca ti on Fi nanc e & in sur ance So ci al & p ers o n al s e rv ic es G o ve rn m e n t s e rv ic e s E duca ti o n P ri vat e non-pr of it ser vi ces Backward Dispertion Coefficient change
Fig. 2. Backward dispersion index for the Al-Ghab Region
-500,00 -400,00 -300,00 -200,00 -100,00 0,00 100,00 200,00 300,00 400,00 Ce re al s In du st ria l c ro ps Fr ui ts Ve ge ta bl es le gu m es Pa st or al s R ur al indus tr ie s Seed Pl an ts Gi n ni ng of c ot ton O the r pl an t pr od uc ts M ilk & I ts d er iva ti ve s Li ve st o ck E ggs W ool A nim al h air Sk in Fi sh e ri es Silk c oc o on s Hon ey Ho ne y w ax Food be ve ra ge s a nd t oba cc o Te xt ile s, c lo th in g & le at he r W ood a nd f ur ni tur e Pa p er , pr in ti n g & publ is h ing C he m ic al in dus tr ie s, th ei r pr oduc ti ons a nd pe tr ol eu m N on -m et allic Ba si c m e ta l Me ta l p rod u ct s M is ce lla ne ou s Ex tr ac ti ve Indus tr ie s El ec tr ic it y a nd w at er B uild in g & c on st ru ct io n W ho lesa le & r et ai l tr a de Tr an sp or t &c om m uni ca ti on Fi na nc e & in su ra nc e So ci al & p ers on al s erv ic es G ov ern m en t s erv ic es Educ a ti on Pr iv at e non-pr of it s er vi ce s
final demand change output change
Fig.3. Change in low income Households final consumption composition In particular, we simulate a reduction in
income tax (increase in transfers) on low income Households of 1,042 millions of SP financed by an increase in income tax (or reduction of transfers) on high income Households by the same amount. The red
bars in figure 4 show this tax burden reallocation.
The impact of this policy is measured in terms of absolute changes in disposable income (blue bar in figure 4) and absolute changes in total output (see figure 5).
-1500 -1000 -500 0 500 1000 1500 Low Income Households Hi gh Income Househol ds
Fi rms Government Rest of World
Shock on Households' Income
Impacts on Institutuional Sectors' Income
Fig. 4. Redistribution of the tax burden within the Households’ Institutional Sectors:
income effects
This policy generates some problems in terms of income distribution. Indeed, High income Households disposable income decreases as expected by the policy, but also Low income Households disposable income registers a slight unexpected reduction. Even if the policy is designed to create an advantage for Low income Households, the result is depressing.
Consequently, the effect on total output, as shown in figure 5, is since the final demand of both Households decreases. These results suggest that raising taxes on High income Households generates an effect on total output much stronger than reducing them on Low Income Households. These latter probably have minor connections with the economic system and even if they directly receive a stimulus, they do not transmit it into the economy.
Policy for food processing commodities
The third simulation aims to evaluate the effects of a policy that affects the food sector that is disaggregated into its components. In particular, in the third
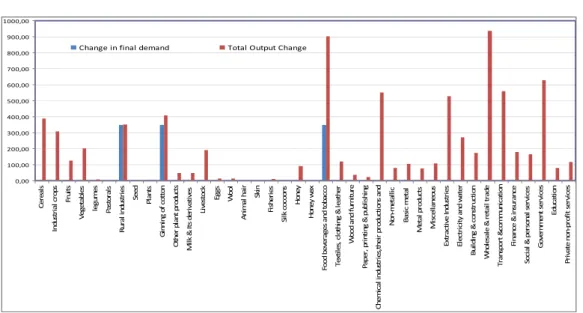
policy we increase the food processing commodities12 final demand of 1,042 millions of SP and suggest two alternative scenarios: in the first the increase in final demand is balanced by a decrease in all the other commodities final demand by the same amount, in the second we do not provide any compensation. The results are shown in figure 6a and 6b: the blue bars represent the exogenous shocks occurred in final demands and the red bars the changes in total output by each commodity.
When the policy is balanced (first scenario and figure 6.a), we observe an increase in total output only for those commodities whose final demand has increased (food processing commodities). A further positive change is registered only in “Cereal” and “Industrial crops” but the overall effect on total output is negative. On the contrary, when the policy is made without reducing the final demand of non-food processing commodities (second
12
Food processing commodities: 7. Rural industries, 10. Ginning of cotton, 22. Food beverages and tobacco.
scenario and figure 6.b), the overall effect on total output is positive. To be more specific, the policy stimulate the production of some food commodities (in particular “Cereals”, “Industrial crops”, “Legumes”, “Fruits”, “Vegetables” and “Livestock”), all manufacturer production and services: the best effect is performed by “Wholesale and retail trade”.
The results on total output are greater in non-food commodities most likely as a consequence of the fact that food processing commodities are mostly imported and their activation contributes to increase imports, not national production (this conclusion should be better investigated).
Change in total output
-3000,0 -2500,0 -2000,0 -1500,0 -1000,0 -500,0 0,0 Cere als Indu stria l crop s Fruits Veget ables legu mes Pasto rals Rura l indu stries SeedPlan ts Ginn ing of cotton Other plant produ cts Milk & Its d eriva tives Lives tockEggsWool Anim al hai r Skin Fishe ries Silk co coon s Hone y Hone y wax Food bev erag es and toba cco Text iles, c loth ing & leath er Wood and furn iture Paper , prin ting & publ ishin g Chem ical in dustr ies,t heir pr oduct ions a nd p etrole um re finem ent Non -met allic Basic met al Meta l prod ucts Misc ellan eous Extra ctive Indu stries Elec tricity and water Build ing & const ruct ion Whol esale & reta il tra de Trans port &co mmu nicat ion Financ e & in sura nce Socia l & pe rson al serv ices Gove rnment serv ices Educ ation
Fig. 5. Redistribution of the tax burden within the Households’ Institutional Sectors:
output effects -200,00 -100,00 0,00 100,00 200,00 300,00 400,00 Ce re al s Indus tr ia l c rops Fruits Ve ge ta bl es le gu m es Pa st or al s R ur al indus tr ie s Seed Plants G inni ng of c ot to n Ot he r pl a nt pr oduc ts M ilk & It s d er iva ti ve s Li ve st oc k E ggs Wool A nim al h air Skin Fi sh er ie s Si lk co co on s Ho ne y Ho n ey w ax Food be ve ra ge s a nd to ba cc o Te xt ile s, c lot hi ng & le at he r W ood a nd f ur ni tu re Pa pe r, pr in ti ng & publ is hi ng C he m ic al indus tr ie s, th ei r pr oduc ti ons a nd N on -m et all ic Ba si c m et al M et al pr oduc ts M is ce lla ne ou s E xt ra ct iv e I ndus tr ie s El e ct ric it y a nd w at er B u ildi ng & c ons tr uc ti on W ho le sa le & r et ail t ra de Tr a ns por t & com m un ic at io n Fi n anc e & in su ra nc e So ci al & p er so nal s er vi ce s Go ve rn m en t s er vi ce s Educ at io n Pr iv at e non-p rof it s er vi ce s
Change in final demand Total output change
Fig. 6a. Increase in food processing commodities final demand balanced by a decrease in
0,00 100,00 200,00 300,00 400,00 500,00 600,00 700,00 800,00 900,00 1000,00 Ce re al s In du st ri a l c ro p s Fr u it s Ve g e ta b le s le gu m e s Pa st o ra ls R u ra l i ndu st ri e s Seed Plant s G inn in g of c o tt on O the r pl a n t pr oduc ts M il k & It s d e ri va ti ve s Li ve st o ck Eggs Wo o l Ani m a l h a ir Ski n Fi sh e ri e s Si lk c o co o n s Ho ne y Hon e y w a x Fo od be ve ra g e s a nd t o ba cc o T ex ti le s, c lot hi ng & l ea the r Wo o d a nd f u rn it ur e Pa pe r, p ri n ti ng & p ubl is hi ng C he m ic a l in du st ri es ,t he ir pr oduc ti on s a n d No n -me ta ll ic Ba si c m et a l M et a l pr oduc ts Mi sc e lla n eo u s E xtr acti ve In d us tr ie s El e ct ric it y a n d w a te r B u ild in g & c o ns tr u ct io n W ho le sa le & r e ta il tr ad e T ra n sp or t & com m uni ca ti on Fi na nc e & in su ra nc e So ci al & p e rs o na l se rv ic e s G o ve rn m en t s e rv ic e s Educ a ti o n Pr iv at e no n-pr of it s e rv ic e s
Change in final demand Total Output Change
Fig. 6b. Increase in food processing commodities final demand not balanced Policy to promote economic diversification
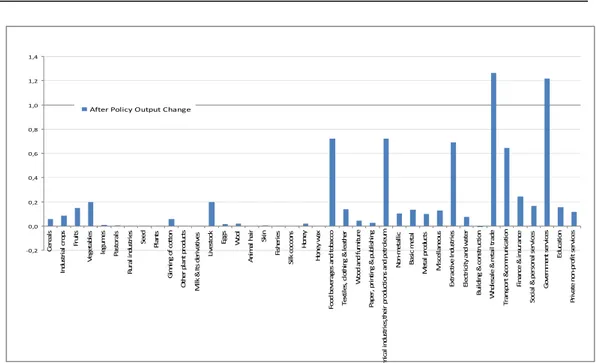
The Al-Ghab region is characterised by a relevant share of agricultural products: this condition requires the analysis of an alternative scenario where a higher economic diversification is assumed. This simulation aims to stimulate the economic diversification by means of a fiscal policy that increases the amount of indirect taxes on a number of commodities by reducing indirect taxes on other commodities. More specifically, we simulate an increase in indirect taxes on agricultural goods (from 1 to 21) and reduce indirect taxes on other commodities by the same amount in order to maintain the total tax revenue. The figure 7 shows the results in terms of After Policy output Change (APC)13 and
confirms the effectiveness of the policy since the reduction of indirect taxes on non-agricultural goods (from 22 to 40) generates an increase in manufacturing and services output. As a general result, the overall total output increases.
13 The results are calculated in terms of output change [After Policy Change (APC) = output after the policy – output before the policy].
This outcome suggests that given this production structure strongly affected by government subsidies to agricultural commodities, the transition from agricultural to non-agricultural economy is achievable only by reducing these subsidies (otherwise increasing indirect taxes) and stimulating non-agricultural commodities production.
Education services as strategic commodity?
In this scenario, we are interested in assessing the effects of a policy oriented to “Education” commodity on the economic system since it is considered one of the main drivers for food nutrition security and human capital development. The analysis focused on “education” commodity originates from the backward and forward dispersion analysis previously discussed.
-0,2 0,0 0,2 0,4 0,6 0,8 1,0 1,2 1,4 Cer e al s In d u st ri al c ro ps Fr u it s Ve g et abl e s le g um es Pa st o ra ls R u ra l in du st ri es See d Pl an ts Gi n n in g o f c ot to n O th e r pl a nt pr od u ct s M il k & I ts d e ri va ti ve s Li ve st o ck Eggs Wool A nim a l h a ir Ski n Fi sh e ri e s Si lk co co o n s Hon e y Ho ne y w a x Fo od be ve ra ge s a n d t o ba cc o T e xt ile s, c lo th in g & le at h er Wo o d a n d f ur n it u re P ape r, pr in ti ng & p u bl is hi ng m ic a l in d us tr ie s, th e ir p ro d uc ti on s a nd p e tr ol e um N o n-m e ta lli c Ba si c m e ta l Me ta l p ro d u ct s Mi sc e lla n eo u s E xtr ac ti ve I n du st ri es El e ctr ic it y an d w a te r B ui ld in g & c o ns tr u cti o n W ho le sa le & r e tai l tr ad e T ra n sp or t & com m u ni ca ti on Fi na nc e & i n su ra nc e So ci al & p er so n al s e rv ic e s Go ve rn m e nt s er vi ce s Ed uc a ti o n Pr iv a te no n-pr of it s er vi ce s
After Policy Output Change
Fig.7. Policy to promote economic diversification In this case, we concentrate only on the
effects of the policy on the production system and we observe that education has a weak relevance in terms of both backward and forward analysis. This means that the “Education” commodity
does not affect the current structure of production and income distribution. Its production is strongly connected with the tertiary sector but less with the other commodities. 0 200 400 600 800 1000 1200 Ce re al s Ind ust ri al c rop s Fr ui ts Veg et ab les leg um e s Pa st or al s R ur al i ndust ri e s Seed Pl an ts G inni ng of c o tt on O the r pl a nt Mi lk & It s Li ve st oc k Eggs Wo ol A nim al h air Ski n Fi sh er ie s Si lk co co on s Ho ne y Ho ne y w ax Fo od b ev er ag e s Te xt ile s, c lot hi ng W ood a nd Pa p er , pr in ti ng & Ch em ic al N on -m et all ic Bas ic m et al M e ta l pr oduc ts Mi sc el la ne ou s Ex tr ac ti ve El ec tr ic it y a nd B ui ldi ng & W ho les al e & Tr an sp or t Fi n anc e & So ci al & pe rs on al Go ve rn m en t Ed u ca ti on Pr iv a te n on-pr ofi t
Change in final demand [FL] Total Output Change [FL]
If we increase the final demand of all commodities (+1,042 millions of SP) and measure the impacts on education total output (forward side), we do not detect any important effects on this commodity. On the other side, a peculiarity of this commodity emerges when observing the effect of the policy on consumption and total output in the backward dispersion analysis (see figure 8). When we increase the final demand of “Education” (+ 1,024 million of SP), the effect on total consumption (+3,713 millions of SP) is higher than the case when the same amount of resources is allocated to all the
components of final demand (+3,509 millions of SP).
Policy for female labour change
This policy aims to generate an increase in female labour by means of a change in value added composition. To be more specific we reduce indirect taxes on each commodity production and use the tax revenue to increase female labour compensations. Than we introduce a shock on final demand with this new value added structure and discuss the effects of this policy in terms of total output change (figure 9).
After Policy Output Change
-5,000 -4,000 -3,000 -2,000 -1,000 0,000 1,000 Ce re al s In dust ri al c rop s Fr u it s Ve ge ta b les le gu m es Pa st o ra ls R u ra l in d u st rie s Se ed Pl an ts G inni ng o f c o tt o n Ot he r pl an t p roduc ts M ilk & It s de ri va ti ve s Li ve st o ck Eg gs Wo o l An im al h air Skin Fi she ri es Si lk co co o n s Ho n ey Ho n ey w ax Fo o d be ve ra ge s a n d t o b ac co Te xt ile s, c lot hi ng & le at he r W o o d a nd f u rn it u re P ape r, pr in ti n g & pu bl is hi n g C h em ic al indust ri es,t h ei r pr od uc ti on s N o n -m et all ic Bas ic m eta l M eta l p ro d u cts Mi sc el la n eo u s Ex tr ac ti ve In d u str ie s El ec tr ic it y a n d w at er B u ild in g & c o n st ru ct io n Wh o le sa le & r etai l tr ad e Tr an sp o rt &c o m m u n ic ati o n Fi na n ce & in sur anc e Soc ia l & pe rs ona l s er vi ce s Go ve rn m en t s er vi ces Educ at io n P ri va te non-pr of it se rv ic es
Fig. 9. Policy for female labour We observe a positive effect on total
output of few commodities: “Other plant products”, “Milk and Its derivatives”, “Fisheries”, “Honey”, “Honey wax”, “Electricity and water” and “Building and construction”. No other commodities receive any positive effect from the new structure of the value added.
Policies implication for the Al-Ghab region in terms of indicators
The results of the policies tested in the previous section can be discussed also in terms of:
a. Economic diversification,
b. Female Labour Market Efficiency, c. Food Nutrition Diversification (FND), d. Food Availability (FA).
We calculate the economic diversification by means of the Herfindahl-Hirschman Index (HHIe). This index is a
measure of the size of each commodity output in relation to the total output and an indicator of the concentration ratio. It is calculated as:
∑
==
n i i eq
HHI
0 2 (3)where qi is the share of commodity output i
on total output, and n is the number of commodities. The Herfindahl-Hirshman Index (HHIe) ranges from 1/N to 1, where N is the number of commodities. To be
more specific, in our research:
- the HHIe index rages from 0,025 to 1;
- a HHIe index below 0,269 indicates
high diversification;
- a HHIe index between 0,269 and 0,513
indicates diversification;
- a HHIe index between 0,513 and 0,756
indicates moderate diversification; - a HHIe index above 0,756 indicates
high concentration.
According to OECD [19], it seems that the food and nutrition security is higher when there is less difference between males’ and females’ wages. For this reason, we consider the ratio between females and males wages as an indicator of Female Labour Market Efficiency (FLME).
The FLME index is therefore computed as: m f
VA
VA
FLME
=
(4)where VAf is the value added generated by
women and VAm is the value added
generated by men. In our research the higher the index the greater will be the labour market efficiency.
Then to complete the analysis, we also
computed the food nutrition security (quality/utilisation) by means of the Herfindahl-Hirschman Index (HHIf) as:
∑
==
k i i fs
HHI
0 2 (5) where si is the share of calories associatedto food i consumption on total calories for food consumption, and k is the number of food commodities. The Herfindahl-Hirshman Index (HHIf) ranges from 1/N to
1, where N is the number of food commodities. To be more specific, in our research:
- the HHIf index rages from 0,066 to 1;
- a HHIf index below 0,299 indicates
high diversification;
- a HHIf index between 0,299 and 0,533
indicates diversification;
- a HHIf index between 0,533 and 0,766
indicates moderate diversification; - a HHIf index above 0,766 indicates
high concentration.
The food nutrition availability is approximate by the change in households food consumption.
The policy scenarios already described have been analysed again in terms of these indexes to have a more precise perception of the effects of the policy measure in terms of food security, poverty, economic diversification and female labour efficiency. The indexes are summarised in table 3.
As showed in the table, the first three policies tested (1, 2, 3a) have a negative effect (high level of the Index means a low degree of diversification) on economic diversification, while all the other policies contribute to promote economic diversification of the Al-Ghab region. With respect to labour market efficiency, the first three policies, policy 5b and in particular policy 6 have a positive effect on labour market efficiency. With respect to the two indicator related to FNS, three
policies contribute to promote food nutrition diversification, while the other policy scenarios have a negative effect on this indicator. Finally, the first three
policies have a negative effect on food availability, while the others contribute to increase food availability.
Table 3
Policy results in terms of economic diversification index, labour market efficiency and food nutrition security
Economic diversification [Herfindahl Index (HHIe)] Female Labour Market Efficiency (FLME) Food Nutrition Diversification [Herfindahl Index (HHIf)] Food Availability [Households food consumption] % change+ % change+ % change+ % change+
Policy 1 0,0169% 0,0357% 0,008557% -0,0133% Policy 2 0,4558% 0,1403% -0,000015% -0,4067% Policy 3 a 0,0035% 0,0205% -0,000007% -0,0321% Policy 3 b -0,2179% -0,0463% 0,000008% 0,2637% Policy 4 -0,2213% -0,0650% 0,000014% 0,2937% Policy 5 a -0,2211% -0,0651% 0,000014% 0,2933% Policy 5 b -0,2274% 0,0248% 0,037368% 0,3121% Policy 6 -0,2205% 4,1622% 0,000014% 0,2925% 4. Conclusions
The application of the SAM and the extended multi-sector model to the Al-Ghab region has allowed the design of a comprehensive framework for the measurement and assessment of regional capital and regional endogenous potential of the Al-Ghab region.
One of the most relevant aspect of this analysis refers to the possibility of identifying some structural indicators, directly computable from the matrix, which can be used to quantify some features of Food Nutrition Security (FNS): the Herfindal Index on food nutrition diversification and an indicator of food availability derived from the household food consumption. Moreover, through the multi-sector approach, we distinguished the labor incomes by gender, allowing the
measurement of some policy effects in terms of Female Labour Market Efficiency (FLME). Therefore, with reference to the main drivers of FNS in the Al-Ghab region (education, labour market efficiency and sectoral diversification) the SAM multipliers analysis has provided tools to identify test and assess the effects of the policies that can better exploit these strategic territorial assets.
As regard to the Sectoral Diversification, it has been possible to identify the policies to promote the diversification of the Al-Ghab economy. The outcome of the analysis suggests that, given this production structure, strongly affected by government subsidies to agricultural commodities, the transition from agricultural to non-agricultural economy is achievable only by reducing these subsidies (otherwise increasing indirect
taxes) and stimulating non-agricultural commodities production.
Education is another key driver of FNS in the region. In the Al-Ghab TCI (Territorial Capital Index), education is understood as a measurement of human capital. We considered education as a “commodity” and looked at the effect of education policies in terms of an increase in the final demand in the “commodity” education. Such policies have a higher impact on the final consumption compared to alternative policies aimed at increasing all the components of the final demand: when we increase the final demand of “Education”, the effect on total consumption is higher than the case when the same amount of resources is allocated to all the components of final demand.
The third key driver of FNS in Al-Ghab is Female Labour Market Efficiency (FLME). To promote female labour we reduce indirect taxes on female labour on each commodity production and use the tax revenue to increase female labour compensations. The result is that the policy to promote female labour, through this redistributive action, has an important impact on the efficiency of the Al-Ghab labour market (4, 16%).
References
1. Barca, F.: An agenda for a reformed
cohesion policy: A place-based approach to meeting European Union challenges and expectations. European
Commission, Brussels, 2009.
2. Barca, F., McCann, P. and Rodríguez-Pose A.: The case for regional
development intervention: Place-based versus place-neutral approaches,
IMDEA Working paper series 2011/15, 2012.
3. Bruneckienė, J. and Snieška, V.:
Measurement of Lithuanian Regions by Regional Competitiveness Index.
Kaunas, 2008.
4. Bulmer-Thomas, V.: Input-Output
Analysis in Developing Countries.
New York. John Wiley and Sons Ltd. 1982.
5. Camagni, R.: On the Concept of
Territorial Competitiveness: Sound or Misleading? In: Urban Studies, 39,
No. 13, 2002.
6. CBS: Statistical Abstract, Syria, http://www.cbssyr.sy/index-EN.htm, 2011.
7. Capello, R., Nijkamp, P.: Handbook of
Regional Growth and Development Theories. Edward Elgar Publishing,
2009.
8. Ciaschini, M., Socci, C: Income
distribution and output change: Macro Multiplier Approach. In: N. Salvadori,
Edward Elgar (eds.) Economic Growth
and Distribution: On the Nature and
Cause of the Wealth of Nations,
p. 247-270, 2006.
9. Ciaschini, M., Socci, C.: Final
Demand Impact on Output: A Macro Multiplier Approach. In: Journal of
Policy Modeling, vol. 29, Issue 1, 2007.
10. Ciaschini, M., Socci, C.: Bi-regional
SAM Linkages: a Modified Backward and Forward Dispersion Approach. In:
Reviews of Urban and Regional Development Studies, vol. 19, Issue 3, 2007, p. 234-255.
11. El Laithy, H. and Magdy, D.: The
State of Socio Economic Condition of Al-Ghab. FAO report, 2011.
12. El Laithy, H. and Abu Ismail K.:
Poverty in Syria: 1996-2004. Diagnosis and Pro-Poor Policy Considerations, United Nations
Development Programme, 2005. 13. Fayez, S.: Poverty in Syria – Towards
a Serious Policy Shift in Combating Poverty. London. Strategic Research
and Communication Centre, 2010. 14. Kitson, M., Martin, R. and Tyler, P.:
Regional Competitiveness: An Elusive yet Key Concept? In: Regional Studies,
(2004),Vol. 38.9, p. 991-999
15. Kitson, M., Martin, R. and Tyler P:
The Regional Competitiveness Debate.
The Cambridge MIT Institute, 2006. 16. MacKinnon, D., Cumbers, A., Pike, A.
and Birch, K: Evolution in Economic
Geography: Institutions, Regional Adaptation and Political Economy.
CPPR Centre for Public policy for Regions, 2007.
17. Miyazawa, K.: Input-Output Analysis
and Structure of Income Distribution,
New York, vol. 116, 1976.
18. OECD: Innovative Rural Regions. The
role of human capital and technology.
Rural Policy Conference, Caceres, Spain, 2007.
19. OECD: New Rural Paradigm.
Organisation for Economic Cooperation and Development. Paris,
2006.
20. OECD: Growing Lagging Regions.
The New Regional Development Paradigm. Organisation for Economic Cooperation and Development. Paris,
2010.
21. OECD: How Regions Grow.
Organisation for Economic Cooperation and Development. Paris,
2009.
22. OECD: Regions Matter. Economic
Recovery, Innovation and Sustainable Growth. Organisation for Economic Cooperation and Development. Paris,
2009.
23. OECD: Territorial Outlook.
Organisation for Economic Cooperation and Development. Paris,
2001.
24. Porter, M.: The economic performance
of regions. In: Regional Studies, 2003,
37, p. 549-578.
25. Pyatt, G.: Some early multiplier
models of the relationship between income distribution and production
structure. In: Economic Systems
Research, 2001, 13, 2, p.139–164. 26. Pyatt, G.: Some relationships between
t-accounts, input-output tables and social accounting framework. In:
Economic Systems Research, 1999, 11, p.365–387.
27. Pyatt, G., Round, J.: Accounting and
fixed price multipliers in a social accounting matrix framework. In: the
Economic Journal, 1979, 89,
p.850-873.
28. Rasmussen, P.: Studies in Intersectoral
Relations. Amsterdam, North Holland.
1956.
29. Round, J.: Constructing SAMs for
Development Policy Analysis: Lessons Learned and Challenges Ahead. In:
Economic Systems Research, 2003, Vol. 15, No. 2.
30. Round, J.: Social Accounting Matrices
and SAM-based Multiplier Analysis.
The World Bank, Washington D.C., 1979.
31. Socci, C.: Distribuzione del reddito e
analisi delle politiche economiche per la regione Marche, Collana della facoltà di Giurisprudenza, Università
di Macerata, Giuffrè Editore, vol. 118, 2004.
32. Timpano, F., Ciaschini, M., Cistulli, V., Marta, S., Pretaroli, R., Severini, F., Socci, C.: The Territorial
Perspective of Food Security Policies and Strategies, Report FAO, 2013.
33. World Bank: Reshaping Economic
Geography. World Development
Report, World Bank, 2009.
34. UN High Level Task Force on the
Global Food Security Crisis,
UPDATED COMPREHENSIVE FRAMEWORK FOR ACTION, September 2010.
35. UN, System of National Accounts. N.U., New York, 2008.
A1. Appendix
Table A.1. Classification of commodities and Industries in the SAM
Commodities & Industries 1 Cereals 2 Industrial crops 3 Fruits 4 Vegetables 5 legumes 6 Pastorals 7 Rural industries 8 Seed 9 Plants 10 Ginning of cotton 11 Other plant products 12 Milk & Its derivatives 13 Livestock 14 Eggs 15 Wool 16 Animal hair 17 Skin 18 Fisheries 19 Silk cocoons 20 Honey 21 Honey wax
22 Food beverages and tobacco 23 Textiles, clothing & leather 24 Wood and furniture
25 Paper, printing & publishing
26
Chemical industries, their productions and petroleum refinement 27 Non-metallic 28 Basic metal 29 Metal products 30 Miscellaneous 31 Extractive Industries 32 Electricity and water 33 Building & construction 34 Wholesale & retail trade 35 Transport &communication 36 Finance & insurance
37 Social & personal services 38 Government services 39 Education