http://www.scirp.org/journal/as ISSN Online: 2156-8561
ISSN Print: 2156-8553
Agriculture, Profitability and Climate Change:
Can Accounting Help Identify Best Farming
Practices? Empirical Case Study in Spain
Carla Antonini, Josep María Argilés-Bosch
Department of Accounting, University of Barcelona, Barcelona, Spain
Abstract
We perform an empirical analysis on the benefits of, and the challenges faced by, sustainability accounting in measuring the effects of climate change for a sample of Spanish rice farms. We use farm yields, revenues and incomes as indicators of economic performance, and greenhouse gas emissions, and di-rect and indidi-rect energy consumption as indicators of climate change effects. According to our data, farms with higher yields, revenues and income are re-sponsible for a greater environmental impact, measured in total gigajoules of energy consumed and tons of carbon dioxide emitted, than farms with a lower economic performance. Results show that in our sample the achievement of higher yields is attributable to the greater use of chemical inputs and fossil fu-els and not to innovative and sustainable farming practices. The results indi-cate that accounting for climate change effects is not only possible but also necessary to provide more accurate information on the overall costs and benefits of farming. Greater transparency in accounting information should serve to highlight which farming activities are better able to reduce climate change impacts.
Keywords
Climate Change Accounting, Economic Performance, Energy Consumption, Greenhouse Gas Emissions, Rice Production, Sustainability Accounting
1. Introduction
An increasing body of scientific evidence continues to fuel concerns regarding the effects of human activity on climate change. The main sources of anthropo-genic global warming, in order of importance, have been identified as electricity generation, land-use changes, agriculture and transport [1]. In the fight to
re-How to cite this paper: Antonini, C. and Argilés-Bosch, J.M. (2017) Agriculture, Profitability and Climate Change: Can Accounting Help Identify Best Farming Practices? Empirical Case Study in Spain. Agricultural Sciences, 8, 209-226.
https://doi.org/10.4236/as.2017.83015 Received: December 7, 2016
Accepted: March 6, 2017 Published: March 9, 2017 Copyright © 2017 by authors and Scientific Research Publishing Inc. This work is licensed under the Creative Commons Attribution International License (CC BY 4.0).
http://creativecommons.org/licenses/by/4.0/ Open Access
duce the greenhouse gases attributable to these human activities the develop-ment of accurate systems of measuredevelop-ment of these emissions has acquired great importance.
In the field of accounting there have been abundant attempts to measure and value the impact of human activity on climate change. For example, sustainabil-ity accounting aims to provide stakeholders with a set of tools for addressing en-vironmental, social and economic concerns [2]; full cost accounting seeks to capture more fully the social and environmental consequences of economic ac-tivities [3]; and, carbon accounting provides procedures for calculating the amount of carbon emitted by different sources or the amount stored [4].
However, evaluating the impact of human activities on climate change repre-sents a considerable challenge in accounting given the absence of a globally ac-cepted scheme capable of measuring systematically the interconnection between nature and economics. In the traditional accounting framework the environ-mental impacts of human activities are considered as “externalities” [5], their exclusion resulting in biased information. The expenses recorded in financial databases appear too low as some costs are passed on to external parties, and so artificially low costs and prices are disclosed [6].
In short, measuring greenhouse gases attributable to human activities is a way of reducing human impact on climate change. But emissions and other envi-ronmental impacts are still given no consideration in traditional accounting and, therefore, any related costs are valued at zero in traditional financial statements. One way of demonstrating that zero is not the right value for externalities is to analyse how they interrelate with economic performance. Despite considerable advances over the last twenty years in integrating economics and environmental issues, the valuation and association between their respective performances re-main inconclusive [7].
For instance, some authors report a positive influence of a firm’s environ-mental performance on its financial performance [8] [9], claiming that a sus-tained improvement in environmental performance enhances financial out-comes. By contrast, others report just the opposite, with a better financial per-formance being associated with a poorer environmental record [10]. Finally, a third group of researchers argues that no clear pattern emerges in the relation-ship between economic and environmental performance [11][12].
These differences can be attributed to at least three reasons. First, the field lacks, as discussed above, a globally accepted system for measuring the environ-mental impact of human activities, with previous research relying heavily on firms’ financial data and failing to provide a true account of the economic im-pact of the environmental externalities of their activities.
Second, these studies have applied an array of different measures of environ-mental performance that are prone to give a variety of results and conclusions. Additionally, most use proxies of environmental impact rather than a specific measure. For example, Henri and Journeault [10] built indicators from firms’
survey responses while Déjean and Martinez [13] and Jacobs et al. [11] con-structed them from firms’ voluntary disclosures, the weakness being that these disclosure are typically made so as to influence stakeholders via biased, rather than reliable, information [14]. Wahba [8], on the other hand, considered com-pliance with ISO 14000 or ISO 14001 (environmental certificate) as a proxy for good environmental performance; however, obtaining these certificates does not necessarily reflect the firms’ true environmental impact rather they serve only as an indication that they adhere to certain rules of eco-efficiency. Third, the con-ducting of studies at the macroeconomic scale involves a high level of complex-ity since while environmental impacts are barely comparable at the interregional level they are even less so at that of macroeconomic blocks. Moreover, macro-economic databases are prone to miss regional ecological differences that might be significant in the evaluation of environmental impact and they also tend to aggregate firms from different sectors, thus resulting in heterogeneous samples.
The contribution of this study is to analyse the incidence of anthropogenic climate changes on economic performance by adopting a different approach to those taken by previous studies. Thus, the paper takes a microeconomic ap-proach, drawing on a homogeneous sample of rice farms, and evaluating envi-ronmental performance by applying measures of actual envienvi-ronmental impacts, focusing not only on the externalities resulting from the firm’s immediate pro-ductive stage, but also those arising in the earlier propro-ductive stages of the inputs required by the farm. Additionally, we use a widely accepted methodology for measuring a firm’s environmental impact.
The study finds that enhanced economic performance is attained at the ex-pense of increasing environmental damage. Conventional farming is concerned above all with achieving short-term economic targets with the use of environ-mentally aggressive inputs across the whole agribusiness cycle to enhance eco-nomic performance. The study identifies the best practices not only in ecoeco-nomic terms but also from a climate change perspective. However, organic rice farming is found to be more respectful of the environment, albeit at the expense of lower yields in the short term. Nevertheless, these practices ensure higher financial profits, even in the short term.
It seems that decision-making based exclusively on traditional accounting in-formation, and/or on data on the environmental performance of the specific ag-ricultural productive stage tends to hide environmental degradation. Therefore, further research is needed, along with practical improvements in sustainability accounting, to provide essential guidelines for the better administration of natu-ral resources.
The remainder of this article is organised as follows. Section 2 discusses the advances made in the accounting of the environmental impact of farming. Sec-tion 3 explains the methodology adopted. SecSec-tion 4 presents the results and a discussion of these findings and, finally, section 5 offers some concluding re-marks, while identifying some of the limitations of the study and avenues for further research.
2. Accounting for the Impact of Farming on Climate Change:
The Challenges
Over recent decades, input-intensive agricultural technologies have brought about significant changes in agricultural production, especially, for cereal crops. The increasing use of genetically modified seeds, irrigation, chemical fertilisers, pesticides and mechanisation have, in some cases, resulted in higher yields [15]. However, they have also resulted in undesirable anthropogenic causes of climate change with increased greenhouse gas (GHG) emissions due to a grow-ing dependence on scarce fossil fuels [16]. Studies of the industrialisation of farming have provided evidence that certain practices mean the misuse of com-mon resources. Agriculture’s vast energy consumption is today estimated at an annual 11 exajoules (EJ), and this amount is set to rise with expanding popula-tions and the mechanisation of farming [17].
Additionally, modern agricultural practices are having other environmental impacts, including, the degradation of soil and water quality, and the loss of bio-diversity, wildlife habitats and landscapes [18]. The heavy dependence of farm-ing on chemical pesticides and fertilisers has increased in recent years and today they pose a serious threat to human health and the environment. However, de-spite the investment in pesticides, pests are calculated to destroy 50% of treated crops worldwide [19]. Yet, at the same time, millions of humans suffer the ef-fects of pesticide poisonings each year [20]. The overuse of chemical pesticides, combined with monocropping, is also the cause of the loss of biodiversity [21], while the overuse of fertilisers is one of the main causes of water pollutant runoff and leaching [22].
In conventional farming, the increase in required inputs results not only in unwanted environmental degradation but also in an undesired rise in operating costs. Thus, the average net income per farm has declined and the average debt per farm has increased in the long term [23]. As a result, a call has been made to shift the goal from maximising productivity to optimising agricultural produc-tion while upholding environmental and social justice [24].
The need to reduce the GHG emissions from agriculture has highlighted the urgency of shifting to non-fossil fuels. Here, each new scenario requires a spe-cific accounting measure and a method for predicting natural resource use maximization [2]. Accounting for natural resources in this way should provide an efficient system for monitoring, controlling and mitigating irresponsible be-haviour [25], thus making it possible to achieve the aforementioned goals of maximization. The environmental and social elements involved in economic ac-tivities can be addressed through sustainability accounting, a school of practice that provides tools for performance measurement and reporting when consid-ering such matters as carbon reduction and water shortages or surpluses attrib-utable to climate change [26].
Research carried out to date monitoring the impact of agriculture on climate change has, in some instances, compared the productivity and environmental impact of different styles of farming, but it does not quantify differences in
eco-nomic performance [27][28]. Thus, various studies specifically analyse the dif-ferences in productivity of conventional and organic farming [29][30] and al-though they take into account the environmental dimension, their focus is very much on technical efficiency. Clearly, the limitation is that technical efficiency is ultimately measured in terms of the yields, inputs and prices explicitly recorded in a farm’s accounts, and as such needs to be economic-centred. The research conducted to date tends merely to consider the minimisation of current (inter-nal) expenses but it fails to take externalities into account.
The solution proposed from within the academic world for revealing and “in-ternalizing” farming externalities is that of placing a monetary value on them [31][32][33].
This paper contributes to the analysis of how climate change externalities might be accounted for by presenting a microeconomic perspective for rice production and the measurement of the environmental impact of farming prac-tices conventional and organic.
3. Methodology
In adherence with the framework devised within sustainability accounting for assessing the sustainability effects of biomass [2], we apply the following six steps: scoping, identification of sustainability impacts, choice of indicators, measurement, auditing and reporting.
Step 1—scoping: We conduct an analysis on a sample of Spanish rice farms in one specific year, 2011, to ensure comparability of data across the sample. Rice is a major food staple, playing a vital role in the nutrition of over half the world [34]. It is a mainstay of food security and a vital source of income, as well as being a central element in the culture of a number of communities. In Europe, Spain is the second largest producer of rice after Italy [35].
Rice has been identified as one of the main source categories within the agri-cultural sector for mitigating climate change under the Kyoto Protocol [36]. Di-rect and indiDi-rect energy consumption and GHG emissions from rice production (GHG Scopes 1, 2 and 3-see the third step below) are analysed here. While we do not consider farms producing crops other than rice, the whole conventional ag-ricultural sector has experienced a similar trend in its intensive use of inputs that are disrespectful of the environment (see the discussion in section 2). As such, we believe that our conclusions regarding GHG emissions and energy consump-tion are valuable for, and can be extended to, the whole of agricultural produc-tion.
Step 2—identification of sustainability impacts: See the discussion in rela-tion to the sustainability of farming in secrela-tion 2.
Step 3—choice of indicators: We use indicators of both economic and envi-ronmental performance, and analyse the incidence of the latter on economic outcomes by comparing environmental impact data from both high and low economic performers (for both conventional and organic rice production).
kilograms, sales revenues, and income both before and after wages. These indi-cators have previously been considered as being representative of economic per-formance. The farms in the sample provided the economic data required to conduct the study. This included their outputs, the market prices for their prod-ucts, their wage bill and the cost of each input. In the sample, some farms de-pend exclusively on the family for labour input while others use hired workers. Given that western agriculture is still predominantly characterised by family farms [37], there is a long established tradition of including family labour in in-stitutional reports and research studies that seek to provide comparable farm incomes [38]. Therefore, we calculate and add the opportunity cost of family work by applying the average hourly cost of external wages in our sample to the number of hours of family work on each farm so as to calculate income before and after wages. Our environmental performance indicators are paddy field GHG emissions and energy consumption, distinguishing between direct and in-direct consumption. These indicators have also been used in previous studies as environmental indicators in agriculture [17][39].
The GHG protocol distinguishes three scopes which help identify the infor-mation that needs to be collected about the discharged and induced greenhouses gases [40]: Scope 1 deals with emissions released directly by the company. This includes production and service processes owned or controlled by the company as well as the corporate fleet of cars and trucks. The GHG protocol covers only the six GHGs listed in the Kyoto protocol. CFCs and NOx are excluded, it is ar-gued, on political grounds [2] (Burritt & Schaltegger, 2012). Scope 2 covers emissions indirectly caused by the generation of purchased electricity. And Scope 3 includes emissions from suppliers of inputs and downstream emissions from distribution, use and end of product. Scope 3 extends this accounting scope to emissions indirectly attributable to the purchase of all kinds of goods and ser-vices such as semi-manufactured goods, transportation serser-vices, waste disposal services, outsourced activities, etc. This study considers all three Scopes. Unfor-tunately, we did not have access to measurements of other environmental exter-nalities of rice production, such as, impact on human health, loss of biodiversity, wildlife and landscape degradation, water filtering or the substitution of natural wetlands [41]. These environmental impacts regrettably lie outside the scope of this paper.
Step 4—measurement: The collection and conversion of data were made possible thanks to a joint enterprise involving the authors and the researchers of an EU-funded project for assessing the potential of agriculture to combat climate change [42]. This project seeks to apply a common evaluation system in the four largest agricultural economies of the EU so as to identify suitable farming prac-tices. This has resulted in the development of diagnostic software capable of converting the data collected via surveys into direct (that is, of both renewable and non-renewable sources of electricity and fuels) and indirect energy con-sumption (an estimation of the energy spent in the production and transport of required inputs), both expressed in gigajoules (GJ) per year. To this end, a
ques-tionnaire was first designed to facilitate information collection and to enable a consistent level of comparison.
With the data, and on the basis of a series of consultations with experts in the field of rice production in the region, the team were able to build the environ-mental indicators that are used in this study. These data refer to both physical and monetary measurements of farm size, location, annual yields, brand and age of machinery used, litres of fuel consumed, kilograms of seeds planted, amounts of fertilisers, herbicides and pesticides used in the field, characteristics and amounts of water required, and flooding practices during the season. These raw data were then converted into GHG emissions and energy consumption statis-tics. ISO 14064-1 and the GHG protocol [43] [44] guidelines were followed to convert the data collected into GHG emissions. Emissions of different GHGs were converted and are expressed in equivalent tons of carbon dioxide (tCo2) per year.
Step 5—auditing and assurance, verification and certification: Given the characteristics of the study no external auditing or certification were possible. All data were collected by the authors, which ensures their consistency and comparability. Prices and costs provided by farmers were verified by consulting available market prices. Rice production experts were requested to verify that the inputs used in the farms in the sample were consistent with local patterns.
Step 6—reporting: The main audience for the results of the study are the farmers included in the sample given that the project studies current practices in order to identify best practices and innovative methods for improving environ-mental performance. On the conclusion of the study, two meetings were held with the farmers in order to share our results and to suggest practices that help combat climate change.
The study sample comprises nine farms. Of the nine farms, eight practise the various techniques of conventional farming and one operates as an organic farm. In total, nine farmers attended a personal interview with the authors of the study. The selection of farmers was made based on the personal availability to participate and the comparability among farms. In accordance with the ethical agreement governing interviews, the specific identity of the participants cannot be disclosed. Five farms specialise in a variety of rice known by the name of gleva, and four specialise in a variety known as bomba. The varieties of rice produced, the size of the farms and the yield productivity per hectare of the farms included in the sample can be considered representative of rice farms in Spain [35]. All the data collected adhere to the same definitions and were meas-ured applying the same rules. All figures and data correspond to the same year, that of 2011.
The inclusion of an organic farm allowed comparisons to be drawn, given that previous research suggests that organic farming tends to have a lower environ-mental impact [21]. Although all the farms lie within natural parks included on the Ramsar list of wetlands, and all the farmers are recipients of European subsi-dies in recognition of the environmental measures they implement, the
envi-ronmental practices in conventional farms are generally poor.
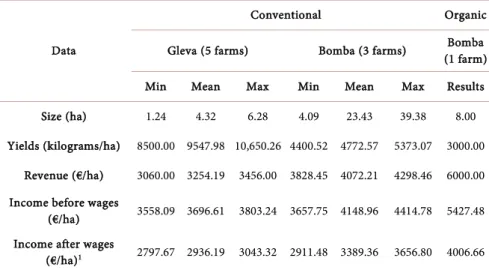
Table 1 displays the descriptive statistics of the nine farms under study for the year 2011. More specifically, we show the minimum, mean and maximum values for each economic variable. Economic data variables are expressed per hectare (ha) and information is shown separately for the two rice varieties (gleva and bomba).
According to the data in Table 1, the farms producing gleva range from 1.24 to 6.28 ha of utilised agricultural area (UAA), with an average of 4.32 ha. Farms producing bomba under conventional farming range from 4.09 to 39.38 ha of UAA, with an average of 23.43 ha. Despite these differences in UAA, the pro-ductivity in kilograms (kg) and the income per hectare of the farms producing both rice varieties are fairly similar. In the case of the conventional farms, the
maximum deviation in yield is between the most productive gleva farm
(10,650.26 kg/ha) and the mean figure for this variety of rice (9547.98 kg/ha): i.e., 1102.28 kg/ha (12.9%) more than the mean. The deviations for the other economic indicators are not as great. Therefore, the conventional farms can be considered largely homogeneous in terms of the economic indicators selected for analysis.
However, substantial differences are found with respect to the sub-samples of conventional and organic bomba-producing farms. The organic farm in the study reports yields of 3000 kg/ha compared to an average yield on conventional farms of 4772.57 kg/ha: i.e., 1772.57 kg/ha less or 37% less.
However, sales revenue and income are substantially higher in the case of the organic farm. It reports revenue of 6000 euros/ha compared to a mean of 4072.21 on conventional bomba-producing farms and an income after wages of 4006.66 euros/ha compared with a mean of 3389.36 euros/ha on conventional bomba-producing farms: i.e., 1927.79 and 617.3 euros/ha more, respectively. Clearly, despite lower yields, organic production currently boasts a special mar-ket share of customers able to pay a higher price per kilogram of rice.
Table 1. Descriptive statistics of sample (year 2011).
Data
Conventional Organic Gleva (5 farms) Bomba (3 farms) (1 farm) Bomba Min Mean Max Min Mean Max Results Size (ha) 1.24 4.32 6.28 4.09 23.43 39.38 8.00 Yields (kilograms/ha) 8500.00 9547.98 10,650.26 4400.52 4772.57 5373.07 3000.00
Revenue (€/ha) 3060.00 3254.19 3456.00 3828.45 4072.21 4298.46 6000.00 Income before wages
(€/ha) 3558.09 3696.61 3803.24 3657.75 4148.96 4414.78 5427.48 Income after wages
(€/ha)1 2797.67 2936.19 3043.32 2911.48 3389.36 3656.80 4006.66
4. Results and Discussion
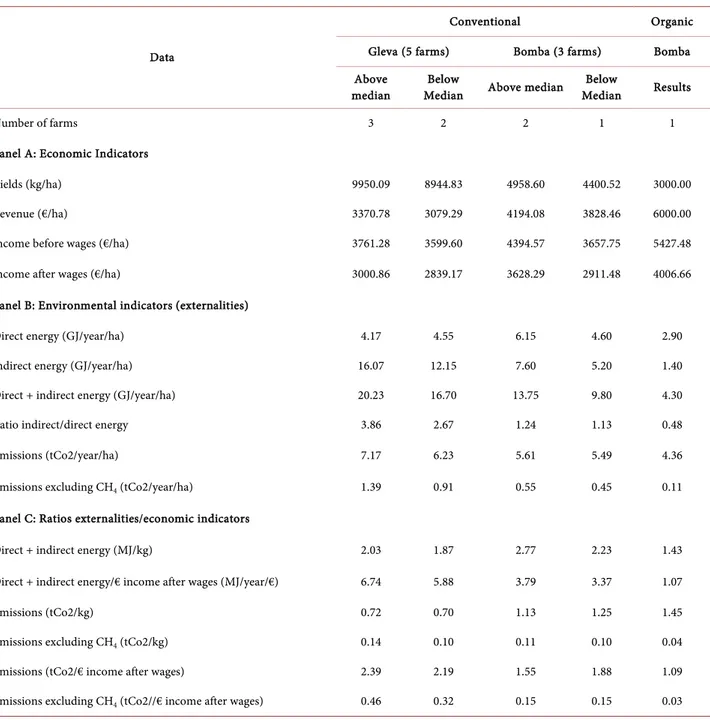
Table 2 shows the results when relating the environmental indicators to the economic variables under analysis for farms that present values below and above the median for each economic variable, and for both varieties of rice (gleva and bomba). The ratios in panel B are expressed in gigajoules per year per hectare (GJ/year/ha). To facilitate comprehension, the ratios in panel C are expressed in megajoules (MJ) per year per euro of income after wages (MJ/year/€). Note, 1 GJ is equivalent to 1000 MJ.
Table 2. Economic and environmental performance relationship (year 2011).
Data
Conventional Organic Gleva (5 farms) Bomba (3 farms) Bomba Above
median Median Below Above median Median Below Results
Number of farms 3 2 2 1 1
Panel A: Economic Indicators
Yields (kg/ha) 9950.09 8944.83 4958.60 4400.52 3000.00 Revenue (€/ha) 3370.78 3079.29 4194.08 3828.46 6000.00 Income before wages (€/ha) 3761.28 3599.60 4394.57 3657.75 5427.48 Income after wages (€/ha) 3000.86 2839.17 3628.29 2911.48 4006.66 Panel B: Environmental indicators (externalities)
Direct energy (GJ/year/ha) 4.17 4.55 6.15 4.60 2.90 Indirect energy (GJ/year/ha) 16.07 12.15 7.60 5.20 1.40 Direct + indirect energy (GJ/year/ha) 20.23 16.70 13.75 9.80 4.30 Ratio indirect/direct energy 3.86 2.67 1.24 1.13 0.48 Emissions (tCo2/year/ha) 7.17 6.23 5.61 5.49 4.36 Emissions excluding CH4 (tCo2/year/ha) 1.39 0.91 0.55 0.45 0.11 Panel C: Ratios externalities/economic indicators
Direct + indirect energy (MJ/kg) 2.03 1.87 2.77 2.23 1.43 Direct + indirect energy/€ income after wages (MJ/year/€) 6.74 5.88 3.79 3.37 1.07
Emissions (tCo2/kg) 0.72 0.70 1.13 1.25 1.45
Emissions excluding CH4 (tCo2/kg) 0.14 0.10 0.11 0.10 0.04 Emissions (tCo2/€ income after wages) 2.39 2.19 1.55 1.88 1.09 Emissions excluding CH4 (tCo2//€ income after wages) 0.46 0.32 0.15 0.15 0.03
Notes: GJ/year/ha: gigajoules per year per hectare. tCo2/year/ha: tons of carbon dioxide per year per hectare. MJ/kg: megajoules per kilogram.MJ/year/€:
megajoules per year per euro of income after wages.tCo2/kg: tons of carbon dioxide per kilogram.tCo2/€ income after wages: tons of carbon dioxide per
All conventional farms above the median presented higher production, reve-nue and income results than those presented by their counterparts below the median, for both rice varieties. The sales price of bomba rice was higher than that of the gleva variety, but the costs associated with this first variety were also higher, and so income levels were similar if we compare the two rice varieties for the same group of performers.
Given that the organic farm presents substantially different characteristics, its results are shown separately in the final column. The farm, located in the natural park of Aiguamolls de Pals in Catalonia (Spain), is a Ramsar site and yet it is the only organic rice farm of the 29 rice farms in the region. Organic rice production in Spain is in its early stages of development and the rice-farming sector contin-ues to be dominated by conventional practices. While its yield per hectare fell well below that of conventional farms, its revenue and income per hectare were much higher. The organic farm in our sample is, therefore, one the few organic rice farms operating in Spain and it benefits from a highly atypical, yet extremely profitable, business plan. It produces relatively small quantities of high value- added outputs and undertakes direct selling of most of its production to high profile restaurants and distribution channels.
Panel B displays the environmental performance for both rice varieties. Direct energy consumption was higher for the sub-sample of bomba producers with an above median economic performance than that of below median producers-6.15 vs. 4.60 GJ/year/ha, respectively. However, the same relationship did not hold for the sub-sample of gleva producers. Here, farms with an above median eco-nomic performance consumed less direct energy (4.17 GJ/year/ha) than that consumed by their below median counterparts (4.55 GJ/year/ha). Note, however, that direct energy consumption represented a small share of the overall envi-ronmental impact attributable to energy consumption.
The measures of indirect energy consumption offer an appraisal of the accu-mulated energy consumption from previous productive stages. According to the results in panel B, this consumption was substantially higher than that of direct energy in all the conventional farms, and substantially higher for the sub-sam- ples of more (as opposed to less) productive and profitable farms: 16.07 GJ/year/ ha vs. 12.15 for gleva producers and 7.60 vs. 5.20 for bomba, respectively.
The ratio between indirect and direct energy consumption increased with the intensification of farming practices. According to our data, indirect energy con-sumption was 3.86 times greater than that of direct energy in the sub-sample of more productive gleva rice farms, while it was only 2.67 times greater in the less productive farms of this rice variety. While the ratios were lower for conven-tional farms producing bomba rice, the indirect energy required was also greater than the direct energy consumed in the productive stage on these farms. Indeed, the ratio also increased with productivity on the bomba ricefarms: a ratio of 1.24 for the more productive vs. 1.13 for the less productive farms. This means that the attainment of good levels of productivity and profitability requires the pur-chasing and use of inputs that have previously consumed large amounts of
en-ergy, inputs that have consequently damaged the environment, depleted the earth’s natural resources and overloaded the planet with an increasing ecological footprint. Total energy consumption (direct plus indirect) was consequently higher for conventional farms with an above median economic performance compared to that of less productive farms, as can be seen in Table 2: 20.23 GJ/year/ha vs. 16.70 for gleva rice farms and 13.75 vs. 9.80 for bomba, respec-tively.
Our indicator of direct energy only captures the impact of electricity and fuels used on the farms, but does not take into account the energy required for the production and transport of various farming inputs, including, fertilisers, seeds bought from outside the farm, pesticides, herbicides and fungicides, packaging plastics, oil, infrastructure and machinery, among other major inputs in indus-trial agriculture that are included in our indicator of indirect energy consump-tion. In modern conventional agriculture, increased productivity is achieved by implementing intensive crop techniques that require preliminary extractive and manufacturing activities that have a high impact on the environment. These im-pacts are triggered in the early stages of a farm’s productive activity when the inputs that are required are being produced and transported to the farm.
The equivalent data for the organic farm describe the profile of a more envi-ronmentally friendly farming practice. Direct energy consumption on this farm (2.90 GJ/year/ha) was substantially lower than for any other group of rice pro-ducers in the sample. Its indirect energy consumption was more than 50% lower than its direct consumption. In contrast to conventional farms, it does not pro-duce prior high-level environmental impacts. Its total energy consumption (4.30 GJ/year/ha) was well below that of any other sub-sample (9.8 being the next lowest figure recorded by the less productive bomba rice farms), and its direct consumption was below the lowest rate of direct energy consumed by bomba rice producers (4.55 GJ/year/ha consumed by the low bomba economic per-formers). The organic farm not only consumed less energy in the final stage of agricultural production, but also in prior stages. It is environmentally friendly in its dealings and requirements across the whole agribusiness cycle. As such, it provides a remarkable example that a sustainable, and at the same time highly profitable, farming system is feasible. However, according to results, it does not appear that a similar performance could be attained within the boundaries of conventional farming, where increased productivity requires increasing the use of chemical inputs and fossil fuels and, therefore, greater environmental damage. No economies of scope are to be found in this instance. On the contrary, there is an exponential relationship between productivity and environmental damage when we compare organic and conventional rice farms. These results are consis-tent with previous studies with other crops in terms of the increasing environ-mental damage caused by increasing the use of external inputs (Mondelaers et al., 2009).
GHG emissions per hectare were higher for the sub-sample of conventional farms with an above median economic performance, 7.17 and 5.61 tons of
car-bon dioxide per year per hectare (tCo2/year/ha) for gleva and bomba rice farms, respectively, than those with a lower economic performance (6.23 and 5.49 tCo2/year/ha, respectively), while they were substantially lower for the organic farm (4.36 tCo2/year/ha). Therefore, our results suggest that the higher eco-nomic performance of rice farms is attained at the expense of greater air pollu-tion.
Panel C provides data on the environmental impact needed to produce a physical unit of output and to obtain a monetary unit of income. As such, it re-lates the economic performance data in panel A to the environmental perform-ance data in panel B.
Overall, the data in panel C confirm previous results regarding the existence of a positive relationship (albeit negative in terms of sustainability) between en-vironmental performance and economic performance. While this relationship was strong with respect to energy consumption, it was weaker for GHG emis-sions.
According to our results, the less productive gleva rice farms consumed 1.87 MJ of total energy in producing one kilogram of rice, while the more productive farms required 2.03 MJ for one kilogram of output. The same increasing rela-tionship is observed for bomba rice farms: the group of less productive farms needed 2.23 MJ, while the more upper productive required 2.77 MJ. Likewise, 5.88 MJ was required to generate 1 € of income after wages in the less profitable group of gleva rice producers, while the more profitable group required 6.74 MJ. The same trend was found in conventional farms producing bomba rice (3.37 MJ vs. 3.79 MJ for lower and higher performers, respectively).
The results for GHG emissions are not conclusive. While gleva rice producers adhere to the aforementioned trend of increasing productivity resulting in a greater environmental impact: increasing emissions per kg of rice, as well as per € of income, with increasing economic performance, the conventional bomba rice producers adhere to a declining trend: less productive farms require more emissions per kg of output (1.25 tCo2/kg), or per € of income (1.88 tCo2/€ in-come after wages) than their more productive counterparts (1.13 and 1.55, re-spectively). It should perhaps be stressed that our results might be influenced by the fact that on rice farms the main emission is methane, which does not in fact depend so much on output as on the size and flooding cycles of the field. Emis-sions of nitrous oxide and carbon dioxide (see emisEmis-sions excluding CH4) were more closely related to productivity: high gleva economic performers released 0.14 and 0.46 tCo2 per kg and per € of income after wages respectively compared to 0.10 and 0.32, respectively, in the case of low performers. The emissions of the bomba producers were virtually the same for producers above and below the median.
The data in panel C also confirm our previous findings of panel A and B with respect to the organic farm. This farm required much less energy consumption per kilogram of output and per € of income than did their counterparts in the sample. Likewise, it produced lower field emissions than those of conventional
farms per € of income (1.09 tCo2). However, it produced more field emissions per kilogram of rice cropped (1.45 tCo2), a fact that can be explained in terms of its lower productivity in physical units per UAA; nonetheless, it is more envi-ronmentally friendly when methane is excluded from the analysis (0.04 tCo2/kg and 0.03 tCo2/€ of income).
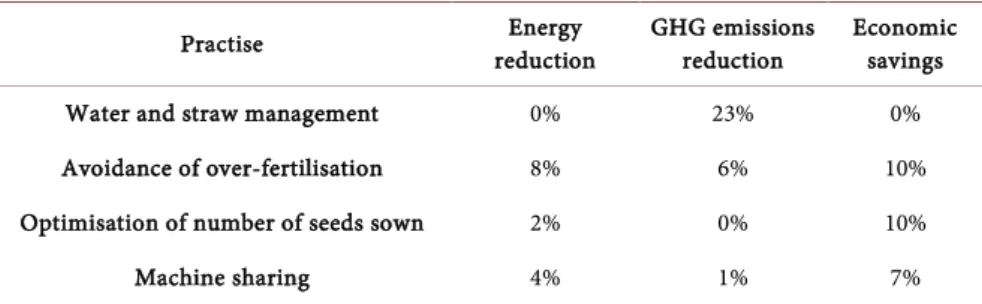
Table 3 shows how GHG emissions, energy consumption and operative costs can be reduced depending on the farm management practices implemented. Four practises are analysed here: water and straw management; the avoidance of over-fertilisation; the optimisation of the number of seeds sown and the sharing of machinery.
Most of the emissions associated with rice production are related to water management (flooding practices impacting on methane emission rates) and ni-trogen fertilisers (emissions of nitrous oxide).
Water and straw management related practices are the most effective in re-ducing emissions from paddy fields. Methane emissions depend on the combi-nation of flooded and dry periods in the field, the management of straw and or-ganic matter and the duration of the total cycle of production. Although they have no direct impact on energy consumption or on economic performance, these best practices would allow GHG emissions to be reduced by up to 23%.
The elimination of excess fertilisers is a good option for reducing GHG emis-sions and energy consumption. It also allows operative costs to be reduced and, hence, to improve economic performance. In our case study, for example, four of the nine farms presented a surplus of fertilizer use of between 17% and 37%. Best practises would reduce energy consumption by up to 8% and GHG emis-sions by up to 6% and thus save approximately 10% in fertiliser costs.
The optimisation of the number of seeds sown and the sharing of machinery for various tasks are two measures that are related directly with a reduction in energy consumption. Both would result in an energy reduction of 2% and 4%, respectively. Although the two measures have a good impact on economic sav-ings (10% and 7%, respectively), they have almost no impact in reducing GHG emissions.
As we can see, identifying best practises is not a linear process and involves a
Table 3. Incidence of farm management practises on environmental and economic im-pacts1.
Practise reduction Energy GHG emissions reduction Economic savings Water and straw management 0% 23% 0% Avoidance of over-fertilisation 8% 6% 10% Optimisation of number of seeds sown 2% 0% 10%
Machine sharing 4% 1% 7%
1Source of calculations: Life + 09 ENV/ES/000441, 2013. Estimations made for an hypothetical farm of 4
hectares using the best practices suggested by experts in rice production in Spain in comparison with the media used by farms in sample.
complex decision-making process that takes into account environmental and economic factors as well as the needs of the stakeholders. In this case study, farmers were most likely to accept suggestions that benefited their farms eco-nomically. GHG emissions and energy consumption were generally considered as being of secondary importance or disregarded altogether if they were not as-sociated with any economic benefit. This suggests that for these farmers the value of any environmental impact is zero, as it is assumed to be in traditional accounting. As such, it is not only traditional accounting that undervalues the impact of human activities on climate change but also certain sectors of soci-ety-in this instance, one that is supposedly heavily engaged with the processes of nature.
5. Conclusions
This study has sought to overcome the general failure to measure the impacts of farming on climate change by analysing the relationship between energy con-sumption and rice paddy field emissions, on the one hand, and the productivity, sales revenues and income of rice production, on the other, in a sample of farms producing gleva and bomba rice varieties. Our results reinforce the idea that the higher productivity and higher revenues per hectare achieved thanks to the in-tensive use of fossil fuels and chemical inputs are closely linked with a higher impact on climate change.
GHG emissions per hectare were consistently higher in the case of farms pre-senting above median economic indicators for both rice varieties farmed con-ventionally, while they were substantially lower in the case of the organic farm. As such, our results suggest that a better economic performance in conventional farming is achieved at the expense of a greater impact on climate change.
Energy consumption has been analysed in terms of both direct and indirect energy sources. The latter enables us to assess the energy accumulated in the stages prior to actual rice production. It was found to be substantially higher than direct energy consumption in all the conventional farms and higher for farms with an above median economic performance. Here again the organic farm presents more environmentally friendly results with lower energy con-sumption values. This means that conventional farms achieve higher productiv-ity and profitabilproductiv-ity at the cost of overusing energy sources and, therefore, of an increased ecological footprint.
The ratios between environmental and economic performance confirm that a higher environmental impact in terms of climate change is associated with a better economic performance. In producing one kg of rice, the less productive farms required less energy and were responsible for lower rates of emissions, a relationship that was stronger in the case of energy consumption than it was for GHG emissions. This might be attributable to the fact that methane emissions are unrelated to output but are rather determined by the size and flooding cycles of rice fields. Increasing impacts were recorded in the case of the intensification of the use of chemical inputs, fossil fuels and land.
We have shown briefly how GHG emissions, energy consumption and eco-nomic costs can be reduced depending on the farming practises adopted, but we found that farmers were primarily interested in economic savings and less so in improving their environmental performance.
We have found some evidence that sustainability accounting may well be use-ful to fill some of the gaps in the traditional accounting framework as regards the transparency of the reporting of the environmental impact of farming. Indeed, environmental impacts and, more importantly, indirect environmental impacts are not captured by traditional accounting methods. The latter only take into consideration certain outputs that can be measured in monetary terms, over-looking those outcomes that cannot be measured and valued by the market and, thus, considered “externalities”.
If forms of capital that include clean air, clean water and jobs are valued as zero within a traditional accounting framework, a decision based on this infor-mation is unlikely to consider them important capital to be maintained. As such, traditional financial accounting does not provide accurate information to stake-holders, consumers, citizens or policy makers on their choices in relation to food production and consumption. Sustainability accounting, with its more holistic approach, could help to achieve a shift not only in production patterns but also in consumption habits and in a social awareness of the value of natural re-sources, all essential factors in the fight to reduce the environmental impact of food production.
In this research we only consider GHG emissions and energy consumption. We do not analyse other environmental impacts associated with industrial farming practices, such as water quality, loss of biodiversity and the negative impact on health, to name but a few. A further limitation is that we consider en-ergy consumption and emission levels only as far as the end of crop production. We do not analyse subsequent stages, most notably that of transportation. To be able to identify further implications and draw additional inferences, we would need to perform similar analyses with larger samples, including farms from dif-ferent countries, producing a range of difdif-ferent crops and over a longer time pe-riod so as to analyse the evolution of this relationship in the long term.
Although the findings reported here refer specifically to rice crops, we believe that our results can be extended to other crops produced under similar condi-tions of industrial farming, where an increase in productivity is achieved by em-ploying practices that do not contemplate the harm they inflict on the environ-ment. Clearly, more research is needed on other agricultural crops. Likewise, it would be interesting in future research to include not only negative but also the positive externalities of paddy fields such as water filtering and the substitution of wetlands.
Acknowledgements
I would like to express my sincere gratitude to the pre-competitive research grant awarded by University of Barcelona for funding this research. My sincere
thanks also go to Jordi Domingo for their invaluable suggestions and contribu-tions, to the Global Nature Foundation and to the Assut Foundation for making this study possible. Last but not least, I wish to express my deep gratitude to all the farmers who participated in the data collection, for sharing their knowledge and experience about farming unselfishly.
References
[1] Stern, N. (2006) What Is the Economics of Climate Change ? Review Literature and Arts of the Americas, 7, 153-157.
[2] Burritt, R.L. and Schaltegger, S. (2012) Measuring the (Un-)sustainability of Indus-trial Biomass Production and Use. Sustainability Accounting, Management and Policy Journal, 3, 109-133. https://doi.org/10.1108/20408021211282377
[3] Bebbington, J. (2001) An Account of Sustainability: Failure, Success and a Recon-ceptualization. Critical Perspectives on Accounting, 12, 557-588.
https://doi.org/10.1006/cpac.2000.0450
[4] Zamora Ramírez, C. and Gonzalez Gonzalez, J.M. (2013) Climate Change Chal-lenges to Accounting. Low Carbon Economy, 4, 25-35.
https://doi.org/10.4236/lce.2013.41003
[5] Mathews, M.R. (1995) Social and Environmental Accounting: A Practical Demon-stration of Ethical Concern? Journal of Business Ethics, 14, 663-671.
https://doi.org/10.1007/BF00871347
[6] Schaltegger, S., Burritt, R. and Petersen, H. (2003) An Introduction to Corporate Environmental Management. Striving for Sustainability. Greenleaf Publishing Li-mited, Sheffield.
[7] Goyal, P., Rahman, Z. and Kazmi, A. (2013) Corporate Sustainability Performance and Firm Performance Research: Literature Review and Future Research Agenda. Management Decision, 51, 361-379. https://doi.org/10.1108/00251741311301867 [8] Wahba, H. (2008) Does the Market Value Corporate Environmental Responsibility?
An Empirical Examination. Corporate Social Responsibility and Environmental Management, 99, 89-99.
[9] Pérez-Calderón, E., Milanés-Montero, P. and Mondéjar-Jiménez, J. (2011) Eco- Efficiency: Effects on Economics and Financial Performance. Evidences from Dow Jones Sustainability Europe Index. Environmental Engineering and Management Journal, 10, 1801-1808.
[10] Rassier, D.G. and Earnhart, D. (2009) Does the Porter Hypothesis Explain Expected Future Financial Performance? The Effect of Clean Water Regulation on Chemical Manufacturing Firms. Environmental and Resource Economics, 45, 353-377. https://doi.org/10.1007/s10640-009-9318-0
[11] Jacobs, B.W., Singhal, V.R. and Subramanian, R. (2010) An Empirical Investigation of Environmental Performance and the Market Value of the Firm. Journal of Oper-ations Management, 28, 430-441. https://doi.org/10.1016/j.jom.2010.01.001 [12] Reilly, J.M. (2012) Green Growth and the Efficient Use of Natural Resources.
Ener-gy Economics, 34, S85-S93. https://doi.org/10.1016/j.eneco.2012.08.033
[13] Déjean, F. and Martinez, I. (2009) Environmental Disclosure and the Cost of Equi-ty: The French Case. Accounting in Europe, 6, 57-80.
https://doi.org/10.1080/17449480902896403
[14] Cho, C.H. and Roberts, R.W. (2010) Environmental Reporting on the Internet by America’s Toxic 100: Legitimacy and Self-Presentation. International Journal of
Accounting Information Systems, 11, 1-16. https://doi.org/10.1016/j.accinf.2009.12.003
[15] De Ponti, T., Rijk, B. and Van Ittersum, M.K. (2012) The Crop Yield Gap between Organic and Conventional Agriculture. Agricultural Systems, 108, 1-9.
https://doi.org/10.1016/j.agsy.2011.12.004
[16] Mekhilef, S., Faramarzi, S.Z., Saidur, R. and Salam, Z. (2013) The Application of Solar Technologies for Sustainable Development of Agricultural Sector. Renewable and Sustainable Energy Reviews, 18, 583-594.
https://doi.org/10.1016/j.rser.2012.10.049
[17] Stavi, I. and Lal, R. (2013) Agriculture and Greenhouse Gases, a Common Tragedy. A Review. Agronomy for Sustainable Development, 33, 15.
https://doi.org/10.1007/s13593-012-0110-0
[18] OECD (2001) Environmental Indicators for Agriculture. Methods and Results. Pol-icy. OECD Publishing, Paris.
[19] Pimentel, D., Hepperly, P., Hanson, J., Douds, D. and Seidel, R. (2005) Environ-mental, Energetic, and Economic Comparisons of Organic and Conventional Farming Systems. Bioscience, 55, 573-582.
https://doi.org/10.1641/0006-3568(2005)055[0573:EEAECO]2.0.CO;2
[20] Pimentel, D. and Burgess, M. (2012) Small Amounts of Pesticides Reaching Target Insects. Environment, Development and Sustainability, 14, 1-2.
https://doi.org/10.1007/s10668-011-9325-5
[21] Mondelaers, K., Aertsens, J. and van Huylenbroeck, G. (2009) A Meta-Analysis of the Differences in Environmental Impacts between Organic and Conventional Farming. British Food Journal, 111, 1098-1119.
https://doi.org/10.1108/00070700910992925
[22] OECD (2012) Water Quality and Agriculture: Meeting the Policy Challenge, OECD Studies on Water. OECD Publishing, Paris.
[23] Anielski, M., Griffiths, M. and Wilson, S. (2002) The Alberta GPI Accounts: Agri-culture. The Pembina Institute, Alberta, 55.
http://pubs.pembina.org/reports/19_agriculture.pdf
[24] Godfray, H.C.J., Beddington, J.R., Crute, I.R., Haddad, L., Lawrence, D., Muir, J.F., Pretty, J., et al. (2010) Food Security: The Challenge of Feeding 9 Billion People. Science, 327, 812-818. https://doi.org/10.1126/science.1185383
[25] Bebbington, J., Brown, J. and Frame, B. (2006) Accounting Technologies and Sus-tainability Assessment Models. Ecological Economics, 61, 224-236.
https://doi.org/10.1016/j.ecolecon.2006.10.021
[26] Larrinaga-Gonzélez, C. and Pérez-Chamorro, V. (2008) Sustainability Accounting and Accountability in Public Water Companies. Public Money and Management, 28, 337-343.
[27] Stolze, M., Piorr, A., Häring, A. and Dabbert, S. (2000) The Environmental Impacts of Organic Farming in Europe. Organic Farming in Europe: Economics and Policy. Vol. 6, Department of Farm Economics, University of Hohenheim, Stuttgart, 143. [28] Koohafkan, P., Altieri, M.A. and Gimenez, E.H. (2012) Green Agriculture:
Founda-tions for Biodiverse, Resilient and Productive Agricultural Systems. International Journal of Agricultural Sustainability, 10, 61-75.
https://doi.org/10.1080/14735903.2011.610206
[29] Sipiläinen, T., Marklund, P.O. and Huhtala, A. (2008) Efficiency in Agricultural Production of Biodiversity: Organic vs. Conventional Practices. In: 107th EAAE Seminar “Modeling of Agricultural and Rural Development Policies”, Sevilla, 29th
January-1st February 2008. http://econpapers.repec.org/paper/agseaa107/6478.htm [30] Lansink, A.O., Kyosti, P. and Backman, S. (2002) Efficiency and Productivity of
Conventional and Organic Farms in Finland 1994-1997. European Review of Agri-cultural Economics, 29, 51-65.https://doi.org/10.1093/erae/29.1.51
[31] Bickel, P. and Friedrich, R. (2005) Externe: Externalities of Energy: Methodology 2005 Update. Office for Official Publications of the European Communities, Lux-embourg.
[32] Tegtmeier, E.M. and Duffy, M.D. (2004) External Costs of Agricultural Production in the United States. International Journal of Agricultural Sustainability, 2, 1-20. https://doi.org/10.1080/14735903.2004.9684563
[33] Pretty, J., Ball, A., Lang, T. and Morison, J. (2005) Farm Costs and Food Miles: An Assessment of the Full Cost of the UK Weekly Food Basket. Food Policy, 30, 1-19. https://doi.org/10.1016/j.foodpol.2005.02.001
[34] Calpe, C. (2006) Rice International Commodity Profile. Food and Agricultural Or-ganization of the United Nations, Rome.
http://www.fao.org/fileadmin/templates/est/COMM_MARKETS_MONITORING/ Rice/Documents/Rice_Profile_Dec-06.pdf
[35] MAGRAMA (2013) Arroz en España. Cultivos herbáceos e industriales.
http://www.magrama.gob.es/es/agricultura/temas/producciones-agricolas/cultivos-herbaceos/arroz/
[36] United Nations (1998) Kyoto Protocol to the United Nations Framework Conven-tion on Climate Change. http://unfccc.int/kyoto_protocol/items/2830.php [37] Lueck, D. and Allen, D. (1998) The Nature of the Farm. Journal of Law and
Eco-nomics, 41, 343-386.
[38] Schmitt, G. (1997) Opportunity Costs of Farm Family Labour and Optimal Farm Size. Berichte über Landwirtschaft, 75, 35-65.
[39] Bakam, I., Balana, B.B. and Matthews, R. (2012) Cost-Effectiveness Analysis of Pol-icy Instruments for Greenhouse Gas Emission Mitigation in the Agricultural Sector. Journal of Environmental Management, 112, 33-44.
https://doi.org/10.1016/j.jenvman.2012.07.001
[40] World Business Council for Sustainable Development, & World Resources Institute (2001) The Greenhouse Gas Protocol: A Corporate Accounting and Reporting Standard. World Resources Inst.
http://www.ghgprotocol.org/standards/corporate-standard
[41] Elphick, C.S. (2000) Functional Equivalency between Rice Fields and Semi-Natural Wetlands Habitats. Conservation Biology, 14, 181-191.
https://doi.org/10.1046/j.1523-1739.2000.98314.x
[42] Life + 09 ENV/ES/000441, 2013—Project of the European Commission.
[43] ISO (2006) ISO 14064-1: Greenhouse Gases—Part 1: Specification with Guidance at the Organization Level for Quantification and Reporting of Greenhouse Gas Emis-sions and Removals.
[44] WRI (2012) Greenhouse Gases Protocol. World Resources Institute. http://www.ghgprotocol.org/about-ghgp
Submit or recommend next manuscript to SCIRP and we will provide best service for you:
Accepting pre-submission inquiries through Email, Facebook, LinkedIn, Twitter, etc. A wide selection of journals (inclusive of 9 subjects, more than 200 journals)
Providing 24-hour high-quality service User-friendly online submission system Fair and swift peer-review system
Efficient typesetting and proofreading procedure
Display of the result of downloads and visits, as well as the number of cited articles Maximum dissemination of your research work
Submit your manuscript at: http://papersubmission.scirp.org/ Or contact [email protected]