Full Terms & Conditions of access and use can be found at
http://www.tandfonline.com/action/journalInformation?journalCode=clar20
Download by: [CRA] Date: 02 September 2017, At: 07:39
Landscape Research
ISSN: 0142-6397 (Print) 1469-9710 (Online) Journal homepage: http://www.tandfonline.com/loi/clar20
Peri-urban agriculture in Barcelona: outlining
landscape dynamics vis à vis socio-environmental
functions
Pere Serra , David Saurí & Luca Salvati
To cite this article: Pere Serra , David Saurí & Luca Salvati (2017): Peri-urban agriculture in Barcelona: outlining landscape dynamics vis à vis socio-environmental functions, Landscape Research, DOI: 10.1080/01426397.2017.1336758
To link to this article: http://dx.doi.org/10.1080/01426397.2017.1336758
© 2017 The Author(s). Published by Informa UK Limited, trading as Taylor & Francis Group
Published online: 10 Jul 2017.
Submit your article to this journal
Article views: 152
View related articles
Peri-urban agriculture in Barcelona: outlining landscape dynamics
vis à vis socio-environmental functions
Pere Serraa , David Sauríb and Luca Salvatic
aGrumets Research Group, department of Geography, Universitat autònoma de Barcelona, edifici B, campus de la UaB, Barcelona, spain; bGRaTs Research Group, department of Geography, Universitat autònoma de Barcelona, edifici B, campus de la UaB, Barcelona, spain; ccouncil for agricultural Research and economics (cRea), Rome, Italy
ABSTRACT
Dispersed urbanisation promotes complex relationships between rural areas and the urban fringe, with emerging new functions for peri-urban agriculture (PUA). Although PUA is a type of productive farming of interest for urban planning due to its recognised functions, comparative analyses are needed to relate farm dynamics to fringe landscape modifications in different socio-economic contexts. Given the current limitation of specific methodologies to analyse PUA dynamics, a quantitative approach profiling farm types and the related landscape structure in an expanding urban region, the Metropolitan Area of Barcelona, is proposed. Results indicate that PUA is based on five typologies with different territorial values, as a consequence of diverse economic relevance, socio-environmental weight and landscape prominence. Based on these results, a conservation strategy aimed at preserving the residual PUA landscape is proposed through the promotion of a polycentric functional network of farming with natural vegetation.
1. Introduction
In recent decades, most countries in the world have experienced, to differing degrees, intense urbanisation processes in which former city limits have been surpassed and built-up areas, often discontinuous and dispersed, have expanded into the countryside. This process has generated considerable environmental impacts, the most severe being soil degradation and direct physical soil loss, including fertile agricultural soils (Zasada, 2011 or Salvati, 2013, among others).
In Europe, urbanisation has consumed green open spaces and agricultural land (European Environment Agency [EEA], 2006; Serra, Vera, Tulla, & Salvati, 2014). With the urban expansion based on dispersed settlement away from central urban areas or urban sprawl (Catalán, Sauri, & Serra, 2008), the traditional, clear cut division between urban and rural land has lost relevance, producing fragmented landscapes and transition zones between the city and the countryside with a mix of heterogeneous land-uses, including agriculture. Within this context, peri-urban agriculture (PUA) may be understood as specific farming activities developed in these transition areas. Therefore, PUA is related to the concept of ‘peri-urbanisation’ (Adell, 1999) and is geographically associated, in most cases, with urban fringes (Gallent & Shaw, 2007; Qviström & Saltzman, 2006). As Komirenko and Hoermann (2008) state, PUA refers to production units close to the city where intensive or semi-intensive commercial farms operate
KEYWORDS
Landscape dynamics; multivariate statistics; peri-urban agriculture; socio-environmental functions; Western Mediterranean
© 2017 The author(s). published by Informa UK Limited, trading as Taylor & Francis Group.
This is an Open access article distributed under the terms of the creative commons attribution-noncommercial-noderivatives License (http:// creativecommons.org/licenses/by-nc-nd/4.0/), which permits non-commercial re-use, distribution, and reproduction in any medium, provided the original work is properly cited, and is not altered, transformed, or built upon in any way.
CONTACT pere serra [email protected]
OPEN ACCESS
specialising in horticulture, livestock, fodder/milk production and forestry. These activities differ from strict urban agriculture, which has an intra-urban location and is mainly developed for aesthetic, social and recreational purposes.
The competition for land is, perhaps, one of the main issues involving PUA and, as Zasada (2011) argues, there is a strong financial incentive for farmers to sell land for purposes of urban development thus possibly exacerbating land speculation processes. For instance, in Brussels, Vandermeulen et al. (2006) pointed out that land scarcity in Flanders causes high land prices and rivalry for open spaces among different competing functions such as urbanisation, industrial development and nature conservation.
From the point of view of landscape, intense land conversion into built-up areas causes a complex and sometimes chaotic mix of heterogeneous and fragmented land-uses hosting marginal economic activities that deteriorate the quality of the environment and weaken agricultural traditions and cultivation practices (Forman, 2008; Gallent & Andersson, 2007). At the same time, PUA is of interest for urban planning due to its recognised socio-economic, landscape and environmental functions (Bourne, Bunce, Taylor, & Luka, 2003; Montasell & Callau, 2008; Walton, 2003). Unfortunately, information gaps still exist and further analyses are needed to link farm dynamics to fringe landscape modifications in different socio-economic contexts (Lardon, Galli, Marraccini, & Bonari, 2010).
Given the limitations of the methodologies currently available to analyse PUA dynamics, the purpose of this study is to contribute to the analysis of PUA systems in developed countries by proposing a quantitative approach to profile farm types and related landscape structure in the Metropolitan Area of Barcelona (MAB), Spain. The spatial organisation of the MAB reflects compact urbanisation shifting towards urban sprawl in recent decades. This process is shared with other large world cities, such as Sydney (Buxton et al., 2006), Toronto (Bourne et al., 2003) or, more closely in historical settlement patterns, with other Mediterranean cities, such as Valencia (Miralles, 2013), Rome (Salvati, 2013), or Athens (Salvati, Sateriano, & Bajocco, 2013).
Whereas some efforts have been made to define PU typologies (e.g. in Australia, Buxton et al., 2006) or agri-landscape systems (e.g. in Tuscany, Galli, Bonari, Marraccini, & Debolini, 2010), less emphasis has been placed on creating typologies of PUA in developed countries and especially in Mediterranean countries. Our main argument is that there is not a single form of PUA but rather multiple typologies with contrasting socio-economic and environmental functions reflected in heterogeneous landscape forms and structures (Allen, 2003; Johnson, Kelleher, & Chant, 1998; Lelli, 2010). Mediterranean PUAs may include profitable commercial operations but also leisure orchards, agricultural fields, agricultural spaces included in natural protected areas and other forms with specific functions (Domene & Saurí, 2007).
Along these lines, the objective of this paper is to develop a methodology to profile distinct PUA typologies that may contribute to designing more effective measures for the conservation of agriculture-related activities under urban containment and sustainable development strategies. After a brief historical analysis of PUA in the MAB, our quantitative approach consists of three steps: (i) A multivariate statistical analysis at the municipality scale combining data from multiple sources which allowed the analysis of PUA dynamics in official statistics using, for instance, population data or number of farms (Bourne et al., 2003; Walton, 2003). (ii) A quantitative landscape structure and composition analysis based on selected spatial metrics of land use, with the objective to verify land cover and landscape changes and the distinctive fragmentation of former rural lands (Low Choy & Buxton, 2011). (iii) The characterisation of homogeneous agricultural typologies according to the following specific indicators: socio-demographic profile of farmers, economic viability, socio-environmental functions and landscape preservation. Finally, a discussion of the role of PUA in providing landscape connectivity in the MAB is incorporated and developed into a strategic proposal.
2. Study area
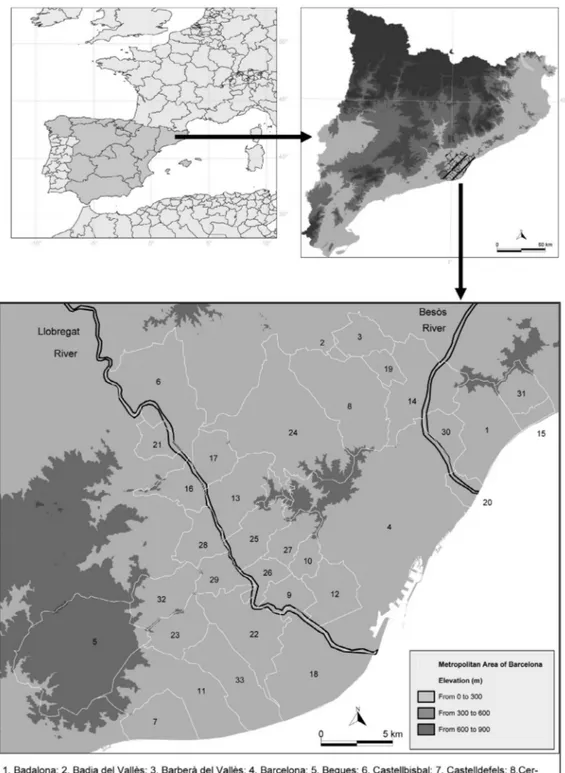
The study area includes 33 municipalities of the now extinct EAMAB, (Environmental Authority of the MAB), covering an area of 587 km2 and a population of 3.2 million. The physical setting of this area
(Figure 1) consists of a coastal plain widening towards the West by the Llobregat river valley and delta, and towards the East by the much smaller Besòs delta, and backed by the hills of the so-called Catalan Coastal Range (maximum elevation: 600 m). Behind this coastal range lies the Vallès plain, the southern part of which belongs to the EAMAB.
The population of the EAMAB increased from 1 753 673 inhabitants in 1955 to 3 199 603 inhabitants in 2010. Population density rose from 2987 inhabitants/km2, in 1955, to 5450 inhabitants/km2 in 2010.
In parallel, between 1982 and 2009 up to 2290 farms (79% of the total) were lost. Currently, the main economic activity is the service sector, accounting for 77.4% of the total added value of the area, followed by the industrial sector with 14.1%.
2.1. Metropolitan planning
During the last 60 years, the EAMAB has suffered intense environmental pressures as a consequence of its complex and expanding spatial evolution. Between the 1950s and the 1970s, the main process was an intensive increase in population and urbanisation in the city of Barcelona and in the large centres nearby, and a proliferation of secondary residential homes in the peripheral hills. Between the 1970s and 1990s, a process of dispersion occurred. Discontinuous settlements and land fragmentation increased under the General Metropolitan Plan (GMP) of 1976, which affected 27 of the 33 EAMAB municipalities. Although the GMP included dispositions to reduce settlement expansion in non-developed areas and to diminish the areas destined for urban and industrial uses, numerous factors ranging from the suspension of the Metropolitan Government in 1987 (mainly for political reasons) to thousands of amendments to the GMP reduced its effectiveness (Ferrer, 1997).
2.2. Historical configuration of EAMAB agricultural land
The most important agricultural area in terms of land and crop production values in Barcelona has been the Llobregat lower valley and delta. This area has historically played a role of ‘breadbasket’ for the central city, providing fruits and vegetables (Deffontaines, 1949). From the mid-twentieth century onwards, the agricultural landscape of the lower Llobregat River and delta began to suffer an intense process of decline that affected dry land crops especially. During the second part of the twentieth century, agricultural land fell under the fierce competition of industrialisation, urbanisation and a number of large infrastructures (Paül & Tonts, 2005). As a consequence of the interest in preserving the productive agriculture and the ecological and cultural values of the Llobregat delta, in 1997 the Baix Llobregat agricultural park was created with the help of the European Union’s LIFE programme.
The second most important agricultural area encompasses municipalities located in the hilly peripheries surrounding the Llobregat River that maintain vineyards and dry fruit trees together with significant forest cover. In the 1960s and 1970s, land abandonment increased due to the difficulties of mechanising rural activities in small fields with steep slopes. The third most important area is the southernmost part of the Vallès plain, dominated by dry land cereals and vineyards until the phylloxera ravaged the latter in the late nineteenth century. As the area became progressively urbanised in the second half of the twentieth century, agricultural land also declined severely, with the remaining agricultural landscape dominated by cereals whereas vineyards have virtually disappeared due to urbanisation and forest expansion in the upper lands.
The fourth area corresponds to a number of residual and isolated agricultural plots located in the massif of Collserola, currently protected as part of the Collserola Natural Park. The main crops are horticulture, cereals and vineyards, currently not much more than fragmented remains of old rural settlements. During the twentieth century, cereals and garden crops largely took over the vineyards, in progressive decline until only a few decades ago. Finally, a more fragmented and discontinuous agricultural system is formed by myriad vegetable gardens and orchards found along the EAMAB river networks (Domene & Saurí, 2007).
Figure 1. study area and municipalities. source: http://www.icgc.cat/en/.
3. Materials and methods 3.1. Statistical and land-use data
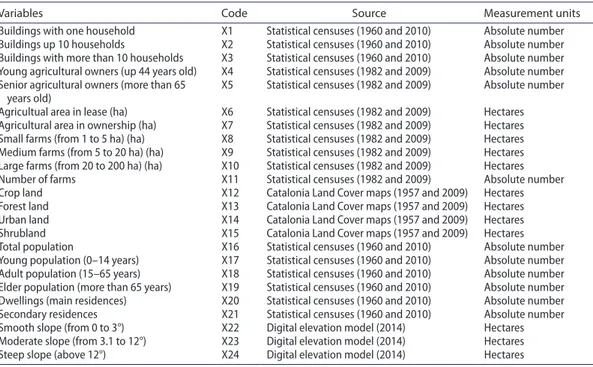
In order to assess PUA dynamics from the 33 municipalities of the EAMAB between 1960 and 2010, we quantified the following indicators: agricultural settings, population dynamics, land-use data and geographical characteristics (mainly slope) (Table 1). Demographic data were extracted from the population censuses of 1960 and 2010 produced by the Spanish National Institute of Statistics. Agricultural data were extracted from the first agricultural census providing results at municipality scale in Spain (Censo Agrario 1982) and from the last census (2009).
To analyse land-use changes, two digital land cover maps in vector format were collected: the Land Cover Map dated 1957 at 1:33 000 scale, covering the entire Barcelona province (Corina et al., 2013), and the Catalonia Land Cover Map dated 2009 at 1:2500 scale. Both maps identified land cover polygons through photo-interpretation and manual digitisation of aerial photographs developed by the same research institution (Centre de Recerca Ecològica i Aplicacions Forestals) ensuring coherent data sources. Given differences in land cover nomenclature and scales, a reclassification and a generalisation was applied in order to facilitate comparisons. Six classes were finally discriminated: water bodies, built-up areas, forests, cropland, shrub land and pastures. Finally, a last variable used as geographical restraint, slope, was calculated from a digital elevation model with a pixel size of 15 × 15 m provided by the Cartographic Institute of Catalonia. With the overlay of land-use data and slope, both in raster format, with the vector boundaries of municipalities, the area of occupation (in hectares) of them inside each municipality was quantified (Serra, Vera, & Tulla, 2013)
An exploratory multivariate data analysis was subsequently performed to identify latent relationships between the 24 original variables over time (1960–2010) and space (at municipality scale). The objective of a combined analysis of socio-economic, land-use and geographical data was achieved with a significant data reduction using principal component analysis (PCA). The extraction of principal components (PC) was developed according to the eigenvalue criterion (usually >1); two tests were used to calculate the global correlation of the 24 original variables: the Kaiser Meyer Olkin (KMO) and
Table 1. Variables and their sources included in the multivariate statistical analysis.
Variables Code Source Measurement units
Buildings with one household X1 statistical censuses (1960 and 2010) absolute number
Buildings up 10 households X2 statistical censuses (1960 and 2010) absolute number
Buildings with more than 10 households X3 statistical censuses (1960 and 2010) absolute number Young agricultural owners (up 44 years old) X4 statistical censuses (1982 and 2009) absolute number senior agricultural owners (more than 65
years old) X5 statistical censuses (1982 and 2009) absolute number
agricultual area in lease (ha) X6 statistical censuses (1982 and 2009) hectares agricultural area in ownership (ha) X7 statistical censuses (1982 and 2009) hectares small farms (from 1 to 5 ha) (ha) X8 statistical censuses (1982 and 2009) hectares Medium farms (from 5 to 20 ha) (ha) X9 statistical censuses (1982 and 2009) hectares Large farms (from 20 to 200 ha) (ha) X10 statistical censuses (1982 and 2009) hectares
number of farms X11 statistical censuses (1982 and 2009) absolute number
crop land X12 catalonia Land cover maps (1957 and 2009) hectares
Forest land X13 catalonia Land cover maps (1957 and 2009) hectares
Urban land X14 catalonia Land cover maps (1957 and 2009) hectares
shrubland X15 catalonia Land cover maps (1957 and 2009) hectares
Total population X16 statistical censuses (1960 and 2010) absolute number
Young population (0–14 years) X17 statistical censuses (1960 and 2010) absolute number adult population (15–65 years) X18 statistical censuses (1960 and 2010) absolute number elder population (more than 65 years) X19 statistical censuses (1960 and 2010) absolute number dwellings (main residences) X20 statistical censuses (1960 and 2010) absolute number
secondary residences X21 statistical censuses (1960 and 2010) absolute number
smooth slope (from 0 to 3°) X22 digital elevation model (2014) hectares
Moderate slope (from 3.1 to 12°) X23 digital elevation model (2014) hectares
steep slope (above 12°) X24 digital elevation model (2014) hectares
the communality, the proportion of variance among the original variables explained by the selected PC (Norušis, 1994). The final matrix was rotated using the Varimax rotation, to obtain loadings easier to interpret, and the final values for each PC and municipality using the score coefficients were calculated. Lastly, to avoid using incomparable factors obtained for each of the years analysed, the method from Serra et al. (2013) was adopted, which applies the PC score coefficients from the first year analysed (2010) to the standardised originals variables of the following year (1960). This option provided fully comparable outcomes because the changes in the final PC values were due to the changes in the original variables and not attributable to the 1960 PC score coefficients because they were constant.
The next step was to identify landscape dynamics using land cover data. As Aguilera, Valenzuela, and Botequilha-Leitão (2011) argue, there is a need to explore the application of spatial metrics to Mediterranean cities given their unique morphological characteristics and the land-use changes that they have been experiencing in recent years. To examine landscape dynamics at class level, six landscape metrics assessing class structure, configuration and shape complexity were calculated and compared between years. Metrics included the number of patches, the mean patch size and the patch size coefficient of variation (patch size standard deviation divided by mean patch size) to analyse class structure; the edge density (sum of perimeter for a class divided by total landscape in metres/hectare) and the mean patch edge (perimeter of patches divided by the number of patches in metres/patch) were considered to analyse class configuration. Finally, the mean perimeter-area ratio (sum of each patch perimeter/area ratio divided by the number of patches in metres/hectare) was calculated as a proxy for shape complexity (McGarigal, Cushman, & Ene, 2012).
3.2. Profiling PUA typologies
Currently, no specific methodology is available to study PUA typologies and dynamics for the EAMAB. To fill this gap, some of the criteria used by Moissidis and Duquenne (1997) to discriminate farm typologies were considered. According to available data, various key indicators were incorporated including chief types of agricultural activity, plot size, demographic profiles, irrigation or dry systems, socio-economic viability, market orientation, level of environmental protection, socio-environmental functions and landscape preservation. A score was assigned to each indicator and PUA typology with the objective to identify the final territorial value obtained from the sum of the partial scores. Scores were scaled based on the following criteria: professional farmers had the maximum rating because they can generate employment and income while avoiding the marginalisation and final abandonment of agriculture. A decreasing score was applied from this profile down to the lowest score, assigned to retired people with no economic activity. According to socio-economic viability and market orientation, professional farmers received the highest score, following the same criterion as in the socio-demographic profile. In the case of protection level and future perspectives, the highest value corresponded to farming included in protected areas, and the lowest to farming with very uncertain perspectives. Finally, given that the socio-environmental functions and landscape preservation criteria were comparable in the EAMAB, the score was similar in all the cases with the exception of marginal orchards, due to their small plot size and often marginal landscape value.
4. Results
4.1. Spatial configuration at municipality scale
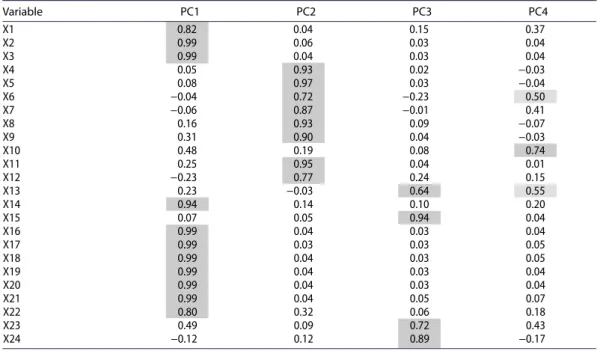
At the municipality scale, PCA results for 2010 showed a KMO value of 0.7 and all the communalities values were above 0.72. Four PC were retained, according to the eigenvalue criterion, with 91.1% of total variance explained. Table 2 shows the factor loadings. The first PC, with 45.3% of variance explained, was labelled as ‘urban’ due to the high loadings from buildings per household, urban land, total population, population by age, main and secondary residences and smooth slope. The second PC, with 27% of variance explained, was labelled as ‘agriculture with small and medium farming size’ due to the high
loadings from agricultural owners by age, agricultural area in lease and ownership, small and medium farms, number of farms and crop land. The third PC, with 11.6% of variance explained, was labelled as ‘forest’ due to the high loadings from forest, shrub land and moderate and steep slopes. Finally, the fourth PC, with 7.2% of variance explained, was labelled as ‘big farming’ due to the high loading with farmers and medium loadings with leased agricultural area and forest land.
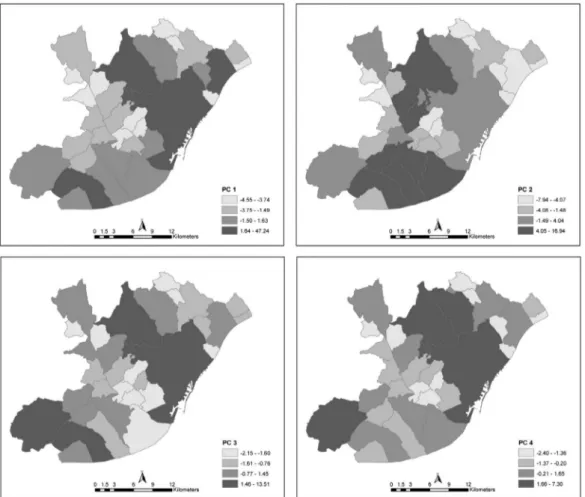
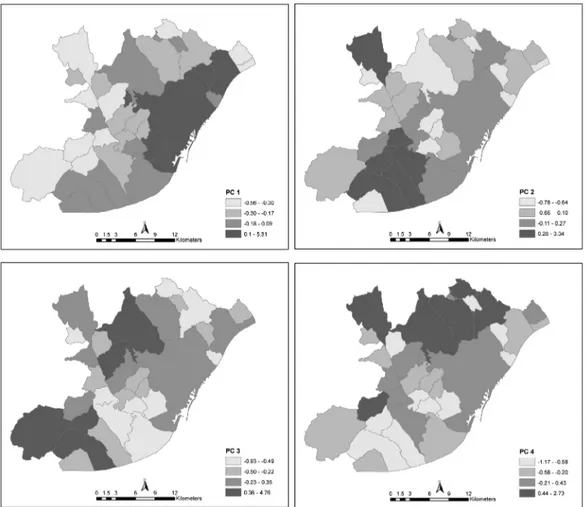
Figures 2 and 3 show the PC results at municipality scale for 1960 and 2010, respectively. According to these figures, the process of urban concentration (PC1) around Barcelona becomes very clear in 2010 but was less intense in 1960. In the case of agricultural dynamics (PC2), a reduction of crop land around Barcelona is clearly visible but the importance of agriculture around the Llobregat river and in the municipality of Castellbisbal was maintained in 2010. The forest component (PC3) shows the importance of Collserola and Garraf (located in the west side of the EAMAB) natural parks and agricultural abandonment whereas big farms (PC4) can be found in the northern EAMAB, clearly disappearing in the rest of municipalities.
4.2. Land cover changes
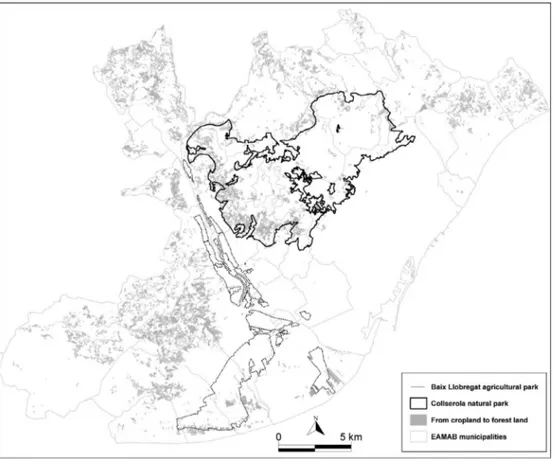
Figure 4 illustrates the spatial distribution of selected land-use classes between 1957 and 2009, showing the strong decrease in cropland, the rapid increase in urban land and the moderate expansion of forests, shrub-land and pastures. Figure 5 shows cropland distribution in 1957 and 2009. Cropland occupied 26 134 ha (44.8% of total area) in 1957 and declined to 6262 ha (10.7% of total area) in 2009. It is now concentrated around the Baix Llobregat agricultural park, and in isolated patches corresponding to municipalities that were very rural in the past. In the case of Barcelona, cropland has disappeared completely with the exception of some small agricultural patches preserved inside the protected area of the Collserola Natural Park. The loss of cropland, totaling 16 557 ha over the past 52 years, has been driven by the increasing urban intensification and sprawl. Figure 6 illustrates the distribution of cropland converted to urban land (12 812 ha), highlighting the expansion of the city towards the northeast and southwest side of the EAMAB and around the Llobregat river, whereas forested land increased at the Table 2. Results of principal components analysis (pca) at municipality scale.
note: In grey pc loadings ≥ 0.5.
source: Own elaboration from variables described in Table 1.
expense of cropland (2925.6 ha) and was concentrated around the Collserola natural park and in small areas around the Llobregat river (Figure 7).
4.3. Spatial configuration of landscape dynamics
The number of patches increased in all land-use classes, mainly in forest land and pastures, with the exception of urban areas (Figure 8(a)), the latter reduced by 115 patches. Mean patch size followed the reverse pattern, with a generalised decrease for most classes, by 10.8 ha in the case of cropland, but with the exception of shrub land, and urban land, which increased by 9.8 ha (Figure 8(b)). The coefficient of variation of patch size showed a slight increase in all classes with the exception of urban land, which experienced a pronounced decrease (Figure 8(c)). Edge density showed a strong decrease in cropland (35.6 m/ha), and a slight decrease in shrub land (1.6 m/ha), while the main increase (17.6 m/ha) was observed in forest land (Figure 8(d)). Regarding the mean patch edge (Figure 8(e)), results showed a generalised decrease for all classes (1163 m/patch in the case of cropland), with the exception of urban land (only 375 m/patch). The mean perimeter-area ratio showed an increase of 155 m/ha in the case of cropland (Figure 8(f)). As the number of cropland patches increased slightly (Figure 8(a)), the increment in this metric indicated that patches became thinner in 2009 compared with 1957. Therefore, cropland fragmentation and isolation is the main landscape transformation in Barcelona and contrasts with the evolution of urban land as it undergoes a process of patch homogenisation.
Figure 2. principal component results for 1960. source: Own elaboration from principal component analysis, http://www.icgc.cat/en/.
Figure 3. principal component results for 2010. source: Own elaboration from principal component analysis, http://www.icgc.cat/en/.
Figure 4. surface evolution (in hectares) of land cover categories from 1957 to 2009. source: Own elaboration from catalonia Land cover maps of 1957 and 2009.
4.4. Profiling PUA typologies
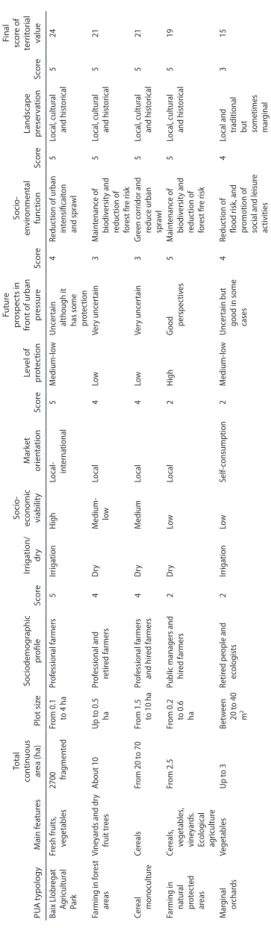
Five distinct PUA typologies were discriminated in the EAMAB: Baix Llobregat professional farming, farming in forest areas, cereal monoculture systems, farming in protected areas and marginal orchards. Figure 9 shows spatial locations and Table 3 the scores with final territorial values.
4.4.1. Baix Llobregat professional farming
The largest area of continuous PUA corresponds to the Baix Llobregat agricultural park, where professional farmers cultivate vegetables and fruit products for the Barcelona market and for large commercial distribution chains (Table 3). Average field size is about 3 or 4 ha, occupied mostly with irrigated crops (Figure 9(a)), of high economic viability. Although the area includes an agricultural park, the protection level is medium-to-low because urban pressures are still high. A recent example of such pressures was the so-called EuroVegas project promoted by the Las Vegas Sands Corporation in 2011, and that involved massive land development inside the park with the construction up to 800 ha of hotels, golf courses and casinos for thousands of visitors. This proposal was cancelled for diverse reasons but, as the Fundació Agroterritori (2012) observed, the preservation of agricultural area was probably not one of them. For these reasons, together with the lack of generational replacement among farmers, the future of this area remains uncertain (Montasell & Callau, 2008).
From a socio-environmental point of view, the Baix Llobregat agricultural park may contribute to containing Barcelona’s sprawl, becoming in this sense an important and strategic open space. From a landscape point of view, although some plots may be covered by car warehouses and scrap metal Figure 5. cropland evolution from 1957 to 2009. source: Own elaboration from catalonia Land cover maps of 1957 and 2009, http:// www.icgc.cat/en/.
or rubbish tips, they maintain the traditional and cultural agricultural milieu with methods such as the estanyar, in which fields are flooded for several weeks to wash away soil salt and to minimise the occurrence of animal plagues (personal communication from park managers, February 2013). For all these reasons, the final score given to this PUA typology was the highest.
4.4.2. Farming in forest areas
Vineyards and non-irrigated fruit trees (mainly plum trees) were discriminated in forest areas. Currently, the maximum continuous area that they cover is about 10 ha, with field size averaging 0.5 ha, very atomised (Figure 9(b)). The socio-economic viability is medium-to-low because market competition is high, especially concerning production costs (Table 3). As a consequence, farmers sell their produce directly in the local markets of Barcelona. The level of protection is low and the future prospect is uncertain due to the pressures of urbanisation. Moreover, agricultural abandonment may follow, owing to farmers’ ageing (according to the Agrarian Census of 2009, 60% of farm owners in the Baix Llobregat were 55 or older) and the lack of generational replacement. The main socio-environmental function of this PUA typology is the maintenance of biodiversity and of the typical agrarian landscape in forest areas, mainly in terraces, and the mitigation of forest fires. In consequence, its final score was high.
4.4.3. Cereal monoculture
Cereal cropping areas managed by professional and hired farmers are now only remnant patches of the extensive dry cereal fields cultivated prior to Barcelona’s urban expansion in the Vallès (Figure
9(c)). The characteristic field size ranges from 1.5 to 10 ha, and the production is mainly addressed to local markets (Table 3). In general, the economic viability of dry cereals is lower than that of irrigated Figure 6. Urban land increase in detriment of cropland, from 1957 to 2009. source: Own elaboration from catalonia Land cover maps of 1957 and 2009, http://www.icgc.cat/en/.
crops, the level of protection is low and the future prospect is very uncertain because urban pressure is extremely high. The main socio-environmental function of winter cereals is to act as green corridors between the Collserola Natural Park and the Vallès plain, preserving at the same time the traditional landscape of dryland agriculture (www.viaverda.org). As Pino and Marull assert (2012), crops are not only important for the conservation of biodiversity but also for landscape dynamics at regional scale. For all these reasons the final score for this typology was high.
4.4.4. Farming in natural protected areas
This PUA typology includes the very small areas cultivated with vegetables, cereals and vineyards inside the Collserola Natural Park. These areas are associated with traditional farms surrounded by forest land, with field sizes of less than one hectare. In the case of vineyards (Figure 9(d)), the economic viability is low because they are not cultivated to obtain economic benefits but rather to ensure socio-environmental functions (Table 3).Public servants and hired farmers manage these crops, and the wine produced is served at official events under the Barcelona trademark. Because these fields are inside the protected area, the level of protection is high. Their importance lies in their role of preventing (forest) landscape homogenisation, increasing biodiversity and reducing forest fire risk. The maintenance of fields and experimental plots of public land aims at improving wildlife and maintaining traditional varieties in the park. For all these reasons the final score was high.
Figure 7. Increase of forest land in detriment of cropland, between 1957 and 2009. source: Own elaboration from catalonia Land cover maps of 1957 and 2009, http://www.icgc.cat/en/.
4.4.5. Marginal orchards
Peri-urban orchards, the last PUA typology, are located along or near metropolitan streams mainly in marginal open spaces with fertile soil and a high demand for leisure gardening. According to Domene and Saurí (2007), contingent reasons recently produced a renewed interest towards such a typology: the arrival of migratory waves to Catalonia from agricultural areas of southern Spain in the 1960s onwards, the urban concentration in the 1970s, the lack of public spaces and the low incomes of some social groups.
An example of marginal orchards is shown in Figure 9(e), which corresponds to a PUA located in the municipality of Cerdanyola del Vallès. It occupies 2.96 ha of public land managed by local government, including 69 plots with an average size of 330 m2 and employing 75 ‘farmers’. This PUA provides multiple
socio-economic functions such as production for self-consumption and occasional marketing, and social uses, such as leisure, educational and aesthetic functions (Table 3). The main group of ‘farmers’ includes retired people, in some cases with rural roots, and this practice may be associated with sustainable Figure 8. Results of landscape dynamics, from 1957 to 2009. (a) number of patches. (b) Mean patch size (in ha). (c) coefficient of variation of patch size (in ha). (d) edge density (in m/ha). (e) Mean patch edge (in m/patch). (f) Mean perimeter-area ratio (in m/ha). source: Own elaboration from catalonia Land cover maps of 1957 and 2009.
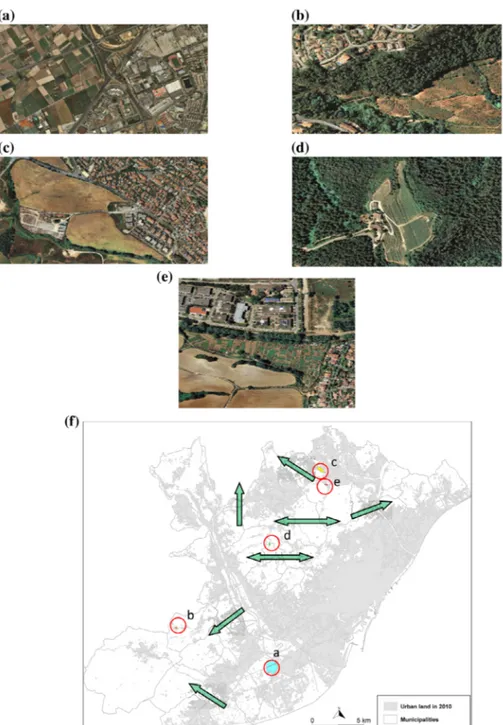
Figure 9. Fragments of ortophotos representative of each pUa typology. source: http://www.icgc.cat/en/.
notes: Figure 9(a). a section of the Baix Llobregat agricultural park, between el prat del Llobregat and sant Boi de Llobregat. Figure 9(b). an example of dry plum trees in a forest area. Figure 9(c). an example of cereal fields close to cerdanyola del Vallès city. Figure 9(d). an example of vineyard fields in collserola natural park. Figure 9(e). an example of marginal orchards in cerdanyola del Vallès municipality. source: Institut cartogràfic i Geològic de catalunya (IcGc). Figure 9(f). Map of the final proposal: polycentric functional network of the five pUa typologies integrating with corridors (forest and agriculture land). priority places to consider in the proposal are indicated by arrows. Location of each pUa typology fragment shown above (a, b, c, d and e) is highlighted. source: own elaboration.
Table 3. char ac terisa tion and sc oring of pU a t ypolog ies . sour ce: O wn elabor ation fr om hist orical pr oc esses , c ensus da ta and spa tial analy sis . PU A t ypology M ain f ea tur es Total con tinuous ar ea (ha) Plot siz e Sociodemog raphic pr ofile Sc ore Irr iga tion/ dr y Socio -ec onomic viabilit y M ar ket or ien ta tion Sc ore Lev el of pr ot ec tion Futur e pr ospec ts in fr on t of ur ban pr essur e Sc ore Socio -en vir onmen tal func tion Sc ore Landscape preser va tion Sc ore Final score of ter rit or ial value Baix Llobr ega t ag ricultur al park Fr esh fruits , vegetables 2700 fr ag men ted Fr om 0.1 to 4 ha pr of essional farmers 5 Irriga tion h igh Local- in terna tional 5 M edium-lo w Unc er tain
although it has some prot
ec tion 4 Reduc tion of urban in tensificait on and spr awl 5 Local , cultur al and hist orical 5 24 Farming in f or est ar eas Viney ar ds and dr y fruit tr ees about 10 Up t o 0.5 ha pr of
essional and retired farmers
4 d ry M edium- low Local 4 Lo w Ver y unc er tain 3 M ain tenanc e of biodiv ersit y and reduc tion of for est fir e risk 5 Local , cultur al and hist orical 5 21 cer eal monocultur e cer eals Fr om 20 t o 70 Fr om 1.5 to 10 ha pr of
essional farmers and hir
ed farmers 4 d ry M edium Local 4 Lo w Ver y unc er tain 3 Gr een c orridor and reduc e urban spr awl 5 Local , cultur al and hist orical 5 21 Farming in na tur al pr ot ec ted ar eas cer eals , vegetables , viney ar ds . ec olog ical ag ricultur e Fr om 2.5 Fr om 0.2 to 0.6 ha public managers and hir
ed farmers 2 d ry Lo w Local 2 h igh G ood perspec tiv es 5 M ain tenanc e of biodiv ersit y and reduc tion of for est fir e risk 5 Local , cultur al and hist orical 5 19 M ar ginal orchar ds Vegetables Up t o 3 Bet w een 20 t o 40 m 2 Retir ed people and ec olog ists 2 Irriga tion Lo w self-consumption 2 M edium-lo w Unc er tain but
good in some cases
4 Reduc tion of flood risk , and pr omotion of
social and leisur
e
ac
tivities
4
Local and tr aditional but sometimes marginal
3
15
development, self-sufficiency consumption and respect for nature. For all these reasons the final score was fairly high but limited by its spatial specificity.
5. Discussion
Our approach linked farm dynamics and fringe landscape modifications to improve the study of PUA systems in southern European metropolitan areas. This approach may be also easy to use in other study areas because primary data relies on official statistics and land-use maps. Apart from the lack, in our study area, of stable census data of crop types, the main shortcoming of the methodology may be the long-term temporal analysis. Comparing the same data across distant years, 50 years in our case, requires access to information that may be impossible to achieve due to the deficiency of consistent censuses or the lack of high resolution aerial photographs or other sources to extract land-uses. For example, in Díaz-Palacios, Ayuga, and García (2014) the temporal analysis was limited to 16 years because they used the CORINE (CoORdination of Information on the Environment) Land Cover Project Database, available only from 1990 to 2006.
In contrast to the PU perspective of other studies, we emphasised the analysis from the PUA point of view, a less common perspective. Given this approach, instead of highlighting the population and mobility changes (Bourne et al., 2003; García-Palomares, 2010), we focussed on population and land-use modifications, adding the exploration of landscape transformations and the resulting PUA typologies. One possible drawback of this approach is the discretionary decisions that must be made to weight PUA typologies. For example, in the case of the socio-demographic profile our main criterion was to identify professional farmers with the highest scores given their major strength in terms of employment and income. This is a decision that could be debatable. The justification for such point of view is that one of the best ways to protect agricultural land is to avoid a decline in farm incomes and, in consequence, a decrease in the number of professional farmers (Bourne et al., 2003).
According to our results, the reduction of cultivated land in the EAMAB has exceeded 26 000 ha during the last 55 years, owing to urban growth and, to a lesser extent, forest expansion. This outcome is similar to the results presented by Catalán et al. (2008) for the larger Barcelona Metropolitan Region (BMR) or reported by Corina et al. (2013), who analysed the BMR landscape between 1957 and 2000, concluding that urbanisation mainly occurred at the cost of arable land.
From the landscape point of view, cropland in the EAMAB has become more fragmented and isolated. Our results also suggest that in the case of forest land the number of patches increased, as a consequence of crop land abandonment, but the mean path size decreased as a consequence of the pressures posed by infrastructures. This was previously described by Marull and Mallarach (2005) in the case of the Collserola Natural Park, which is becoming an isolated, ecological island surrounded by urban, industrial, commercial areas and dense highways. Similar processes have been detected in other European metropolitan areas, such as Athens (Salvati et al., 2013) or Madrid (Díaz-Palacios et al.,
2014) or other world metropolitan areas, such as Toronto, where protection of contiguous agricultural areas has been recommended to prevent fragmentation (Walton, 2003). Therefore, agricultural habitats need to be considered equally as relevant as open natural and semi-natural habitats for conservation matters that contribute to regional landscape functions and ecosystem services (Corina et al., 2013). In this sense, agricultural areas can play complementary roles to crop-forest mosaics and help to maintain biodiversity components on a regional scale, increasing landscape heterogeneity (Pino & Marull, 2012). The Baix Llobregat agricultural park is the main agricultural area near Barcelona with some spatial continuity. It requires effective protection policies because of its strategic economic, social and environmental functions. For instance, irrigation allows the natural recharge of the delta aquifer and attenuates the risk of flooding. Moreover, farmers offer fresh, high-quality products such as artichokes and chickens that bear the European Protected Geographical Indication (Montasell & Callau, 2008). The agricultural park also provides aesthetic values with diverse long-established elements such as walls, fences or irrigation canals, among others. All these observations clearly reinforce the work done in Barcelona by Forman (2008) that highlighted the major ecological and economic significance of
Baix Llobregat agricultural park and where very limited or no urban growth was critical. Due to this circumstance, similar initiatives have been developed to establish agricultural parks around metropolitan areas, such as the South Milan Agricultural Park in Italy, created in 1990 and involving 61 municipalities and 47 000 ha, or the 800-ha Fuenlabrada Agrarian Park in Madrid, Spain, created in 2013.
Farming in forest areas can restrain urban growth and maintain biodiversity together with agricultural heritage and traditional landscapes. In contrast, woodland homogeneity opens the way for potentially devastating scenarios in the case of forest fires that can destroy an important part of the wooded area and create a landscape dominated by shrub land, which in steep slopes can be more prone to soil degradation (Serra, Pons, & Saurí, 2008).
The Vallès cereal monoculture acts as a barrier for urban and industrial development. At the same time, such agricultural activity maintains ecological connectivity in the Vallès plain and preserves traditional agricultural mosaic landscapes. Agricultural activity in protected areas occupies small parts of the EAMAB open spaces but preserves an agro-forest mosaic with high biodiversity. Agriculture in these areas includes rural heritage sites and in the case of wine production it is exclusively used for non-commercial purposes. Finally, marginal orchards, characterised by the small fields and area, have critical social functions because they involve retired and environmentally conscious people.
From a planning point of view, PUA typologies need to be included in regional and local plans reconnecting agricultural and forest areas and protecting the relict, high-quality agro-forest landscape around Barcelona. In this sense, the objective of the Territorial Metropolitan Plan of Barcelona to zone non-urbanised land in two categories of protection is perhaps insufficient and should be improved. The first corresponds to the category of special protection, with natural or agrarian values and restricted development options, including the Baix Llobregat agricultural park and the Collserola natural park; the second corresponds to the category of preventive protection, having environmental or landscape values (the remainder PUA typologies included in this paper) but available for urbanisation according to municipal plans. In consequence, our proposal to provide landscape connectivity, in consonance with other proposals by Mallarach (2003), Forman (2008) or Pino and Marull (2012), suggests promoting a polycentric network of the five PUA typologies integrating and connecting with natural vegetation using corridors, as shown in Figure 9(f). This would require, for instance, the construction of passages, underpasses, or overpasses to cross major transportation arteries, among other actions, in places with lower urban settlement density as shown with arrows in Figure 9(f). In this sense, the Baix Llobregat agricultural park can connect with the Western agro-forest areas, dominated by fruit trees, whereas the farming activities in Collserola Park, together with winter cereals, can consolidate open spaces to the north of the EAMAB.
6. Conclusions
The present study has proposed a methodology to analyse PUA typologies in a Mediterranean area using three tools: a spatial analysis combining socio-economic and land-use data at municipality scale; a spatial exploration of land cover changes and landscape dynamics and a territorial scoring using some basic socio-economic and environmental indicators.
The five PUA typologies identified in this work are the remnants of historical agricultural activity that maintain a significant social, cultural and environmental heritage and that require conservation. According to our final territorial scores, the Baix Llobregat agricultural park would be the main area to protect, given its high socio-economic, environmental and traditional landscape values. The rest of the PUA typologies may be also important to maintain biodiversity and traditional landscapes, to act as green corridors and finally, to sustain social and leisure activities, among other functions. This situation increases the socio-environmental value of open spaces in general and of PUA in particular. Therefore, improved preservation is crucial in order to avoid more urban sprawl and the total disappearance of farming in the EAMAB. Our study, consequently, reinforces the idea of creating a polycentric functional ecological network of all PUA typologies integrated with natural vegetation.
Acknowledgements
The authors would like to thank Dr. Joan Pino for his support. One of the authors (LS) participated in this research during a study period at the Universitat Autònoma de Barcelona, Departament of Geography, funded by the Consiglio per la Ricerca in Agricoltura e l’Analisi dell’Economia Agraria (Italy).
Disclosure statement
No potential conflict of interest was reported by the authors. Funding
This work was supported by the Generalitat de Catalunya; Spanish Ministry of Economy and Competitiveness and the European Regional Development Fund (ERDF) [CGL2012-33927] (Acapi); Grumets Research Group [2014SGR1491]; GRATS Research Group [2014SGR351].
ORCID
Pere Serra http://orcid.org/0000-0003-1023-5586
References
Adell, G. (1999). Theories and models of the peri-urban interface: A changing conceptual landscape (pp. 1–43). London: The Development Planning Unit, University College London.
Aguilera, F., Valenzuela, L. M., & Botequilha-Leitão, A. (2011). Landscape metrics in the analysis of urban land use patterns: A case study in a Spanish metropolitan area. Landscape and Urban Planning, 99, 226–238.
Allen, A. (2003). Environmental planning and management of the peri-urban interface: Perspectives on an emerging field.
Environment and Urbanization, 15, 135–148.
Bourne, L. S., Bunce, M., Taylor, L., & Luka, N. (2003). Contested ground: The dynamics of peri-urban growth in the Toronto region. Canadian Journal of Regional Science, 26, 251–270.
Buxton, M., Tieman, G., Bekessy, S., Budge, T., Mercer, D., Coote, M., & Morcombe, J. (2006). Change and continuity in
peri-urban Australia, state of the peri-peri-urban regions: A review of the literature. Melbourne: RMIT University.
Catalán, B., Sauri, D., & Serra, P. (2008). Urban sprawl in the Mediterranean? Landscape and Urban Planning, 85, 174–184. Corina, B., Álvarez, E., Bagaria, G., Guardiola, M., Isern, R., Vicente, P., & Pino, J. (2013). Spatial patterns of land use changes
across a Mediterranean Metropolitan landscape: Implications for biodiversity management. Environmental Managament,
52, 971–980.
Deffontaines, P. (1949). Le Delta del Llobregat. Étude de géographie humaine [The Delta del Llobregat. Study of Human Geography]. Revue Géographique des Pyrénées et du Sud-Ouest, 20, 138–174.
Díaz-Palacios, S., Ayuga, F., & García, A. I. (2014). A method for detecting and describing land use transformations: An examination of Madrid’s southern urban-rural gradient between 1990 and 2006. Cities, 40, 99–110.
Domene, E., & Saurí, D. (2007). Urbanization and class-produced natures: Vegetable gardens in the Barcelona Metropolitan Region. Geoforum, 38, 287–298.
European Environment Agency. (2006). Urban sprawl in Europe. The ignored challenge (EEA Report 10). Copenhagen: Author. Ferrer, A. (1997). El Pla General Metropolità de Barcelona. La versió de 1976. Papers. Regió Metropolitana de Barcelona, 28,
43–54. [In Catalan].
Forman, R. T. T. (2008). Urban regions. Ecology and planning beyond the city. Cambridge: Cambridge University Press. Fundació Agroterritori. (2012). EuroVegas: Tha lack of protection of our agricultural space. Retrieved October, 2014, from
www.agroterritori.org
Gallent, N., & Andersson, J. (2007). Representing England’s rural-urban fringe. Landscape Research, 32, 1–21.
Gallent, N., & Shaw, D. (2007). Spatial planning, area action plans and the rural-urban fringe. Journal of Environmental
Planning and Management, 50, 617–638.
Galli, M., Bonari, E., Marraccini, E., & Debolini, M. (2010). Characterisation of agri-landscape systems at a regional level: A case study in Northern Tuscany. Italian Journal of Agronomy, 5, 285–294.
García-Palomares, J. C. (2010). Urban sprawl and travel to work: The case of the metropolitan area of Madrid. Journal of
Transport Geography, 18, 197–213.
Johnson, N. L., Kelleher, F. M., & Chant, J. J. (1998). The future of agriculture in the peri-urban fringe of Sydney. Proceedings
of the 9th Australian Agronomy Conference, Wagga Wagga, 613–616.
Komirenko, Z., & Hoermann, D. M. (2008). Urban and peri-urban agriculture in Kyiv (Ukraine): “Crisis induced strategy” versus
recreational resource (pp. 1–5). 12th Congress of the European Association of Agricultural Economists.
Lardon, S., Galli, M., Marraccini, E., & Bonari, E. (2010). Peri-urbanisation and peri-urban agriculture: Issues and proposals. In M. Galli, S. Lardon, E. Marraccini, & E. Bonari (Eds.), Agricultural management in peri-urban areas (pp. 9–24). Pisa: Felice Editore. Lelli, L. (2010). Peri-urban agricultural areas and planning. In M. Galli, S. Lardon, E. Marraccini, & E. Bonari (Eds.), Agricultural
management in peri-urban areas (pp. 83–85). Pisa: Felice Editores.
Low Choy, D. C., & Buxton, M. (2011). A resilience approach to peri-urban landscape management. In C. Whitzman & R. Fincher (Ed.), 5th State of Australian Cities Conference, Melbourne. Retrieved from http://soac.fbe.unsw.edu.au/2011/ papers.html
Mallarach, J. M. (2003). Criteria and tools for planning and managing networks of natural and rural spaces in metropolitan areas: Challenges and latest trends. III International Symposium on Metropolitan and Periurban Natural and Rural Spaces. In The system of open spaces in the articulation of metropolitan areas (pp. 165–169). Barcelona: Consorci del Parc de Collserola.
Marull, J., & Mallarach, J. M. (2005). A GIS methodology for assessing ecological connectivity: Application to the Barcelona Metropolitan Area. Landscape and Urban Planning, 71, 243–262.
McGarigal, K., Cushman, S. A., & Ene, E. (2012). FRAGSTATS v4: Spatial pattern analysis program for categorical and continuous
maps. Computer software program produced by the authors at the University of Massachusetts, Amherst. Retrieved
October, 2014, from http://www.umass.edu/landeco/research/fragstats/fragstats.html
Miralles, J. L. (2013). The planning of peri-urban agricultural areas: The case of “L’Horta de València”. In M. Schrenk, V. V. Popovich, P. Zeile, & P. Elisei (Eds.), Real Corp 2013, 8th International Conference of Urban Planning, Regional Development
and Information Society (pp. 953–962). Rome: CD-ROM.
Moissidis, A., & Duquenne, M. N. (1997). Peri-urban rural areas in Greece: The case of Attica. Sociologia Ruralis, 37, 228–239. Montasell, J., & Callau, S. (2008). The Baix Llobregat agricultural park (Barcelona): An instrument for preserving, developing and managing a periurban agricultural area. In V. Dewaelheyns & H. Gulinck (Eds.), Rurality near the city, Conference Proceedings, Leuven, 7–8th 2008 (pp. 69–74). Belgium.
Norušis, M. J. (1994). SPSS professional statistics 6.1. Chicago, IL, SPSS Inc.
Paül, V., & Tonts, M. (2005). Containing urban sprawl: Trends in land use and spatial planning in the Metropolitan Region of Barcelona. Journal of Environmental Planning and Management, 48, 7–35.
Pino, J., & Marull, J. (2012). Ecological networks: Are they enough for connectivity conservation? A case study in the Barcelona Metropolitan Region (NE Spain). Land Use Policy, 29, 684–690.
Qviström, M., & Saltzman, K. (2006). Exploring landscape dynamics at the edge of the city: Spatial plans and everyday places at the inner urban fringe of Malmö, Sweden. Landscape Research, 31, 21–41.
Salvati, L. (2013). Monitoring high-quality soil consumption driven by urban pressure in a growing city (Rome, Italy). Cities,
31, 349–356.
Salvati, L., Sateriano, A., & Bajocco, S. (2013). To grow or to sprawl? Land cover relationships in a Mediterranean city region and implications for land use management. Cities, 30, 113–121.
Serra, P., Pons, X., & Saurí, D. (2008). Land-cover and land-use change in a Mediterranean landscape: A spatial analysis of driving forces integrating biophysical and human factors. Applied Geography, 28, 189–209.
Serra, P., Vera, A., & Tulla, A. F. (2013). Spatial and socioenvironmental dynamics of Catalan Regional Planning from a multivariate statistical analysis using 1980s and 2000s data. European Planning Studies, 22, 1280–1300.
Serra, P., Vera, A., Tulla, A. F., & Salvati, L. (2014). Beyond urban-rural dichotomy: Exploring socioeconomic and land-use processes of change in Spain (1991–2011). Applied Geography, 55, 71–81.
Vandermeulen, V., Verspecht, A., van Huylenbroeck, G., Meert, H., Boulanger, A., & van Hecke, E. (2006). The importance of the institutional environment on multifunctional farming systems in the peri-urban area of Brussels. Land Use Policy,
23, 486–501.
Walton, M. (2003). Agriculture in the central Ontario zone. Issue paper nº1. Toronto, Neptis Foundation.
Zasada, I. (2011). Multifunctional peri-urban agriculture—A review of societal demands and the provision of goods and services by farming. Land Use Policy, 28, 639–648.