International PhD program in Cardiovascular Pathophysiology and Therapeutics
New perspectives in percutaneous coronary
intervention based on an integrated
approach of imaging and physiology
PhD thesis
New perspectives in percutaneous coronary
intervention based on an integrated
approach of imaging and physiology
PhD thesis
Mariano Pellicano MD, MSc
28/09/1981 Cosenza (Italy)
Promotor: Prof. Bernard De Bruyne
Cardiovascular Center Aalst, OLV Clinic, Aalst, Belgium Co-promotor: Prof. Tullio Tesorio
Montevergine Clinic, Mercogliano (AV), Italy
Naples, 21/01/2019
University Federico II of Naples, Faculty of Medicine, Via Pansini n. 5, 80131 Naples, Italy
"The real voyage of discovery consists not in seeking new lands but seeing with new eyes"
1
Contents
Chapter 1. General introduction and outline of the thesis pag. 7
Part I. From pressure derived-FFR to Absolute Flow
and Microvascular Resistance
Chapter 2. Standardization of Fractional Flow Reserve Measurements.
Published in J Am Coll Cardiol 2016 Aug 16;68(7):742-53.
pag. 15
Chapter 3. Intracoronary Adenosine: Dose-Response Relationship With Hyperemia.
Published in JACC Cardiovascular Interventions 2015 Sep;8(11):1422-30.
pag. 18
Chapter 4. Saline-Induced Coronary Hyperemia: Mechanisms and Effects on Left Ventricular Function.
Published in Circulation: Cardiovascular Interventions 2017 Apr;10(4).
pag. 20
Chapter 5. Reduced Coronary Flow Reserve in Coronary Arteries without Stenosis: Impact of Various Hemodynamic and Clinical Parameters. Published in European Heart Journal 2016, Volume 37, Issue suppl 1, August 2016 (Best posters session ESC congress 2016).
pag. 24
Chapter 6. Catheter-Based Measurements of Absolute Coronary Blood Flow and Microvascular
Resistance: Feasibility, Safety, and Reproducibility in Humans.
Published in Circulation: Cardiovascular Interventions 2018 Mar;11(3):e006194.
2
Part II. Fractional flow reserve and natural history of
stable coronary artery disease
Chapter 7. Significance of Intermediate Values of Fractional Flow Reserve in Patients With Coronary Artery Disease.
Published in Circulation 2016 Feb 2;133(5):502-8.
pag. 31
Chapter 8. Visual and Quantitative Assessment of Coronary Stenoses at Angiography Versus Fractional Flow Reserve: The Impact of Risk Factors.
Published in Circulation Cardiovascular Imaging 2017 Jul;10(7).
pag. 34
Chapter 9. Angiography versus hemodynamic assessment to predict the natural history of coronary stenoses: a fractional flow reserve versus angiography in multivessel evaluation 2 (FAME 2) substudy. Published in European Heart Journal 2017, Volume 38, Issue suppl 1, August 2017 (Best abstract ESC Congress 2017).
pag. 36
Chapter 10. Coronary lesion progression as assessed by fractional flow reserve (FFR) and angiography. Published in EuroIntervention. 2018 Oct 20;14(8):907-914..
pag. 40
Part III. Fractional flow reserve in special clinical
settings
Chapter 11. Detect fractIonal flow reServe of Epicardial steNosis with Guiding cAtheter disenGagEment: DISENGAGE registry
Submitted
pag. 44
Chapter 12. Angiographic and hemodynamic modifications of Myocardial Bridge during supine bicycle exercise.
3 Published in European Heart Journal, Volume 38,
Issue suppl 1, 1 August 2017 (ESC congress 2017). Chapter 13. Fractional flow reserve to guide and to assess
coronary artery bypass grafting.
Published in European Heart Journal 2017 Jul 1;38(25):1959-1968.
pag. 52
Chapter 14. Impact of fractional flow reserve on surgical coronary revascularization strategy.
Published in European Heart Journal, Volume 39, Issue suppl 1, August 2018 (ESC congress 2018).
pag. 54
Chapter 15. Fractional Flow Reserve-Guided Revascularization in Patients With Aortic Stenosis.
Published in American Journal of Cardiology 2016 May 1;117(9):1511-5.
pag. 57
Chapter 16. Clinical Outcome of Patients with Aortic Stenosis and Coronary Artery Disease Not Treated According to Current Recommendations. Published in Journal of Cardiovascular
Translational Research 2016 Apr;9(2):145-52.
pag. 61
Chapter 17. Impact of Right Atrial Pressure on Fractional Flow Reserve Measurements: Comparison of
Fractional Flow Reserve and Myocardial Fractional Flow Reserve in 1,600 Coronary Stenoses.
Published in JACC Cardiovascular Interventions 2016 Mar 14;9(5):453-9.
pag.65
Chapter 18. Impact of Fractional Flow Reserve in patients with left ventricular dysfunction
Submitted
4
Part IV. Angiography-derived FFR technologies
Chapter 19. Diagnostic Accuracy of Fast Computational Approaches to Derive Fractional Flow Reserve From Diagnostic Coronary Angiography: The International Multicenter FAVOR Pilot Study. Published in JACC Cardiovascular Interventions. 2016 Oct 10;9(19):2024-2035.
pag. 76
Chapter 20. FFRangio: theoretical basis.
Published in Circulation: Cardiovascular Interventions 2017 Sep;10(9).
pag. 81
Chapter 21. Fractional Flow Reserve Derived From Routine Coronary Angiograms.
Published in J Am Coll Cardiol 2016 Nov 15;68(20):2235-2237.
pag. 85
Chapter 22. Validation Study of Image-Based Fractional Flow Reserve During Coronary Angiography.
Published in Circulation: Cardiovascular Interventions 2017 Sep;10(9).
pag. 88
Part V. Platelet and microvascular function
Chapter 23. Effects of Prasugrel Versus Clopidogrel on Coronary Microvascular Function in Patients Undergoing Elective PCI.
Published in J Am Coll Cardiol. 2016 Jul 12;68(2):235-7.
pag. 93
Chapter 24. Platelet Reactivity and Coronary Microvascular Impairment After Percutaneous
Revascularization in Stable Patients Receiving Clopidogrel or Prasugrel.
Published in Atherosclerosis 2018 Aug 30;278:23-28.
pag. 96
5 G894T polymorphism after a loading dose of
aspirin plus clopidogrel.
Published in Thrombosis Research 2017 Mar;151:72-73.
Chapter 26. Correlation between serum uric acid levels and residual platelet reactivity in patients
undergoing PCI.
Published in Nutrition, Metabolism and Cardiovascular Diseases 2017 May;27(5):470-471.
pag. 103
Chapter 27. PROcedure related microvascular ACTIVation in long lEsions treated with bioresorbable vascular scaffold versus everolimus-eluting stent
implantation (PROACTIVE trial). Submitted
pag. 105
Part VI. Percutaneous coronary interventions in
bifurcation lesions: from bench tests to clinical
outcome
Chapter 28. Single String Technique for stenting of complex coronary bifurcation stenoses.
Published in EuroIntervention 2016 Volume 12, Number 1, (EuroPCR congress 2016).
pag. 111
Chapter 29. Reversed single string technique for coronary bifurcation stenting - First report of case demonstrations in vitro.
Published in Catheterization and Cardiovascular Interventions 2018 Feb 15;91(3):396-401.
pag. 114
Chapter 30. Resorbable magnesium scaffold in coronary bifurcations – report of in vitro experiments Submitted
pag. 120
6 interventions in coronary bifurcations.
In Press on International Journal of Cardiology- Published online: December 3, 2018
Part VII. Discussion and conclusions
Discussion pag. 132
Conclusions pag. 150
List of abbreviations pag. 152
Bibliography pag. 155
Curriculum vitae pag. 172
List of all publications pag. 179
7
CHAPTER 1
General introduction and outline of the thesis
Since its first description, invasive coronary angiography has been uniformly accepted to define the presence and extent of obstructive coronary artery disease (CAD), and to guide revascularization(1). However coronary angiography produces 2-dimensional silhouette images of the 3-dimensional vascular lumen. Because angiographic stenosis severity is reported as a ratio of the stenosis’ minimal lumen diameter to the adjacent “normal” reference segment, accuracy is limited by the inability to identify both “diseased” and “normal” vessel segments, particularly in the setting of diffuse CAD. Additional artifacts including contrast streaming, branch overlap, vessel foreshortening, calcifications, and ostial origins further contribute to the uncertainty of the angiographic interpretation of coronary stenosis severity. Despite numerous attempts to evaluate complex anatomy, the angiographer is still confronted with a visual dilemma in which no single view, or even multiple views, provides an answer. Considering these limitations, coronary anatomy alone, even with the highest resolution and a perfect repeatability, will never be sufficient to predict physiological behaviour of a single stenosis(2,3), particularly for those between 30% and 80% diameter stenosis(4-6). The main unknowns are the myocardial mass depending from the stenotic segment and the microvascular function. Both will determine maximal myocardial blood.
In contrast fractional flow reserve (FFR) is a flow index, defined as the ratio of maximal hyperemic myocardial blood flow in the presence of a stenosis
8 to the physiologic maximal hyperemic myocardial blood flow in the same territory but in the absence of any stenosis(7-9). As such, its value is influenced and integrates hyperaemic flow, which itself depends on stenosis severity, myocardial mass, and its microvascular function. Since mass and microvascular function are not likely to change in a given patients before and after revascularization, FFR indicates to what extent hyperaemic myocardial flow will increase after percutaneous coronary intervention (PCI) (i.e. normalization of the epicardial resistance)(10,11). FFR overcomes the visual-functional mismatch and stands alone in measuring ischemia in the catheterization laboratory with validated and durable clinical data supporting its use for predicting outcomes. Fifteen-year outcome data from the DEFER (Deferral vs. performance of percutaneous coronary intervention of functionally nonsignificant coronary stenosis) study demonstrate that postponing PCI in vessels with an FFR >0.75 is safe and associated with a low rate of clinical endpoints(12), whereas the FAME-2 (Fractional Flow Reserve versus Angiography for Multivessel Evaluation-2) study, among others, showed that patients with an abnormal FFR (i.e., lesion-specific ischemia) benefit more from revascularization than continued optimal medical therapy(13-15).
Faced with this scenario, the almost systematic use of FFR in catheterization laboratory in different anatomical settings would seem almost intuitive and obvious, especially if we consider the clear indications of the European and American guidelines on myocardial revascularization(16,17). Nevertheless, the penetration of physiology-based guidance varies significantly across continents, countries, centers, and operators, ranging from 3% to 30% of the total volume of coronary revascularizations. Several factors have been proposed to explain the variability in FFR assessment adoption, such as
9 differences in equipment, reimbursement policies, and operator choice. Other investigators have suggested concerns regarding adenosine side effects, costs, and time(18,19). Therefore, the ability to derive FFR values from routinely performed coronary angiograms, without the need for a pressure guidewire or hyperemic stimulus, could have an important impact on daily clinical practice by streamlining the workflow within the catheterization laboratory and avoiding the need for invasive coronary measurements. Several image-based FFR methodologies have recently been introduced. In this thesis we report the first multicenter validation studies of the two angiography derived-FFR technologies that are gaining ground in interventional cardiology practice: FFRangio and QFR.
It is unclear whether FFR can predict which patients will actually have an increase in myocardial perfusion after PCI(20). Although the goal of PCI is to increase coronary blood flow by relieving epicardial coronary stenosis, early explorations showed that successful stenting increased coronary flow reserve (CFR) in only 80% of patients(21). This surprising failure to normalize CFR in all PCI patients was attributed to a combination of diffuse downstream atherosclerosis, or acutely induced or preexisting microvascular dysfunction. Microvascular dysfunction alone can cause ischemic symptoms in the absence of epicardial obstruction(22-24) and probably contributes to persistent ischemia despite successful revascularization(25). However, use of CFR to assess the microcirculation independently is limited in that CFR interrogates the flow status of both the epicardial artery and the microcirculation. Also the dependence on resting haemodynamics is an important theoretical limitation for the use of CFR as a primary diagnostic tool in ischemic heart disease(26,27).
10 In this sense, Fearon WF et colleagues setted up a novel index of microcirculatory resistance (IMR), defined as distal coronary pressure divided by the inverse of the hyperemic mean transit time (a correlate to absolute flow), measured simultaneously with the coronary pressure wire(28-32). The advantages of IMR include that is relatively easy to measure and can be performed simultaneously while measuring FFR without any extra equipment, is specific for the microvasculature and is independent from the hemodynamic variability(33-35). Still, it is not known whether therapeutic reduction of IMR (e.g. with an intracoronary vasodilator) confers clinical benefits. Nor is it known whether, in patient with stable CAD, treatment decisions based on an IMR threshold might have prognostic benefits (as has been shown to be the case with FFR). Also during IMR assessment an intrinsic variability of resting mean transit time (Tmnrest) of
7-10%, and Tmnhyp of 4-8% have been reported.
With this in mind, aiming to a quantitative assessment of the microcirculation independent of operators and the presence of epicardial stenoses, a recent development of a dedicated monorail infusion catheter (Rayflow™, Hexacath, Paris, France) has simplified the measurement of absolute coronary flow (Q) and microvascular resistance (R) in the cathlab, opening a new window to the coronary microcirculation. The present method relies on a simple basic principle. Three parameters should be known: the infusion rate of saline (in mL/min), the temperature of the saline when it enters the coronary tree (in degrees), and the temperature of the blood when saline and blood have been mixed in the distal part of the artery (in degrees). This rule of three allows the calculation of absolute Q(36). The calculated flow is hyperemic flow because it has been shown that the infusion of saline at room temperature through the RayFlow catheter
11 reliably uniformly induces maximal hyperemia(37). A major advantage of this method is that—in contrast to Doppler or index of microcirculatory resistance—it is completely operator independent. The saline infusion can be continued until a true steady state is achieved (typically within 10–15 seconds), and during the entire measurement sequence, the operator does not touch the patient nor any catheter. In this thesis we report the fist study aimed at investigate feasibility, safety, and reproducibility of catheter-based measurements of absolute coronary blood flow and microvascular resistance.
Outline of the thesis
The thesis is divided in seven part:
Part I. From pressure derived-FFR to Absolute Flow and Microvascular Resistance. In the first part of the thesis we report our research projects published in the field of coronary physiology, describing the gradual shift of attention over the years from the FFR measurements to the direct assessment of absolute coronary blood flow and microvascular resistance. The “leitmotiv” of this paradigm shift is represented by the research projects, presented in this section, regarding the agents inducing maximal hyperemia, starting from the intracoronary administration of adenosine to the intracoronary infusion of saline at room temperature through the Rayflow™ catheter.
Part II. Fractional flow reserve and natural history of stable coronary artery disease. In the second part of the thesis we report the cluster of
12 research projects that focuses on the importance of FFR assessment of epicardial stenosis in patients with stable CAD, with both single vessels disease (chapter 7) and multivessel disease (chapter 9), underlining its prognostic value.
Part III. Fractional flow reserve in special clinical settings. This section of the thesis is a collection of our research projects aimed at investigate the role of invasive functional assessment in patients in whom coronary artery bypass graft (CABG) is indicated, which already underwent CABG and in patients with left ventricular dysfunction (LVD) and/or heart failure (HF). We also provide a description of the impact on clinical decision making of guiding catheter disengagement during FFR assessment of intermediate coronary stenoses (chapter 11) and the FFR measurements in symptomatic patients with Myocardial Bridge (chapter 12).
Part IV. Angiography-derived FFR technologies. We report in these sections the first-in man validations studies of the two main technologies in the field of angiography-derived FFR: FFRangio and QFR.
Part V. Platelet and microvascular function. This part of the thesis is a collection of research projects aimed to evaluate the microvascular dysfunction with IMR in patients with stable CAD undergoing elective PCI. We investigated a) the protective rule of prasugrel vs. clopidogrel on microcirculation (chapter 24) b) the effect of G894T polymorphism on
13 residual platelet reactivity and on the risk of periprocedural myocardial infarction (PMI) (chapter 25); c) the impact of serum uric acid levels on high residual platelet reactivity after PCI (chapter 26); d) the procedure related microvascular activation in long lesions treated with bioresorbable vascular scaffold versus everolimus-eluting stent implantation (chapter 27).
Part VI: Percutaneous coronary interventions in bifurcation lesions: from bench tests to clinical outcome. This section of the thesis focuses on the topic of PCI in bifurcation lesions. Regarding the bench tests, we describe the procedural steps in vitro of the reversed single string technique (chapter 29) and we report the validation of resorbable magnesium scaffold (RMS) in various non-bifurcation and bifurcation anatomies using standard interventional techniques (chapter 30). Concerning the clinical evaluation, we describe the clinical applicability of the single-string bifurcation stenting technique (chapter 28) and we report the results of the P2BiTO registry, regarding the major clinical, anatomic and procedural determinants of mid-term clinical outcomes in all comer patient population undergoing PCI in bifurcations (chapter 31).
Part VII: Discussion and conclusions. The last section of the thesis is a broad discussion of the addressed topics with the conclusions.
14
Part I
From pressure derived-FFR to Absolute Flow
and Microvascular Resistance
15
CHAPTER 2
Standardization of Fractional Flow Reserve Measurements
To assess the contribution of a new diagnostic test, a hierarchical model of efficacy was proposed by Fryback and Thornbury. Although the model was developed for the evaluation of diagnostic imaging, its parameters also apply to “physiological imaging,” with its attributes of: 1) technical quality; 2) diagnostic accuracy; 3) diagnostic thinking efficacy; 4) effect on therapy; 5) patient’s outcome; and 6) economic aspects (Figure 1). A key feature of this model is that for a test to be efficacious at a higher level in this hierarchy, it must be efficacious at lower levels.
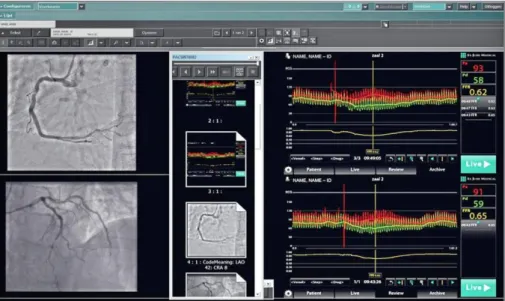
Figure 1: Fractional Flow Reserve: example of simultaneous DICOM format storage of complete physiological and angiographic information. Archiving this information (as well as intravascular ultrasound and optical coherence tomography, when available) side-by-side, in a format that is easily accessible (“same place, same time” principle) enables surgeons, interventional cardiologists, clinicians, and heart team meeting participants to be exposed to these different imaging modalities and to integrate “anatomy” and “physiology” into individual clinical decision making. CRA: cranial; DICOM: digital imaging and communications
16 in medicine; ECG: electrocardiogram; FFR: fractional flow reserve; LAO: left anterior oblique; Pa: aortic pressure; Pd: distal coronary pressure.
Since the first description of pressure wire-based FFR, an abundance of data pertaining to each of these criteria have been reported. Accordingly, FFR is now considered to be the reference standard for the evaluation of the ischemic potential and the expected benefit from revascularization of coronary stenosis. Moreover, FFR is increasingly being used in clinical trials as an inclusion criterion or as an endpoint and to validate new diagnostic modalities. Although all major outcomes-randomized clinical trials (RCTs) have made decisions on the basis of operator-derived FFR values, a handful of recent diagnostic accuracy studies sent tracings to physiology core laboratories for post hoc analysis. However, no matter where analysis takes place, technical or operator-related artifacts in pressure recordings should be avoided, minimized, or at least identified if they occur.
FFR is calculated from distal coronary pressure (Pd) and aortic
pressure (Pa) obtained during maximal coronary hyperemia. In principle,
these measurements are straightforward and almost fully automated, as illustrated in Figure 2. Yet, minor differences among practices of different laboratories have led to some heterogeneity in acquiring and interpreting the data. Because FFR-based decisions are important for patients’ outcomes, and given the need for rigor and reproducibility in reading the tracings by core laboratories, the highest technical quality of FFR measurements is desirable. As FFR by itself is a highly reproducible diagnostic measure, deviations mainly derive from a lack of standardization.
17 Figure 2: Typical example of FFR measurement obtained after intracoronary bolus injection of adenosine. The injection of the bolus is brief so that the aortic signal (red) is interrupted during no longer than 1 to 2 s. Automated calculation of FFR corresponds to the ratio of mean distal coronary pressure (green) to mean aortic pressure during maximal hyperemia. CRA: cranial; FFR: fractional flow reserve; LAO: left anterior oblique; Pa: aortic pressure; Pd: distal coronary pressure.
Accordingly, this document proposes a standardized way of acquiring, recording, interpreting, and storing the pressure tracings for daily practice and for the purpose of clinical research through a core laboratory. Comprehensive reviews of the principle of FFR and of the FFR-based clinical outcome data have been described previously.
18
CHAPTER 3
Intracoronary Adenosine: Dose-Response Relationship
With Hyperemia
The present study sought to establish the dosage of intracoronary (IC) adenosine associated with minimal side effects and above which no further increase in flow can be expected.
Background: Despite the widespread adoption of IC adenosine in clinical practice, no wide-ranging, dose-response study has been conducted. A recurring debate still exists regarding its optimal dose.
Methods: In 30 patients, Doppler-derived flow velocity measurements were obtained in 10 right coronary arteries (RCAs) and 20 left coronary arteries (LCAs) free of stenoses >20% in diameter. Flow velocity was measured at baseline and after 8 ml bolus administrations of arterial blood, saline, contrast medium, and 9 escalating doses of adenosine (4 to 500 µg). The hyperemic value was expressed in percent of the maximum flow velocity reached in a given artery (Q/Qmax, %).
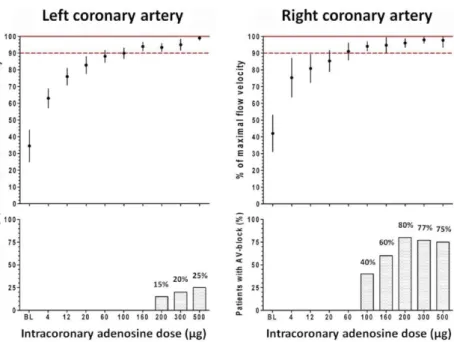
Results: Q/Qmax did not increase significantly beyond dosages of 60 mg for the RCA and 160 mg for LCA. Heart rate did not change, whereas mean arterial blood pressure decreased by a maximum of 7% (p < 0.05) after bolus injections of intracoronary (IC) adenosine. The incidence of transient A-V blocks was 40% after injection of 100 µg in the RCA and was 15% after injection of 200 µg in the LCA. The duration of the plateau reached 12 13 s after injection of 100 µg in the RCA and 21 6 s after the injection of 200 µg in the LCA. A progressive prolongation of the time needed to return to
19 baseline was observed. Hyperemic response after injection of 8 ml of contrast medium reached 65 36% of that achieved after injection of 200 µg of adenosine (Figure 3).
Figure 3: Intracoronary adenosine dose-flow relationship. (Top) Dose-response data for the right coronary artery (RCA) (left panel) and the left coronary artery (LCA) (right panel). The data are expressed as the percent of maximum for each patient (Q/Qmax) at each dose of intracoronary (IC) adenosine. The error bars represent the 95% confidence intervals for each value. (Bottom) The bars represent the percent of patients in whom high-grade atrioventricular (AV) block occurred with that dose of adenosine. BL: baseline.
Conclusions: This wide-ranging, dose-response study indicates that an IC adenosine bolus injection of 100 µg in the RCA and 200 µg in the LCA induces maximum hyperemia while being associated with minimal side effects.
20
CHAPTER 4
Saline-Induced Coronary Hyperemia: Mechanisms and
Effects on Left Ventricular Function
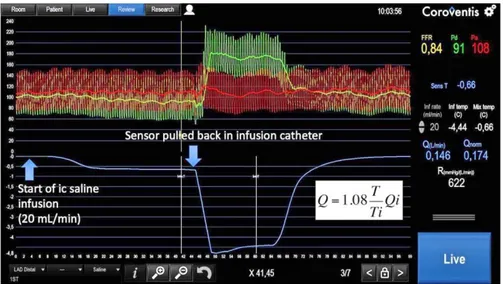
Background: reliable method to assess volumetric maximal myocardial flow and absolute minimal microvascular resistance has been described almost 10 years ago. The method is based on the principle of coronary thermodilution by continuous infusion of saline at room temperature during steady-state hyperemia. One of the prerequisites of the thermodilution principle is the complete and instantaneous mixing of the indicator, in this case saline at room temperature. Yet, the method was hampered by technical difficulties that precluded routine application. The technique was recently simplified by the development of a dedicated rapid exchange infusion catheter and a dedicated software allowing instantaneous calculation of volumetric flow and resistance. The present work is based on an incidental observation. While performing measurements of minimal microvascular resistance in patients with mild atherosclerosis, we observed the occurrence or the increase of a pressure gradient between the coronary ostium and the distal part of the coronary artery few seconds after the start of the intracoronary infusion of saline, even before the start of adenosine infusion (Figure 4). This observation suggested that the infusion of saline at room temperature could elicit coronary hyperemia. If infusion of saline would indeed induce maximal steady-state hyperemia, this would further simplify the application of coronary thermodilution-derived quantification of myocardial flow and resistance.
21 Figure 4. Example of simultaneous pressure and temperature recording in the left anterior descending coronary artery with mild diffuse atherosclerosis. A, Complete tracing of thermodilution-derived absolute flow measurements, including the moderate decline in coronary temperature (T) and the sharp decrease in temperature when the sensor is pulled back in the infusion catheter to assess the temperature of the saline when it enters the coronary artery (Ti). B, Magnification of the rectangle delineated in A by a white broken line. Approximately 10 s after the start of the infusion of saline at room temperature at the rate of 20 mL/min (yellow arrow), the distal temperature starts to decline, reaching a plateau after ≈20 s. This decrease in temperature is paralleled by an increase in pressure gradient across the mild epicardial stenosis suggesting the occurrence of hyperemia. FFR indicates fractional flow reserve.
22 Aim: This study was designed to study the effects of intracoronary infusion of saline at room temperature on the coronary circulation and myocardial function in humans and to explore its mechanisms.
Methods and Results: Thirty-three patients were studied; in 24 patients, intracoronary Doppler flow velocity measurements were performed at rest, after IC adenosine, and during increasing infusion rates of saline at room temperature through a dedicated catheter with 4 lateral side holes. In 9 patients, global longitudinal strain and flow propagation velocity were assessed by transthoracic echocardiography (TTE) during a prolonged intracoronary saline infusion. Taking adenosine induced maximal hyperemia as reference, intracoronary infusion of saline at rates of 5, 10, 15, and 20 mL/min induced 6%, 46%, 111%, and 112% of maximal hyperemia, respectively (Figure 5). There was a close agreement of maximal saline- and adenosine induced CFR (intraclass correlation coefficient, 0.922; P<0.001). The same infusion rates given through 1 end hole (n=6) or in the contralateral artery (n=6) did not induce a significant increase in flow velocity. Intracoronary saline given on top of an intravenous (IV) infusion of adenosine did not further increase flow. Intracoronary saline infusion did not affect blood pressure, systolic, or diastolic left ventricular function. Heart rate decreased by 15% during saline infusion (P=0.021).
23 Figure 5: Representative example of coronary flow velocity tracings at baseline and after an intracoronary bolus of 200 μg of adenosine, during infusion of saline at room temperature at rates of 5, 10, 15, and 20 mL/min. A, Saline is infused through the side holes of the catheter advanced over the Doppler wire. B, Saline is infused through the distal hole of the catheter advanced over the Doppler wire. C, Saline is infused through the side holes of an infusion catheter advanced in a contralateral artery.
Conclusions: intracoronary infusion of saline at room temperature through a dedicated catheter for coronary thermodilution induces steady-state maximal hyperemia at a flow rate ≥15 mL/min. These findings open new possibilities to measure maximal absolute coronary blood flow and minimal microcirculatory resistance.
24
CHAPTER 5
Reduced Coronary Flow Reserve in Coronary Arteries
without Stenosis: Impact of Various Hemodynamic and
Clinical Parameters
Background: CFR, the ratio of hyperemic flow to baseline flow, was proposed over 40 years ago, and has been the gateway for clinical application of coronary physiology. This study aimed to evaluate the impact of various clinical and hemodynamic parameters on CFR in angiographically normal coronary arteries.
Methods: In 30 patients with stable coronary artery disease, Doppler-derived flow velocity measurements were obtained in angiographically normal coronary arteries. Flow velocity was measured during one minute under resting conditions and then after administering increasing dosages of IC adenosine boluses (4 to 500 μg).
Results: In coronary arteries without significant stenosis, CFR varied from 1.42 to 4.88 (average 2 .83±0.88). Patients were categorized into two groups using the median CFR: low CFR ranging from 1.42 to 2.78 and high CFR ranging from 2.87 to 4.88. Baseline flow velocity was significantly higher in patients with low CFR than in patients with high CFR. Hyperemic flow velocity was similar in both groups (Figure 6).
25 Figure 6: Baseline and hyperemic flow in the two groups.
Baseline flow velocity showed a significant correlation with the absolute value of CFR (R2=0.42, p<0.01), while hyperemic flow did not correlate with it (R2=0.04, p=0.30). A trend was observed such that, in patients with low CFR, less adenosine was needed to reach maximal hyperemia. No difference was found in any other hemodynamic or clinical or parameters between groups.
Conclusions: In coronary arteries free from significant stenosis, "resting" flow velocity appears to be a major determinant of pathologic CFR, more so than hyperemic flow.
26
CHAPTER 6
Catheter-Based Measurements of Absolute Coronary
Blood Flow and Microvascular Resistance: Feasibility,
Safety, and Reproducibility in Humans
Background: The principle of continuous thermodilution can be used to calculate absolute coronary blood flow (Q). The concomitant measurement of pressure in the distal part of the vessel allows the calculation of myocardial resistance. The recent development of a dedicated monorail infusion catheter has simplified the measurement of absolute Q and microvascular resistance (R) in the cathlab, opening a new window to the coronary microcirculation. Q (mL/min) can be calculated by continuous intracoronary infusion of saline, as previously described, according to the equation
where Qi is the saline infusion rate in mL/min, Tb is the temperature of
blood in the distal coronary before infusion of saline, Ti is the temperature
of the infused saline when it exits the infusion catheter, and T is the temperature of the homogenous mixture of blood and saline in the distal part of the coronary artery during infusion. The constant cp relates to the
difference between the specific temperature and density of blood and saline, and when saline is infused in blood, this is equal to 1.08. In practice, the temperature of blood (Tb, ≈37°C) is taken as a reference, and the other
27 temperatures are measured with respect to that value. Therefore, Ti and T
stand for relative temperatures compared with Tb, and the equation is
simplified as follows:
Since, in clinical practice, Qi is chosen between 15 and 30 ml/min, the last
part of the equation subtracts between 1.2 and 2.4 mL/min from the calculated coronary blood flow and can therefore be neglected. Consequently, the equation is further simplified to:
Absolute microvascular resistance (R) is calculated in analogy to Ohm’s law:
where Pd is the distal coronary pressure and Qb is the coronary blood flow.
Aim: Although data on the in vitro validation of the method and the infusion catheter have been recently published, in vivo data are lacking. The aim of the study is to explore the safety, feasibility, and reproducibility of coronary blood flow and R measurements as measured by continuous thermodilution in humans.
Methods and Results: Absolute coronary flow and R can be calculated by thermodilution by infusing saline at room temperature through a dedicated monorail catheter. The temperature of saline as it enters the vessel, the temperature of blood and saline mixed in the distal part of the vessel, and
28 the distal coronary pressure were measured by a pressure/temperature sensor-tipped guidewire (Figure 7).
Figure 7: Thermodilution-derived absolute coronary blood flow and microvascular resistance measurement. Example of thermodilutionderived absolute microvascular resistance and coronary blood flow in a left anterior descending artery. The flow rate of the administered saline is 20 mL/min, and the calculated values of absolute coronary blood flow (Q) and microvascular resistance (R) are 0.146 L/min and 622 mm Hg/L/min, respectively. The theoretically achieved maximum blood flow in the absence of epicardial stenoses (Qnorm), that is, if fractional flow reserve (FFR) was equal to 1, is also displayed. Pa indicates aortic pressure; and Pd, distal coronary pressure.
The feasibility and safety of the method were tested in 135 patients who were referred for coronary angiography. No significant adverse events were observed; in 11 (8.1%) patients, bradycardia and concomitant atrioventricular block appeared transiently and were reversed immediately on interruption of the infusion. The reproducibility of measurements was tested in a subgroup of 80 patients (129 arteries). Duplicate measurements had a strong correlation both for coronary blood flow (ρ=0.841, P<0.001; intraclass correlation coefficient=0.89, P<0.001) and R (ρ=0.780, P<0.001; intraclass correlation coefficient=0.89, P<0.001). In Bland–Altman plots, there was no significant bias or asymmetry.
29 Conclusions: Despite some limitations, the present data confirm the feasibility, safety, and reproducibility of thermodilution-derived hyperemic coronary flow (expressed in L/min) and of coronary R measurements (expressed in mm Hg/L/min or Wood units) that can be performed simply and easily. If further confirmed and validated, this approach should allow a more quantitative and operator-independent quantification of the microvasculature and help in assessing treatment of microvascular dysfunction.
30
Part II
Fractional flow reserve and natural history of
stable coronary artery disease
31
CHAPTER 7
Significance of Intermediate Values of Fractional Flow
Reserve in Patients With Coronary Artery Disease
Background: FFR represents the standard of reference for invasive functional evaluation of the ischemic potential of coronary stenosis and is a valuable tool to guide percutaneous revascularization. An FFR value ≤0.75 is almost uniformly associated with signs of ischemia, whereas an FFR >0.80 is usually associated with the absence of ischemia. Based on numerous randomized trials and registries in most subsets of lesions and patients, the threshold value of 0.80 has been widely accepted to guide clinical decision making. The best treatment strategy for intermediate stenosis with FFR in the narrow gray zone of values, that is, between 0.76 and 0.80, has been questioned. Therefore, we analyzed the long-term clinical outcome of patients with an isolated stenosis within the gray zone (0.76–0.80) or immediately next to the gray zone (0.70–0.75 and 0.81–0.85).
Methods and Results: From February 1997 to June 2013, all patients with single-segment disease and an FFR value within the gray zone or within the 2 neighboring FFR strata (0.70–0.75 and 0.81–0.85) were included. Study end points consisted of major adverse cardiovascular events (death, myocardial infarction, and any revascularization) up to 5 years. Of 17 380 FFR measurements, 1459 patients were included. Of them, 449 patients were treated with revascularization and 1010 patients were treated with medical therapy (Figure 8). In the gray zone, the major adverse cardiovascular events rate was similar (37 [13.9%] versus 21 [11.2%],
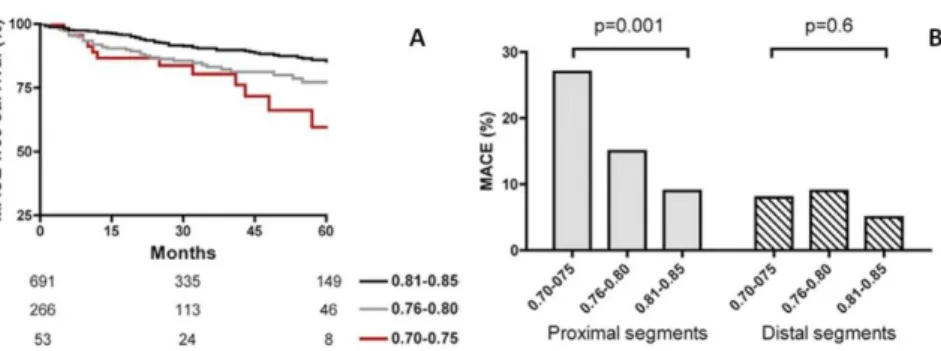
32 respectively; P=0.3) between medical therapy and revascularization, whereas a strong trend toward a higher rate of death or myocardial infarction (MI) (25 [9.4] versus 9 [4.8], P=0.06) and overall death (20 [7.5] versus 6 [3.2], P=0.059) was observed in the medical therapy group (Figure 8). Among medical therapy patients, a significant step-up increase in major adverse cardiovascular events rate was observed across the 3 FFR strata, especially with proximal lesion location. In revascularization patients, the major adverse cardiovascular events rate was not different across the 3 FFR strata (Figure 9).
Figure 8: Cumulative rate (%) of MACE (log-rank, 0.87; P=0.3) and death or MI (log-rank, 2.96; P=0.08) in the gray-zone patients treated with medical therapy or revascularization. MACE indicates major adverse cardiovascular event; MI, myocardial infarction; MT, medical therapy; and REV, revascularization.
Figure 9: A) MACE-free survival (%) in patients of the medical therapy group stratified by FFR strata (log-rank, 15; P<0.001). B) MACE rate (%) in patients receiving medical therapy,
33 stratified according to the FFR strata, and grouped according to the location of the lesions (proximal vs distal). FFR indicates fractional flow reserve; and MACE, major adverse cardiovascular event.
Conclusions: Patients with an isolated stenosis located in a proximal coronary segment and FFR within the gray zone of 0.76 to 0.80. demonstrate a clinical outcome that is suboptimal when deferred to medical therapy alone. These data confirm the value of the 0.80 FFR threshold, and favor a revascularization strategy of coronary stenoses with FFR ≤0.80.
34
CHAPTER 8
Visual and Quantitative Assessment of Coronary Stenoses
at Angiography Versus Fractional Flow Reserve: The
Impact of Risk Factors
Background: The correlation between angiographic assessment of coronary stenoses and FFR is weak. Whether and how risk factors impact the diagnostic accuracy of angiography is unknown. We sought to evaluate the diagnostic accuracy of angiography by visual estimation (VE) and by quantitative coronary angiography (QCA) when compared with FFR and evaluate the influence of risk factors (RF) on this accuracy.
Methods and Results: In 1382 coronary stenoses (1104 patients), percent diameter stenosis by visual estimation (DSVE) and by quantitative coronary
angiography (DSQCA) was compared with FFR. Patients were divided into 4
subgroups, according to the presence of RFs, and the relationship between DSVE, DSQCA, and FFR was analyzed. Overall, DSVE was significantly higher
than DSQCA (P<0.0001); nonetheless, when examined by strata of DS, DSVE
was significantly smaller than DSQCA in mild stenoses, although the reverse
held true for severe stenoses. Compared with FFR, a large scatter was observed for both DSVE and DSQCA. When using a dichotomous FFR value of
0.80, C statistic was significantly higher for DSVE than for DSQCA (0.712 versus
0.640, respectively; P<0.001). C statistics for DSVE decreased progressively
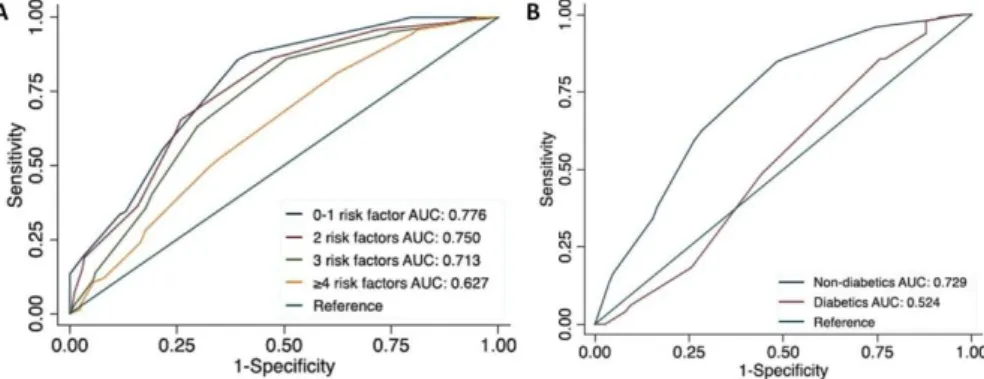
as RFs accumulated (0.776 for ≤1 RF, 0.750 for 2 RFs, 0.713 for 3 RFs and 0.627 for ≥4 RFs; P=0.0053) (Figure 10A). Also 97 (9%) patients had diabetes mellitus, and 1007 (91%) did not have diabetes mellitus. Both groups were similar in terms of baseline and angiographic characteristics, with the
35 exception of higher prevalence of dyslipidemia, family history of coronary artery disease, and higher body mass index in the diabetic group. FFR was significantly higher in the diabetic group compared with the nondiabetic group (0.83 [0.76, 0.90] versus 0.81 [0.73, 0.88]; P=0.013). In ROC analyses, the DSVE curve for the diabetic group had a lower C statistic compared with
the nondiabetic group (0.524 versus 0.729; P<0.001;) (Figure 10B).
Figure 10: A) Receiver operating characteristic curves for diameter stenosis by visual estimation (DSVE) according to the presence of risk factors. B) Receiver operating characteristic curves for DSVE in diabetic and nondiabetic patients. AUC indicates area under the curve.
Conclusions: This study confirms the weak correlation between angiographic metrics and FFR and indicates that, despite its subjectivity, VE is more accurate in predicting physiology than QCA. The presence of risk factors markedly blur this relationship: the more risk factors, the weaker the potential of angiography to assess physiology, particularly so in diabetics. In these patients—even more than in others—a combined angiographic and functional approach is mandated for optimal clinical decision-making about revascularization.
36
CHAPTER 9
Angiography versus hemodynamic assessment to predict
the natural history of coronary stenoses: a fractional flow
reserve versus angiography in multivessel evaluation 2
(FAME 2) substudy
Background: FFR has become the standard of reference for the invasive evaluation of coronary stenosis. Nevertheless, interventional cardiologists still prefer angiography for guiding decision making about revascularization, even in the absence of any budget and logistic constraints. The angiographic thresholds of 50% or 70% diameter stenosis (DS) are still used to define obstructive coronary artery disease to risk stratify patients, justify revascularization, serve as an end point in studies on revascularization strategies, and validate other approaches. Accordingly, we investigated the spontaneous, vessel-oriented clinical outcome of patients from the FAME 2 trial (Fractional Flow Reserve Versus Angiography in Multivessel Evaluation 2) in whom no revascularization was performed but in whom both the DS and functional (FFR) severity was known. The aim of the study was to compare the accuracy of both approaches in predicting the natural history of CAD.
Methods: The present analysis included the 607 patients from the FAME 2 trial in whom no revascularization was performed. FFR varied from 0.20 to 1.00 (average 0.74±0.16), and DS (by quantitative coronary analysis) varied from 8% to 98% (average 53±15). The primary end point, defined as
vessel-37 oriented clinical end point (VOCE) at 2 years, was a composite of prospectively adjudicated cardiac death, vessel-related MI, vessel-related urgent, and not urgent revascularization. The stenoses were divided into 4 groups according to FFR and DS% values: positive concordance (PC) (FFR≤0.80; DS≥50%), negative concordance (NC) (FFR>0.80; DS<50%), positive mismatch (PM) (FFR≤0.80; DS<50%), and negative mismatch (NM) (FFR>0.80; DS≥50%).
Results: Clinical 2-year follow-up was available for all patients. Overall, VOCEs occurred in 26% of cases. The rate of VOCE was highest in the group of stenoses with PC (FFR ≤0.80; DS ≥50%; 125/317 lesions [39.4%]) and lowest in stenoses with an NC (FFR >0.80; DS <50%; 17/216 lesions [7.9%]). The rate of VOCEs was similar in stenoses with a PM (FFR ≤0.80; DS <50%) and with a PC (50/153 lesions [32.7%] versus 125/317 lesions [39.4%], respectively; P=0.139). In contrast, the rate of VOCEs of stenoses with a NM (FFR >0.80; DS ≥50%) was lower as compared with stenoses with a PM (16/113 lesions [14.2%] 50/153 lesions [32.7%], respectively; P=0.001) but was not significantly different compared with stenoses with an NC (17/216 [7.9%]; P=0.099). There was no significant difference in terms of lesion-related outcome between the NM (FFR >0.80; DS ≥50%) and the NC (FFR >0.80; DS <50%), although there was a trend (P=0.099) (Figure 11).
38 Figure 11: Kaplan‒Meier survival curve of 4 groups according to the values of fractional flow reserve (FFR) and percent diameter stenosis (DS). CI indicates confidence interval; HR, hazard ratio; and VOCE, vessel-oriented clinical end point. Red, positive concordance (FFR≤0.80; DS≥50%); blue, negative concordance (FFR>0.80; DS<50%); orange, positive mismatch (FFR≤0.80; DS<50%); and green, negative mismatch (FFR>0.80; DS ≥50%).
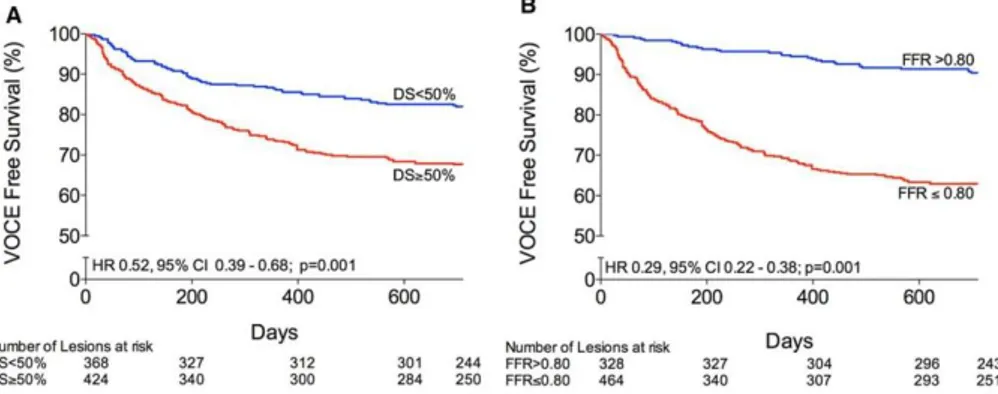
When the angiographic cutoff was set at 70% DS, the outcome results did not change. The rate of VOCE over time was significantly larger when lesions have a DS ≥50% or when lesions have an FFR ≤0.80, but the difference between the event curves was markedly larger for FFR than for DS (Figure 12). At the univariable analysis of predictors of VOCE the global
39 SYNTAX score was not found to be a significant predictor for vessel-related outcome. Moreover at the multivariable analysis FFR ≤0.80 was associated with a 4.16-fold increase in the hazard of VOCE and DS ≥50% with a 1.36-fold increase. After introduction of an interaction term, FFR ≤0.80 was associated with a 7.28- fold increase in the hazard of VOCE during the first 90 days and a 3.29-fold increase in the hazard of VOCE occurring >90 days.
Figure 12: Kaplan‒Meier survival according to the values of percent diameter stenosis (DS) and fractional flow reserve (FFR). CI indicates confidence interval; HR, hazard ratio; N, number of events; and VOCE, vessel-oriented clinical end point.
Conclusion: From this side-by-side comparison of DS and FFR to lesion-related outcome, it appears that the main determinant of the natural history of a lesion is its hemodynamic significance rather than its angiographic appearance. DS is the cornerstone of the definition of CAD. Because clinical outcome is the ultimate validation test for any new treatment or metrics, the present findings suggest that FFR should replace the 50% DS criteria for the definition of obstructive CAD.
40
CHAPTER 10
Coronary lesion progression as assessed by fractional flow
reserve (FFR) and angiography
Background: Intermediate coronary stenoses are prevalent in patients undergoing coronary angiography and are defined as a 30-70% luminal narrowing. Nevertheless, a heterogeneity exists in the definition of clinically significant coronary stenosis depending on diagnostic tool or location. This scatter in defining the significance of stenoses is attributed to the limited ability of anatomic tools to predict the functional impact of the lesions. Accordingly, guidelines recommend deferring revascularization with FFR > 0.80, irrespective of location and angiographic appearance due to the very low event rates. This “watchful waiting” approach begs the question of how intermediate, non-revascularized lesions evolve over time, both anatomically and functionally. To date, there is an abundance of data regarding the anatomic progression of coronary lesions that has shaped our understanding of their natural history. Yet, no data exist regarding the longitudinal functional progression of the coronary stenoses assessed by FFR.
Aim: To explore the evolution of coronary lesions that had repeated physiologic evaluation by FFR as an endpoint, describe the clinical significance of longitudinal FFR change (ΔFFR = FFRfollow-up – FFRbaseline), its
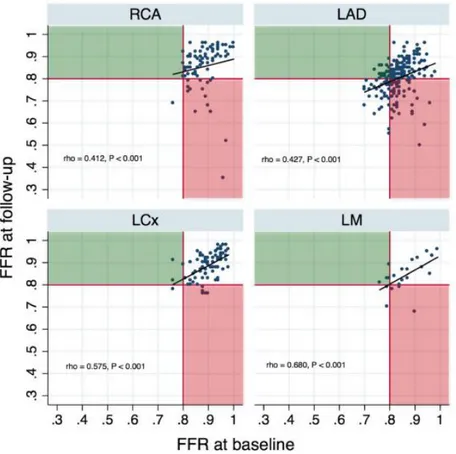
41 Methods and results: A retrospective, single-center analysis of 414 stenoses (331 patients) with consecutive FFR measurements at least six months apart was performed [median time interval: 24 (17, 37) months]. The change in percent diameter stenosis was 2% (-5%, 11%). FFR values at baseline and follow-up were 0.86 (0.82, 0.90) and 0.83 (0.79, 0.90) respectively (<0.0001). The median ΔFFR was -0.007 (-0.028, 0.010) per year. A significant linear correlation of FFRfollow-up with FFRbaseline was noted
(ρ= 0.550, P<0.0001); this was also the case on a per vessel analysis (Figure 13).
Figure 13: Scatterplot and correlations of FFR values at baseline and follow-up on a per vessel basis. The black line depict the 0.80 FFR threshold below which a lesion is clinically significant and should be revascularized. The red area includes lesions that were
non-42 ischemic at baseline and became ischemic at follow-up (FFR deterioration); the opposite is true for lesions in the green area (FFR improvement). Non-parametric Sperarman’s ρ correlation coefficients are presented. FFR= fractional flow reserve.
Similar results were noted for DS% and MLD, while lower values at follow-up (P<0.0001 for both the Wilcoxon matched-pairs test and the mixed effects repeated measures model), while RD remained unchanged. Rates of change for %DS was 1 (-2, 5) % and for MLD –0.012 (-0.175, 0.080) mm/year. Worsening FFR (ΔFFR <-0.05) was observed in 105 (25%) stenoses, stable FFR (-0.05≤ΔFFR≤0.05) in 276 (67%) and improving FFR (ΔFFR>0.05) in 33 (8%) stenoses. The number of hemodynamically significant stenoses (FFR≤0.80) was higher at follow-up compared to baseline (33% versus 17%, P<0.0001); ΔFFR correlated weakly with delta diameter stenosis (Δ%DS, ρ=-0.111, P=0.024). FFR baseline and PCI between measurements at a non-index segment were independent predictors of FFR follow-up (R2=0.2301). In ROC analysis, FFR baseline values predicted future clinically significant values [c-statistic: 0.736 (95% CI: 0.682 – 0.783)].
Conclusions: The findings of our study point to a slow progression rate for coronary atherosclerotic lesions, as evaluated by both angiography and FFR. Longitudinal data regarding FFR evolution are presented for the first time, with only 1 out of 4 lesions having a significant FFR worsening over a two-year period. FFRbaseline, but not angiographic indices, is an independent
predictor of longitudinal functional atherosclerosis progression, predicting which lesions will require revascularization. This finding can be clinically useful in the context of forgoing repeat angiographies for patients with persistent symptoms and high baseline FFR.
43
Part III
Fractional flow reserve in special clinical
settings
44
CHAPTER 11
Detect fractIonal flow reServe of Epicardial steNosis with
Guiding cAtheter disenGagEment: DISENGAGE registry
Background: The application of FFR in daily practice as well as for research purposes has been standardized in order to avoid technical or operator-related artifacts in pressure recordings and interpretation. However the impact of guiding catheter (GC) at the level of the coronary ostium during FFR measurements of intermediate coronary stenoses has been poorly investigated up to date. The mere presence of a GC in the coronary ostium induces some degree of stenosis, which depends on the relative size of the GC and the coronary ostium. This results into a not fully hyperemic flow across the ostium, with an artificial decrease of the mean aortic pressure (Pa) and a final overestimation of FFR value (Figure 14).
45 Figure 14: A) impact of different size of GCs on the relative diameter of the coronary ostium, with and without stenosis; B) mechanism of artificial decrease of the mean aortic pressure (Pa) and a final overestimation of FFR value; C) Angiographic example of intermediate stenosis and D) the corresponding FFR measurements with GC ingaged and GC disengaged. GC= guiding catheter; FFR= fractional flow reserve; VE= visual estimation; DS= diameter stenosis; RVD= reference vessel diameter; MLD= minimal lumen diameter; LL= lesion length.
Aim: In this prospective registry we aimed at investigate if the Δ FFRengaged –
FFRdisengaged: (1) might be significantly different from the intrinsic variability
of repeated FFR measurements; (2) could impact clinical decision making in intermediate coronary stenoses (e.g. changes on the FFR values from above 0.80 to below 0.75 and/or below 0.80). Also we aimed to evaluate if (3) the GC disengagement might have a different impact on stenoses related to a large amount of myocardium as compare to those related to small amount of myocardium.
46 Methods: Between October 2015 and December 2016, FFR was prospectively measured in 202 intermediate isolated stenosis (DS 46±10%; MLD 1.6±0.4 mm; RVD 3.0±1.6 mm; LL 15±8 mm) of 173 patients with stable angina (93%), silent ischemia (5%), and acute coronary syndrome (ACS) (2%, in non-culprit lesion). Stenoses were located on left anterior descending artery (n=124), diagonal branch (n=3), left circumflex artery (n=28), obtuse marginal branch (n=14), intermediate branch (n=5) and right coronary artery (n=28). Patients with diffuse disease, tandem lesions, left main and aorto-ostial stenosis, and culprit lesions of ST-segment elevation myocardial infarction (STEMI) and non-ST segment elevation myocardial infarction (NSTEMI) were excluded. FFR were measured with a 0.014-inch pressure guidewire (Pressure Wire Certus, St. Jude Medical, St. Paul, MN, US) with IC adenosine at the dose of 100 µg for the RCA and 200 µg for the LCA. For each stenosis, FFR was measured twice: with the GC engaged (FFRengaged) and with the GC disengaged (FFRdisengaged). To assure the quality
of the measurements, the equalization was checked with both GC engaged and disengaged, likewise the position of the wire was filmed to document the stability of the pressure sensor during the manipulation of the GC.
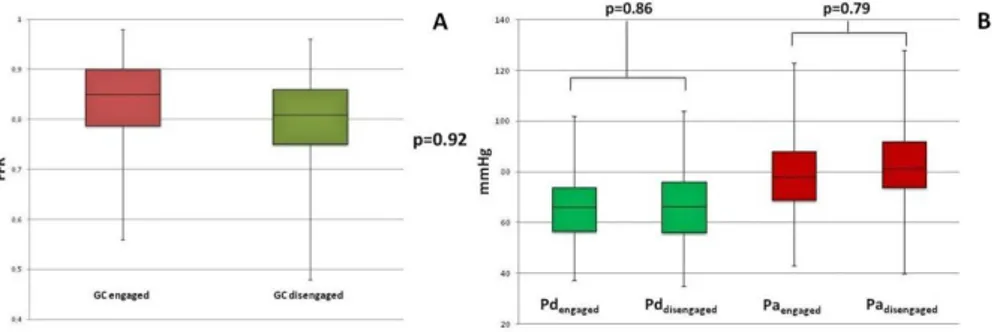
Results: GC disengagement was associated with a slight albeit non-significant decrease in FFR values overall (FFRengaged 0.84 ± 0.08 vs
FFRdisengaged 0.80 ± 0.08; Δ FFRengaged–FFRdisengaged 0.04 ± 0.03; p= 0,92), mainly
due to an increase of the mean Pa value (Paengaged 78.7 ± 13.5 mmHg vs Pa disengaged 82.9 ± 13.6; p= 0,79) rather than changes in the mean Pd value (Pd engaged 66.3 ± 13 mmHg vs Pddisengaged 66.6 ± 13.2 mmHg; p= 0,86) (Figure 15).
However in 38 stenoses (22% patients and 19% stenoses) whose FFR values were mostly located in the 0.81-0.85 stratum, GC disengagement was associated with a shift from above to below the clinical-decision making
47 threshold of 0.80. Also in 50% of the stenoses (102/202) ΔFFR was ≥ 0.04, which correspond to twice the value to be expected from repeated FFR measurements (test-retest repeatability of FFR; cut-off value: 0.02). GC disengagement had a significant impact on FFR measurements of stenoses related to large amount of myocardium as compare to those related to small amount of myocardium(∆FFRengaged–FFRdisengaged proximal and mid
segments 0.043 ± 0.03 vs ∆FFRengaged–FFRdisengaged distal segments 0.029 ±
0.03; p= 0.028) (Figure 16).
Figure 15: A) Overall FFR values changes after GC disengagement; B) Pd and Pa changes after GC disengagement. GC indicates guiding catheter.
48 Figure 16: ∆FFRengaged–FFRdisengaged of stenoses related to large amount of myocardium (proximal and mid coronary segments) vs. stenoses related to small amount of myocardium (distal coronary segments or side branches).
Conclusions: GC disengagement is associated with a slight albeit non-significant decrease in FFR values overall. Yet, GC disengagement resulted into a shift of FFR values from above to below the clinical-decision making threshold of 0.80 in 1 out of 5 measurements. Therefore it might be advisable to reassess FFR after disengaging the GC in case of FFR values close to 0.80.
49
CHAPTER 12
Angiographic and hemodynamic modifications of
Myocardial Bridge during supine bicycle exercise
Aim: The aim of this study is to evaluate the hemodynamic effect of physiological exercise during coronary angiogram with Pd/Pa, end diastolic
Pd/Pa and FFR measurements in symptomatic patients with Myocardial
Bridge (MB).
Methods: We included all consecutive patients between July 2014 and November 2016 with symptomatic MB without significant CAD. Coronary angiogram was performed with radial approach and supine bicycle set on the table. A pressure wire was placed downstream the MB. Systolic compression was assessed with QCA. Hemodynamic was continuously recorded during the protocol with Pd/Pa and end diastolic Pd/Pa at rest and
during exercise. The exercise protocol did not use nitrates prior to exercise, it started at 50 watts and increased of 15 watts every 2 minutes. After exercise intracoronary nitrates was used and finally IC adenosine administration for FFR measurement. The aim of this study is to evaluate the hemodynamic effect of physiological exercise on angiography, Pd/Pa,
end diastolic Pd/Pa and FFR.
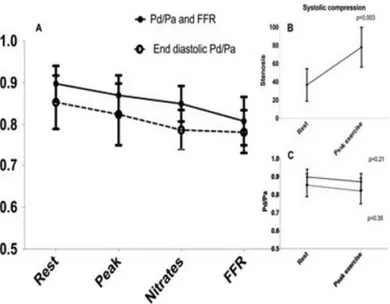
Results: 9 symptomatic patients with an isolated MB were included. Patients reached in average 73%±10% of maximum heart rate. No complication occurs during this protocol. Compression during systole significantly increases in peak exercise compare to rest respectively 78%
50 versus 37% (p=0.003). However Pd/Pa and end diastolic Pd/Pa values did not
significantly changed respectively 0.90 at rest versus 0.87 at peak exercise (p=0.21) and 0.85 versus 0.82 (p=0.35). During the protocol no significant difference was observe between rest, peak exercise Pd/Pa and after nitrates
(p>0.05 for all). FFR was significantly lower compared to rest, peak exercise and after nitrates (p<0.05 for all). End diastolic Pd/Pa values did not differ
significantly except after nitrates and when adding adenosine compared to rest, respectively 0.78±0.05, 0.77±0.05 and 0.85±0.06, p=0.038 and p=0.017). Post exercise FFR was significantly lower compared to rest Pd/Pa.
Lowest values were observed with FFR with a significant decrease flow (p=0.02) while it is not the case when using end diastolic Pd/Pa (p=0.20)
(Figure 17).
Figure 17: Changes in Pd/Pa, End diastolic Pd/Pa and FFR at rest, peak exercise after nitrates and after IC adenosine administration. FFR= fractional flow reserve; IC= intracoronary.
51 Conclusions: We reported invasive hemodynamic assessment of MB during physiological exercise conditions with supine bicycle. MB increase systolic compression during exercise with a preserved hemodynamic indices. Invasive hemodynamic evaluation of MB might be better assessed with FFR at rest.
52
CHAPTER 13
Fractional flow reserve to guide and to assess coronary
artery bypass grafting
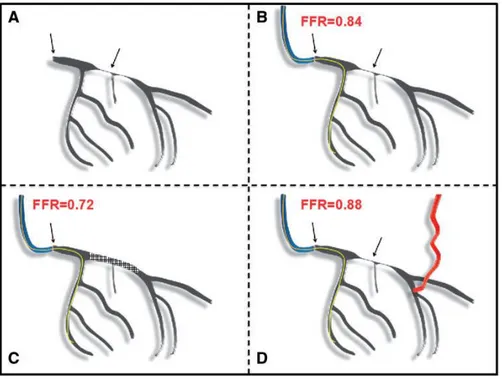
The aim of this review is to highlight the role of invasive functional evaluation in patients in whom CABG is indicated, and to examine the clinical evidence available in favour of FFR adoption in these patients, outline appropriate use, as well as point out potential pitfalls. FFR after CABG will also be reviewed, highlighting its correct interpretation and adoption when applied to both native coronary arteries and bypass grafts (Figure 18). Practice European guidelines support the use of FFR to complement coronary angiography with the highest degree of recommendation (Class IA) for the assessment of coronary stenosis before undertaking myocardial revascularization when previous non-invasive functional evaluation is unavailable or not conclusive. As a result, FFR has been adopted in routine clinical practice to guide clinicians decision as to whether or not perform a revascularization. Of note, due to the increasing confidence of the interventional cardiologists, FFR guidance is also being implemented to indicate or guide CABG. This is in anticipation of supportive clear-cut evidence, since recommendations for FFR adoption were based on randomized clinical trials investigating PCI strategies in which patients with typical indications for CABG were excluded (e.g. left main disease, valvular disease, and coronary anatomy unsuitable for PCI). Based on the critical appraisal of the literature, FFR can play an important role in risk stratification and determining management strategy of patients either
53 before or after CABG. The available data are mostly observational and seem to support the reliability and prognostic role of FFR in these patients. While waiting for the results of ongoing RCTs, FFR can be used to guide revascularization strategies, taking into account the divergent visions of the cardiac surgeons who aim for once-in-a-lifetime treatment of the patients, and that of the interventional cardiologists who have the option of deferring percutaneous revascularization to a later stage.
Figure 18: Schematic representation of a left coronary artery with sequential stenosis of the ostial left main (LM) and proximal left anterior descending (LAD) coronary artery (A, arrows). FFR of the LM measured with the pressure wire positioned in the left circumflex artery is 0.84 (B). If the proximal LAD was stented, FFR of the LM would lower to 0.72 as a consequence of the significant increase in the subtended myocardial mass (C). If a bypass graft would be implanted distal to the LAD stenosis, FFR of the LM would either remain the same or slightly increase, as a consequence of the fact that a large part of the left coronary artery territory is now being perfused by another vascular conduit (D). FFR, fractional flow reserve.
54
Chapter 14
Impact of fractional flow reserve on surgical coronary
revascularization strategy
Background: FFR during angiography is associated with hemodynamic reclassification of coronary disease severity with significant impact on revascularization strategies. However, no prospective data exist on the impact of FFR on surgical coronary revascularization strategies.
Methods: GRAFFITI is a single-blinded, open-label, prospective 1:1 randomized controlled multi-center pilot trial comparing FFR-guided versus angiography-guided CABG surgery. Patients with a significantly diseased left anterior descending or left main stem and at least one more major coronary artery with angiographically intermediate stenosis were enrolled in the trial. First surgeons made a pure angiography-guided strategy, then patients were randomized to angiography-guided or to FFR-guided group. FFR was measured in all the intermediate stenoses in both groups, but disclosed to the surgeons only if patients were allotted to the FFR-guided strategy. Patients in the angiography-guided group were operated following the initial angiogram-based strategy. Patients in the FFR-guided group were operated according to the hemodynamic stenosis significance by FFR. In this latter group, surgeons had to detail the intended procedure before and after disclosing the FFR values.
Results: After randomization, 88 patients were included into the FFR-guided group. Among them disclosure of FFR has changed bypass strategy