Abstract
The evaluation of commercial hybrids under limited water availability is of primary importance to assess Sorghum bicolor (Moench) as potential multipurpose bioenergy crop in Mediterranean drought prone environments. Ten genotypes were grown during three growing seasons (2010, 2011 and 2012) in open field trials and in pot experiments (2014). Phenological traits, biomass production, fibre content and biomass chemical composition were measured under irrigated and rainfed condi-tions. Differences in biomass production among the ten genotypes varied across years. In a three-year experiment significant differ-ences were found among the ten genotypes in terms of duration of vegetative growth (P<0.05) and aboveground dry biomass produc-tion (P<0.1) in response to irrigated and rainfed condiproduc-tions. Among the ten genotypes analysed, the hybrid ABF306 stands for its performance in terms of biomass production and chemical composition. In fact, it showed the lowest biomass yield reduction when grown under rainfed conditions, the highest drought toler-ance index (=0.9), a °Brix value comparable to that of sweet sorghum genotypes (8.8 °Brix under rainfed conditions), lignin content that was not statistically influenced by water availability, and a lignin cellulose ratio (0.087) favourable for biogas produc-tion. The shoot transpiration efficiency and the total transpiration
efficiency recorded at high (Exp1) and low (Exp2) vapour pres-sure deficit were comparable, and sometimes higher, to that of commercial sorghum hybrids. All these characteristics make ABF306 a suitable candidate for bioenergy production in Mediterranean drought prone environments.
Introduction
In the next 40 years global population is predicted to reach 9 billion people (Godfray et al., 2010). As a consequence, agricul-ture has to meet the increasing demand for food and energy. The use of biomass to produce energy and biofuels could be a viable solution to reduce the impact of energy production on the environ-ment (Karp and Richter, 2011; McLaughlin and Walsh, 1998; Monti et al., 2012; Serra et al., 2017a, 2017b). The sustainability of bioenergy production from biomass-dedicated crops was recently proved by Amaducci et al. (2016). The widespread use of maize (Zea mays L.) as mono-crop for biogas production (Weiland, 2006) is hither to producing negative environmental impacts in terms of biodiversity loss, increase of pest intensity, and nutrients load (Schittenhelm, 2010). For these reasons, other crops, as sunflower (Helianthus annuus), miscanthus (Miscanthus sinensis), switchgrass (Panicum virgatum), hemp (Cannabis sati-va), sorghum (Sorghum bicolor) and sudan grass (Sorghum vul-gare), were proposed as alternative energy crops for biogas pro-duction (Beck et al., 2007; Richter et al., 2009; Schittenhelm, 2010; Mahmood and Honermeier, 2012).
Among these, sorghum, with its numerous types (grain, sweet and forage sorghum) providing starch, sugar and cellulose, is con-sidered an ideal crop for energy production (Dajue, 1992; Dolciotti et al., 1998; Amaducci et al., 2004; Rooney et al., 2007; Heaton et al., 2008; Serra et al., 2017a, 2017b). Sugar accumulat-ed in the stalks of sweet sorghum can be convertaccumulat-ed to ethanol by first generation processes (Sipos et al., 2009), while the large biomass production obtained with forage sorghum makes it a suit-able crop for the production of biogas (Schittenhelm and Schroetter, 2014) or for the cellulosic ethanol industry (Meki et al., 2013).
Several programmes have been carried out to breed for new sorghum genotypes with improved ethanol yield potential (Murray et al., 2008; Zhao et al., 2009) and several models were developed to estimate the theoretical ethanol yield that can be obtained from new genotypes (Han et al., 2013). In these studies, the methods used for fibre determination were expensive, time consuming and not applicable for the analysis of thousands of samples. An alternative and rapid analytic method for the determi-nation of the fibre composition is provided by near infrared reflectance spectroscopy (NIRS) technology. This technology was already used to predict the potential yield of bioethanol from switchgrass (Panicum virgatum), wheat (Triticum aestivum), rye
Correspondence: Alessandra Fracasso, Department of Sustainable Crop Production, Università Cattolica del Sacro Cuore, Via Emilia Parmense 84, 29122 Piacenza, Italy.
Tel: +39-0523-599206 - Fax +39-0523-599222. E-mail: [email protected]
Key words: Biomass chemical composition; Bioenergy production; Biomass production; Sorghum; Transpiration efficiency.
Acknowledgements: the authors gratefully acknowledge funding from the Italian Ministry of Agricultural, Food and Forestry Policies to the project BIOSEA.
Received for publication: 20 December 2016. Revision received: 3 April 2017.
Accepted for publication: 6 April 2017.
©Copyright A. Fracasso et al., 2017 Licensee PAGEPress, Italy
Italian Journal of Agronomy 2017; 12:898 doi:10.4081/ija.2017.898
This article is distributed under the terms of the Creative Commons Attribution Noncommercial License (by-nc 4.0) which permits any non-commercial use, distribution, and reproduction in any medium, provid-ed the original author(s) and source are crprovid-editprovid-ed.
Characterisation of ten commercial sorghum genotypes grown under
water-limited conditions for bioenergy production in Mediterranean environment
Alessandra Fracasso,
1Alessia Perego,
2Stefano Amaducci
11
Department of Sustainable Crop Production, Università Cattolica del Sacro Cuore, Piacenza;
2Department
(Secale cereale), triticale (Triticum secalotriticum saratoviense Meister), beet (Beta vulgaris) and maize (Zea mays) (Hao et al., 2012; Magaña et al., 2011; Pohl and Senn, 2011; Vogel et al., 2010). In 2014 it was proposed by Guimarães et al. (2014) a model for theoretical bioethanol yield prediction from cell wall structural components of sweet sorghum bagasse using NIRS technology, in order to satisfy the requirement of rapidity and low cost analysis of huge amount of sorghum samples generated during breeding pro-grams. High biomass yield, together with low lignin and high non-structural carbohydrates content, is desirable parameter when assessing the suitability of a crop for anaerobic digestion (Mahmood and Honermeier, 2012). During this process, high biomass digestibility, due to low lignin and high non-structural car-bohydrates contents, results in high yield of biogas and methane per kg of volatile solids. Methane yield per hectare is then calcu-lated as the product of methane yield, specific per each genotype, and biomass yield ha–1 achieved (Mahmood and Honermeier,
2012). The variation in biomass chemical composition existing among sorghum genotypes (Damasceno et al., 2013), and the great possibility to increase biomass yield for some forage and sorghum sudan grass hybrids (Venuto and Kindiger, 2008), are useful infor-mation in order to identify the most suitable sorghum genotypes for biogas production (Amaducci et al., 2000; Habyarimana et al., 2004b; Zhao et al., 2009).
In addition to biomass production and composition, in face of the need to use low inputs when cultivating bioenergy crops and taking into account the increasing water scarcity, the unit of biomass produced per unit of water transpired, thereafter transpira-tion efficiency (TE), is a useful trait for sorghum genotypes screen-ing and selection (Zegada-Lizarazu and Monti, 2013). Several studies reported that sorghum is well adapted to water stress con-ditions, and it performs better than other C4 species, for example maize, in Mediterranean climate (Farré and Faci, 2006; Schittenhelm and Schroetter, 2014; Amaducci et al., 2016). C4 photosynthesis and other specific morpho-physiological traits related to drought tolerance (Guiying et al., 2000; Miller and Ottman, 2010; Prasad et al., 2007) confer to sorghum high yield potential also in marginal and drought-prone environments (Mastrorilli et al., 1999; Tingting et al., 2010). In rainfed agricul-ture, enhancing TE could be a suitable strategy to achieve greater yield per unit of available water (Xin et al., 2008). A genotype with high TE could produce more biomass per unit of available soil water; in this way it could save water consumption delaying the onset of irreversible water stress damage (Xin et al., 2008). If all the above-mentioned traits (high biomass production, high TE, low lignin and non-structural carbohydrates content) coexist into one sorghum genotype, this would be the best candidate for bioenergy production.
In this study ten commercial genotypes were evaluated in terms of duration of vegetative growth, height, biomass produc-tion for three years in a North Italian environment under irrigated and rainfed conditions. Analysis of stability and relative produc-tion deficit was performed over the three years experiments. In addition, sugars content, chemical biomass composition, and TE were measured in order to characterise commercial genotypes and identify sorghum genotypes that could be cultivated for bioenergy production in North Italian environment under water limited conditions.
Materials and methods
Plant material and experimental design
Ten commercial sorghum genotypes were tested in a split-plot design field experiment repeated for three years to evaluate biomass production and biomass chemical composition at two dif-ferent levels of water availability: irrigated and rainfed conditions. Two genotypes were sweet sorghum varieties (Sucrosorgo405 and Sucrosorgo506), one a late maturing fibre sorghum hybrid (H132, Quaranta et al., 2010), six commercial biomass sorghum hybrids (Biomass133, Biomass140, Biomass150, Bulldozer, P.811 and TrudanHL), and one biomass sorghum hybrid (ABF306) devel-oped in Piacenza by Lorenzoni et al. (2005).
In 2014, eight sorghum genotypes were screened in two inde-pendent experiments to evaluate genotypic variation in terms of transpiration efficiency (TE) and identify genotypes with high TE able to achieve greater yield per unit of available water. H132 and Sucrosorgo405 were not included in this screening experiment due to lack of seeds.
Field experiment
Field trials were carried out in 2010, 2011 and 2012 at the experimental farm Vittorio Tadini. The site is located in Gariga di Podenzano, Northern Italy (44° N, 9° E), and it is characterised by mean annual precipitation ranging between 650-800 mm . The soil was a Chromic Luvisol, with a silt loamy texture (sand 12%, silt 64% and clay 24%), according to soil taxonomy (FAO, 2006), Udic Paleustalfs (U.S. Soil classification; USDA, 2014). The soil had a low percentage of carbonates, a sub-acid to neutral pH (6.9) and the CE is 14.9 meq/100 g (Perego et al., 2016).
Each year the experiment design was a split-plot with four replicates, with water treatment as the factor in the main plots and genotype as factor of the subplots. Subplot was 24 m2, 6 m long
and included 6 rows with a inter row distance of 0.7 m. Sowings were carried out on 1 June 2010, 15 June 2011, and 28 May 2012 with a target plant density of 16 plants m–2. In 2011 the sowing
date was postponed due to adverse meteorological conditions. Nitrogen fertilisation was carried out at sowing time via distribut-ing 60 kg ha–1of nitrogen in all plots as urea in order to achieve
high efficiency in terms of energy production (Amaducci et al., 2016). Weeds were controlled with a post-emergence application (3 L/ha) of Gardoprim herbicide (terbuthylazine, 500 g/L; Novartis, Basel, Switzerland). A WatchDog weather station (WatchDog2700, Spectrum Technologies, IL, USA) was installed near the experimental area to collect meteorological data and to estimate potential evapotranspiration (ET0). Under the irrigation
treatment, water was applied to restore field capacity whenever the cumulative ETc, calculated as ET0 multiplied by the crop
coeffi-cient (kc), reached 35 mm. Such a water amount replenishes the
soil moisture to field capacity when available water is 50% (soil water content of 0.21 m3m–3) that is the critical soil water content
below which sorghum yield decrease occurs (FAO, 2015). Soil water content at field capacity and wilting point (0.33 and 0.16 m3
m–3, respectively) were estimated with the Hypres pedotransfer
function (Wösten et al., 2001). The value of the sorghum kcwas
assumed to be 0.4 to 0.7 from plant emergence to jointing, 0.7 to 1.1 from jointing to bloom and 1.1 to 0.7 from bloom to kernel maturity (Doorenbos and Pruitt, 1977). Two water treatments were applied: irrigation (I) and rainfed (R). Under the I treatment, water was supplied by drip irrigation using a piping system at low pres-sure with a device for volume control.
The rainfall recorded during the growing seasons (June- Sept.) were 238, 206, and 131 mm in 2010, 2011, and 2012 respectively; irrigations were therefore 80, 120, and 258 mm in 2010, 2011, and 2012 respectively (Figure 1). The annual rainfall recorded in the area of study in 2010, 2011 and 2012 were respectively 1070 mm, 577 mm and 582 mm. Harvest was carried out at physiological maturity, from September until October according to the earliness of the genotypes. At harvest, aboveground fresh weight was deter-mined for each plot on a subsample of plants hand harvested on a surface of at least 3 m2, representative of the entire plot. The
biomass harvested was chopped and directly weighed on field with a balance mounted on the chopper. A representative subsamples of 2 kg per each plot was used to determine dry matter content at 105°C until constant weight. The aboveground dry biomass (Mg ha–1) was computed as product of the total aboveground fresh
biomass (stems, leaves, panicles) by the percentage of oven dried matter content of the corresponding subsample. Immediately after harvest, plant height, from the basal internode to the collar of the last expanded leaf, was measured on 5 plants per plot. The duration of vegetative phase was determined for each genotype from the day after emergence until 50% of the plants in a plot had reached the flowering stage. The tolerance index (TI) was calculated divid-ing the aboveground biomass production under rainfed conditions for the aboveground biomass production under well-watered con-ditions, as described by Maiti et al. (1994).
The stability of the ten sorghum genotypes was evaluated as the biomass production response to the environmental conditions over the three years’ experiment. The response of the genotypes to the environment (here represented as weather conditions varying over years) is given for each genotype and irrigation treatment by the relationship between the mean of aboveground biomass pro-duction and the stability parameter b. The b coefficient represents the slope of the linear regression between the mean of annual aboveground biomass production and the environmental index. For each year and irrigation treatment, the environmental index is calculated as the difference between the annual mean of biomass production across genotypes and the grand mean. The range between 0.8 and 1.2 identifies the optimum for stability in biomass production (Eberhart and Russell, 1966). Genotypes that fall in this range and beyond the line that identifies the mean of aboveground biomass production across years and genotypes can be considered as stable and productive.
Chemical composition of sorghum genotypes
Fibre characterisation and biomass chemical composition of a selection of nine genotypes collected in 2011 and 2012 was per-formed using NIRS (NIRSystem 6500, Perstorp Analytical Inc., Silver Spring, MD). In particular raw protein (RP), neutral deter-gent fibre (NDF), acid deterdeter-gent fibre (ADF), acid deterdeter-gent lignin (ADL), cellulose (C) and hemicellulose (H) were estimated according to Berardo et al. (2002). Samples were oven dried at 70°C to constant weight, grounded to 1 mm texture (Berardo et al., 2002) then enclosed in stationary metal ring cups (36 mm inside diameter). The reflectance was determined by scanning samples twice using the wavelength range 750-2498 nm at 2 nm intervals, with the ring cup rotated 90° between scans. The mean of the two scans was used for data analysis. The equation models for NIRS prediction were developed using the algorithm CALIBRATE (v4.2, Infrasoft International/Foss NIRSystems) with the modified partial least squares regression (MPLS) option (Berardo et al., 1997; Redaelli and Berardo, 2007).
In addition, five plants per plot were harvested two weeks after flowering, to estimate the soluble sugar content of sorghum juice.
The stem juice was extracted using a three roller mill and then °Brix was evaluated with an hand-held digital refractometer (PR-101a; Atago Co., Tokyo, Japan).
Transpiration efficiency experiment
The first transpiration efficiency experiment was carried out in July 2014 (Exp1) and the second one in August 2014 (Exp2). The daily minimum, average and maximum temperature values were in Exp1 20, 24 and 28°C, respectively, while in Exp2 they were 19, 22 and 24°C. The average of vapour pressure deficit (VPD), calcu-lated according Jones (1992), was 2.2 kPa in Exp1 and 1.9 kPa in Exp2. Three seeds were planted in 2-liter plastic pots 14 cm of diameter and 16 cm high, filled with black peat [Vigorplant 70 L, Growing Medium, Vigorplant Italia srl., Fombio (LO), Italy], and watered until dripping from the bottom. Seven days after emer-gence (DAE) the seedlings were thinned to one per pot and 1 L of water and fertiliser (Universal fertiliser-KB, Scotts, Marysville, OH, USA) were added to each pot. The pots were then covered from both ends with specific plastic bags permeable to air and impermeable to water vapour following the procedure described by Xin et al. (2008). A small slit was made on the top bag to let the sorghum plant grow through it. This slit was sealed with adhesive packing tape to prevent water loss by evaporation. Each pot was subsequently weighed to determine the initial pot weight.
Following a completely randomised block design all the pots, four pots per genotype (each pot containing one plant), were placed outdoor for 4 weeks, from approximately the 3rdto the 8th
leaf stage (BBCH 13-18). Pots were rearranged every day to avoid any effect of light heterogeneity. The final pot weight (including the aboveground biomass and roots) was measured at the end of the experiment. The water transpired by each plant was calculated by subtracting the final pot weight from the initial weight. Aboveground biomass (shoots hereafter) and roots were both col-lected at the end of the experiment. Roots were retrieved by wash-ing the pottwash-ing mix core on a wire mesh (2 mm). Shoots and roots dry weight were measured after drying at 105°C until the samples reached a constant weight. The transpiration efficiency was calcu-lated for shoot (shoot transpiration efficiency, STE) and total dry biomass (shoots+roots, total transpiration efficiency, TT) dividing the dry weight (of shoot or the total dry biomass) by the total amount of water transpired. For the entire duration of the experi-ment, daily temperature and air relative humidity were recorded using a µlogger (Zeta Tech Ltd, Cambridge, UK).
Statistical analysis
Data were analysed by a multivariate analysis of variance (α=0.05) with SPSS software (IBM Statistics 21); the model set up took into account the split-plot design of the field trial, where the two fixed factors were irrigation (whole-plot factor) and genotype (sub-plot factor), while year was treated as a random effect. The model was set up following the model reported by McIntosh (1983) for the split-plot scheme design. The significance of differ-ences between groups was analysed by the Sidak post-hoc test.
The statistical analysis on the transpiration efficiency data gathered under the trial carried out in pots (4 pots per each geno-types) during 2014 was based on a completely randomised design separately in Exp1 and Exp2. The significance of differences between groups was analysed by the Tukey’s post-hoc test. A linear correlation test was executed for the two experiments (Exp1 and Exp2) between: i) STE and shoot biomass, ii) TTE and total biomass, iii) shoot biomass and the total amount of water tran-spired, iv) total biomass and the total amount of water transpired.
Results
Phenological characterisation and biomass production
in field
Minimum and maximum air temperature, amount of rainfall and irrigation water applied during the three growing seasons (May-Sept. of 2010, 2011 and 2012) are reported in Figure 1. On average minimum air temperatures were similar across the three years of study, whereas the maximum air temperature was on aver-age highest in 2012 (28.1°C). The total amount of rainfall recorded in 2012 (131 mm) was approximately 45% and 30% lower than the
rainfall recorded in 2010 and 2011 respectively. As a consequence, the highest amount of irrigation (258 mm) was applied in 2012. The rainfall distribution along the growing seasons was different across the years; in 2010 and 2011 rainfall was higher in June (109 and 144 mm in 2010 and 2011, respectively) than in July and August (34 and 68 mm in July 2011 and August 2010, respective-ly) whilst only 12, 14 and 24 mm of rainfall were recorded in 2012 in June, July and August. The amount of rainfall in September was comparable among the three years (Figure 1).
The genotypes TrudanHL, P.811 and H132 had in the three years of study the longest vegetative growth (calculated as the number of days from emergence until 50% of the plants was flow-ering), whilst Sucrosorgo405 and ABF306 the lowest (Table 1). It
Table 1. Duration of the vegetative growth calculated from emergence to flowering of 50% of the plants recorded in the three growing seasons (2010, 2011 and 2012) under rainfed and irrigated conditions.
Genotype 2010 2011 2012 R I R I R I ABF306 82c 78c 78d 75d 96c 86cd Biomass133 93b 94b 90c 89c 107c 99bc Biomass140 96ab 97b 95c 96b 117ab 105b Biomass150 96ab 96b 103b 107ab 117ab 108b Bulldozer 94b 96b 103b 101b 111bc 108b H132 99ab 99a 106ab 105ab 111bc 97bc P.811 94b 96b 111a 110a 120a 120a Sucrosorgo405 80c 82c 79d 76d 82d 81d Sucrosorgo506 92b 90b 88c 86c 105c 93c TrudanHL 102a 105a 108ab 105ab 120a 120a R, rainfed conditions; I, irrigated conditions. a-dValues within a column followed by the same letter are not significantly different at the P=0.05 level by Sidak post-hoc test. In column R-I, the result of the pairwise
com-parison between the effects of R and I on the duration of the vegetative is reported.
Figure 1. Daily minimum (Tmin) and maximum (Tmax) temperature, rainfall and irrigation recorded in 2010 (A), 2011 (B) and 2012 (C) during the growing period, from the end of May until the end of September at the experimental site. The summary of rain and irri-gation amount in the three years of the experiment is represented in panel (D).
A
B
is interesting to note that the significance (P<0.05, Table 2) of the threefold interaction Genotype x Irrigation x Year for the vegeta-tive growth duration was due to the significant response of the genotypes to the irrigation treatment that occurred in 2012, when the vegetative period of ABF306, H132, Sucrosorgo506 and all the biomass genotypes was shorter in irrigated conditions than in the rainfed ones (Table 1).
The interaction Irrigation×Year was significant (P<0.001, Table 2) for the aboveground biomass production as the irrigated condition resulted in higher production with respect to the rainfed condition in 2010 and in 2012, but not in 2011. Also the interaction Genotype x Year was significant (P<0.001, Table 2) for the above-ground biomass production. In 2010, the aboveabove-ground biomass production of H132, ABF306 and Biomass150 was significantly higher than the biomass production of Sucrosorgo405, Biomass133, TrudanHL, and P.811 (Figure 2). The aboveground biomass production of Biomass150 was again the highest in 2011, together with Bulldozer and Biomass133, and it was significantly different from TrudanHL, Sucrosorgo405 and P.811 (Figure 2). In 2012, Sucrosorgo405, Biomass133, Biomass150 and ABF306 resulted in the highest production compared to TrudanHL and H132 (Figure 2). Sucrosorgo506, Bulldozer, ABF306, H132 and Biomass140 had a high relative aboveground biomass production (calculated as the percentage of the mean production of each geno-type in each irrigation treatment and the mean production across genotypes in each irrigation treatment) together with a positive value of relative production deficit in biomass production (Figure 3). For each genotype, the deficit in biomass production is the differ-ence between the relative mean production under rainfed condi-tions and the relative mean production under irrigation. P.811 and Sucrosorgo405, on the other hand, had low relative aboveground biomass production and negative value of relative production deficit (Figure 3). The analysis of stability and reactivity to the environment of the ten genotypes studied highlighted that under rainfed conditions Bulldozer is the genotype characterised by high aboveground biomass production and the highest stability. Biomass150 and ABF306 had higher biomass production than Bulldozer, but a value of stability close to the maximum threshold of acceptance (Figure 4). Under irrigated conditions, Biomass140,
Biomass150 and Sucrosorgo506 had high biomass production and an acceptable value of stability. ABF306 was characterised by high aboveground biomass production, but also high reactivity to the environment and relatively low stability (Figure 4). The TI (Maiti et al., 1994) was calculated to screen drought tolerance among the ten genotypes. TI was calculated only in 2012, when the low rain-fall induced a large genotype dependent response to the water treatment, and the Irrigation treatment was significant. ABF306 resulted in significant higher TI than Biomass133 and P.811 (P<0.05, Figure 5).
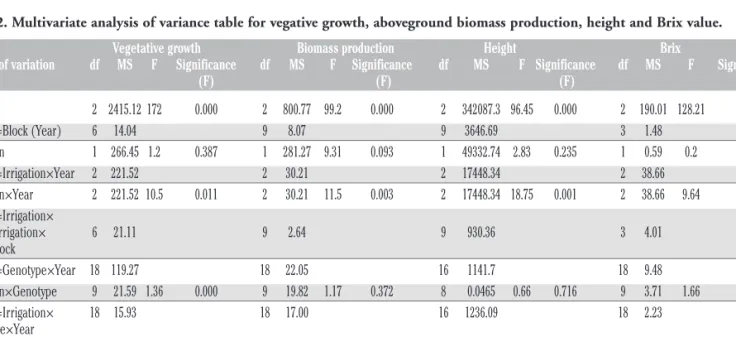
Table 2. Multivariate analysis of variance table for vegative growth, aboveground biomass production, height and Brix value. Vegetative growth Biomass production Height Brix
Source of variation df MS F Significance df MS F Significance df MS F Significance df MS F Significance (F) (F) (F) (F)
Year 2 2415.12 172 0.000 2 800.77 99.2 0.000 2 342087.3 96.45 0.000 2 190.01 128.21 0.001 Error 1=Block (Year) 6 14.04 9 8.07 9 3646.69 3 1.48 Irrigation 1 266.45 1.2 0.387 1 281.27 9.31 0.093 1 49332.74 2.83 0.235 1 0.59 0.2 0.913 Error 2=Irrigation×Year 2 221.52 2 30.21 2 17448.34 2 38.66 Irrigation×Year 2 221.52 10.5 0.011 2 30.21 11.5 0.003 2 17448.34 18.75 0.001 2 38.66 9.64 0.049 Error 3=Irrigation× Block+Irrigation× 6 21.11 9 2.64 9 930.36 3 4.01 Year×Block Error 4=Genotype×Year 18 119.27 18 22.05 16 1141.7 18 9.48 Irrigation×Genotype 9 21.59 1.36 0.000 9 19.82 1.17 0.372 8 0.0465 0.66 0.716 9 3.71 1.66 0.171 Error 5=Irrigation× 18 15.93 18 17.00 16 1236.09 18 2.23 Genotype×Year Genotype×Year 18 119.27 13 0.000 18 22.05 3.73 0.000 16 1141.7 1.42 0.141 18 9.48 3.64 0.000 Irrigation×Genotype×Year 18 15.93 1.74 0.043 18 17.00 2.88 0.000 16 1236.09 1.53 0.095 18 2.23 0.85 0.631 Within residuals error 108 9.16 162 5.91 144 805.63 54 2.61
df, degree of freedom; MS, mean square; F, Fischer-f.
Figure 2. Aboveground dry biomass (Mg ha–1) recorded in 2010, 2011 and 2012 for the ten genotypes under study. Values with the same letter are not significantly different at P<0.05 according to the Sidak's test.
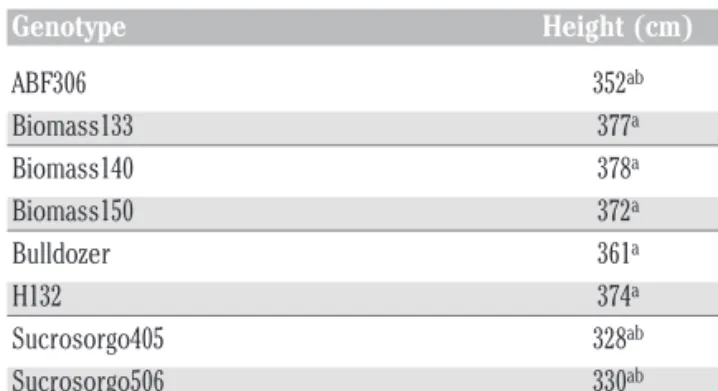
Plant height was affected by Genotype (P<0.001, Table 2) and the Irrigation x Year interaction (P<0.001, Table 2). The irrigated condition resulted in significant higher height only in 2012, prob-ably due to the scarce precipitation recorded at the beginning of that cropping season. Biomass133, Biomass140, Biomass150, Bulldozer and H132 were on average during the three years the tallest genotypes whilst TrudanHL the shortest one (Table 3).
Sugar content and qualitative assessment of sorghum
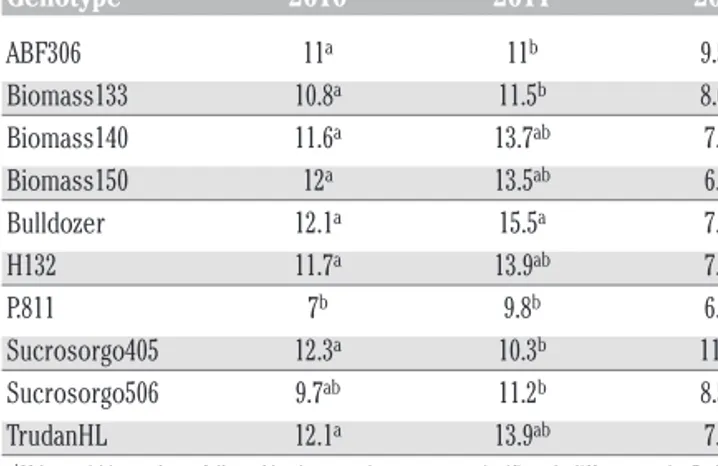
The statistical analysis of concentration of soluble sugar in the juice (°Brix) highlighted a significant Irrigation x Year and Genotype x Year interaction (P<0.05, Table 2). Brix values were not statistically different between irrigation treatments in 2010, whilst they were statistically different in 2011 and 2012 (data not shown). An opposite trend was observed in these two years, although the interaction Irrigation x Year was not significant: in 2011 higher Brix values were recorded under rainfed conditions,
while in 2012 the higher Brix values were recorded under irrigated conditions. In 2010 the lowest Brix values was recorded for P.811 (Table 4). In 2011, Bulldozer had the highest Brix value compared to ABF306, Biomass133, P.811, Sucrosorgo405 and Sucrosorgo506 (Table 4). In 2012, Sucrosorgo405 showed the highest Brix value compared to Biomass140, Biomass150, Bulldozer, H132, P.811 and TrudanHL (Table 4). H132 and Biomass140 were the genotypes with high stability and high Brix value (Figure 6); TrudanHL and Bulldozer were characterised by higher Brix value but they fall under the stability range previously identified; ABF306 and Sucrosorgo405 had, on the other hand, very high Brix value and are characterised by a string reactivity to the environment (Figure 6).
Regarding the quality parameters estimated by NIRS technol-ogy, the Irrigation x Genotype x Year interaction was found to be significant for the raw protein (RP), neutral detergent fibre (NDF)
Table 3. Overview of plant height (cm) during the three growing seasons (2010, 2011 and 2012). Genotype Height (cm) ABF306 352ab Biomass133 377a Biomass140 378a Biomass150 372a Bulldozer 361a H132 374a Sucrosorgo405 328ab Sucrosorgo506 330ab TrudanHL 294b
a,bValues within a column followed by the same letter are not significantly different at the P=0.05 level
by Sidak post-hoc test.
Figure 3. Relative biomass production in response to water treat-ment. The relative biomass production is calculated as percentage of the mean production of each genotype in each irrigation treat-ment and the mean production across genotypes in each irriga-tion treatment. For each genotype, the deficit in biomass produc-tion is the difference between the relative mean producproduc-tion under rainfed conditions and the relative mean production under irri-gation.
Figure 4. Stability of biomass production of the ten genotypes in response to the environmental conditions. The response of the geno-types to the environment (here represented as weather conditions varying over years) is given for each genotype and irrigation treatment by the relationship between the mean of aboveground biomass production and the stability parameter b. The b coefficient represents the slope of the linear regression between the mean of annual aboveground biomass production and the environmental index. Horizontal bold lines between 0.8 and 1.2 identify the optimum for stability in biomass production (Eberhart and Russell, 1966). Vertical dotted lines represent the mean of biomass production recorded under rainfed and irrigated conditions.
and the cellulose (C) content (Table 5). A significant interaction Genotype x Year was detected for acid detergent fibre (ADF), acid detergent lignin (ADL) (Table 5). Under rainfed conditions in 2011, the RP content of ABF306 and Sucrosorgo405 was statisti-cally higher than the RP content of Biomass140, Biomass150 and Bulldozer (Table 6). Under irrigated conditions in 2012, the RP content was for Biomass150 and H132 higher than Biomass140, Bulldozer, Sucrosorgo405 and TrudanHL (Table 6). Under rainfed conditions in 2011, Biomass140, Biomass150, Bulldozer, H132 and Sucrosorgo506 had a higher NDF content than Sucrosorgo405. In the same year, under irrigated conditions, Biomass140, Biomass150 and Sucrosorgo506 had higher values of NDF than ABF306, and TrudanHL. In 2012 significant differences in NDF were detected only under rainfed conditions; Sucrosorgo506 had higher NDF content than Biomass133 (Table 6). The cellulose con-tent was statistically different between irrigation treatments only in 2011. In this year Biomass 150 and Bulldozer had the highest value of C content than Biomass133, ABF306 and Sucrosorgo405. Under irrigated conditions, Biomass150 had higher C content than H132, TrudanHL and ABF306 (Table 6). The ADL content of Biomass140 and Biomass150 was higher than ABF306, Sucrosorgo405 and TrudanHL in 2011 (Table 7). In 2012, ABF306 showed higher ADL content than Biomass133 (Table 7). Lignin cellulose ratio was below the threshold value of 0.08 (Kanapeckas et al., 2011) for Biomass133, Bulldozer, H132, Sucrosorgo405 and TrudanHL (Figure 7). The ADF content was in 2011 higher in Biomass140, Biomass150, Bulldozer and Sucrosorgo506 than in ABF306 and Sucrosorgo405 (Table 7). In 2012 the ADL content was higher in ABF306 and Sucrosorgo506 than in Biomass133 and TrudanHL (Table 7). No differences in the hemicellulose (H) con-tent were detected among the genotypes (Table 7).
Genotypic variation of transpiration efficiency in sorghum
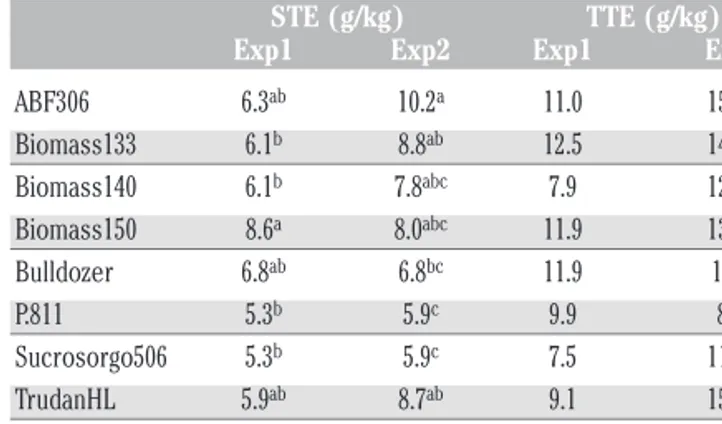
The genotypic variation in STE and TTE was calculated sepa-rately for each experiment (Table 8). The effect of Genotype was significant on STE in Exp1 (P<0.05, Table 9), while it was signif-icant for STE and TTE in Exp2 (P<0.001, Table 9). The two exper-iments differed only for the weather conditions and in particular for vapour pressure deficit (VPD). The significant interaction Genotype x Experiment was found only for the STE (P<0.001, Table 10) and not for TTE.
In both experiments, a significant correlation was found between TE and biomass production (P<0.01, r=0.75 and r =0.84 for STE and TTE in Exp1, and r=0.60 and r =0.70 for STE and TTE in Exp2, Figure 8) while no correlation was found between transpirationefficiency and water consumed (P<0.05, r=-0.13 and r=-0.40 for STE and TTE in Exp1, and r=0.3 and r= 0.52 for STE and TTE in Exp2; Figure 8). The correlation between STE and TI was not significant (r=0.06).
Discussion
The sorghum genotypes evaluated in this three-year field experiment showed a biomass production comparable to that obtained in other experiments carried out in Northern Italy (Habyarimana et al., 2004a, 2004b; Lorenzoni et al., 2005). The mean aboveground dry matter production under irrigated condi-tions was lower in this experiment compared to the 25.1 Mg ha–1
found by Miller and Ottman (2010) for well-watered conditions in Arizona, USA, and compared to the 29.4 Mg ha–1 reported by
Mastrorilli et al. (1995) in Southern Italy. These high biomass
pro-Table 4. Overview of soluble sugar content in the juice (°Brix) during the three growing seasons (2010, 2011 and 2012) under rainfed and well-watered conditions.
Year Genotype 2010 2011 2012 ABF306 11a 11b 9.5ab Biomass133 10.8a 11.5b 8.6ab Biomass140 11.6a 13.7ab 7.7b Biomass150 12a 13.5ab 6.6b Bulldozer 12.1a 15.5a 7.5b H132 11.7a 13.9ab 7.6b P.811 7b 9.8b 6.2b Sucrosorgo405 12.3a 10.3b 11.7a Sucrosorgo506 9.7ab 11.2b 8.5ab TrudanHL 12.1a 13.9ab 7.8b
a,bValues within a column followed by the same letter are not significantly different at the P=0.05 level
by Sidak post-hoc test.
Figure 5. Tolerance index calculated for the 10 genotypes for 2012 growing season as the ratio between the total aboveground dry biomass produced under rainfed condition and the total aboveground dry biomass produced under irrigated conditions. Values with the same letter are not significantly different at P<0.05 according to the Sidak’s test.
Figure 6. Stability of °Brix value of the ten genotypes in the three years of experimentation. The soluble sugar content (°Brix) of the ten genotypes was recorded during the three years of experimen-tation. The b coefficient represents the slope of the linear regres-sion between the mean of annual °Brix value and the environ-mental index. Horizontal bold lines between 0.8 and 1.2 identify the optimum for stability in biomass production (Eberhart and Russell, 1966). Vertical dotted line represents the mean of bio-mass production recorded under rainfed and irrigated conditions.
ductions could be a consequence of the longer growing time (on average 153 days for Mastrorilli et al., 1995) and the higher tem-peratures recorded by these authors during their experiments. In this study the aboveground dry matter variation among years reflects the different sowing dates and durations of the growing periods. In 2011, the lowest values of dry biomass production recorded both under rainfed and irrigated conditions were due to the late sowing date (June 15th) and consequently a short growing
period. In 2012 the high average temperature and low rainfall (28.1°C and 131 mm of rain) provided a suitable condition to dif-ferentiate the response of the genotypes under water limitation, highlighting that all the genotypes analysed had a significant reduction in biomass production under rainfed conditions. The analysis of TI calculated in the same year was useful to highlight the drought tolerance of ABF306 compared to Biomass133 and P.811. On average, ABF306 had also high relative aboveground biomass production and high adaptability to water stress, together with the other biomass sorghum Biomass140, H132 and Bulldozer. ABF306 showed an accetable trade-off between stability,
reactivi-Figure 7. Lignin cellulose ratio of nine genotypes studied. Lignin cellulose ratio is calculated as the ratio between acid detergent lignin and cellulose content estimated by near infrared reflectance spectroscopy technology. According to Kanapeckas et al. (2011), values below 0.08 allow best anaerobic microbe digestion.
Table 5. Multivariate analysis of variance table for raw protein, neutral detergent fibre, cellulose, acid detergent fibre, acid detergent lignin, and hemicellulose content.
Source of variation df Significance (F)
RP NDF C ADF ADL H Year 1 0.078 0.066 0.593 0.304 0.127 0.081 Error 1=Block(Year) 2 Irrigation 1 0.021 0.085 0.549 0.511 0.615 0.084 Error 2=Irrigation×Year 1 Irrigation×Year 1 0.975 0.438 0.591 0.230 0.074 0.197 Error 3=Irrigation×Block+Irrigation×Year×Block 2 Genotype 8 0.405 0.273 0.707 0.277 0.299 0.438 Error 4=Genotype×Year 8 Irrigation×Genotype 8 0.602 0.713 0.421 0.472 0.431 0.969 Error 5=Irrigation×Genotype×Year 8 Genotype×Year 8 0.004 0.073 0.000 0.013 0.032 0.075 Irrigation×Genotype×Year 8 0.022 0.050 0.000 0.152 0.416 0.085 Within residuals error 32
df, degree of freedom; F, Fischer-f; RP, raw protein; NDF, neutral detergent fibre; C, cellulose; ADF, acid detergent fibre; ADL, acid detergent lignin; H, hemicellulose. Table 6. Overview of raw protein, neutral detergent fibre, and cellulose content (%), in 2011 and 2012 under rainfed and irrigated con-ditions. RP NDF C 2011 2012 2011 2012 2011 2012 Genotype R I R I R I R I R I R I ABF306 6.3a 6.3 6.0 6.1ab 50ab 49b 58ab 54 21c 23c 25 25 Biomass133 5.5ab 5.1 6.5 6.3ab 51ab 52ab 52b 50 25b 25 26 Biomass140 4.5b 5.1 5.0 5.7b 53a 54a 54ab 53 26ab 27ab 24 25 Biomass150 4.6b 5.0 6.3 6.9a 55a 57a 55ab 55 28a 30a 24 25 Bulldozer 5.3b 5.6 5.0 5.6b 54a 53ab 54ab 51 27a 26ab 26 24 H132 5.2ab 6.1 6.3 7.4a 53a 51ab 57ab 53 26ab 25b 27 26 Sucrosorgo405 6.2a 5.7 5.9 5.6b 47b 52ab 53ab 56 20c 26ab 23 28 Sucrosorgo506 5.3ab 6.3 5.6 6.8ab 54a 54a 59a 56 26 27ab 24 24 TrudanHL 5.6ab 5.0 5.9 5.5b 50ab 49b 53ab 50 24ab 25b 25 25 RP, raw protein; NDF, neutral detergent fibre; C, cellulose; R, rainfed conditions; I, irrigated conditions. a-cValues within a column followed by the same letter are not significantly different at the P=0.05 level by Sidak
ty to the environment and aboveground biomass production; the ABF306 stability increased under rainfed conditions, enabling to speculate that ABF306 could be a suitable candidate for sorghum cultivation in drought prone environment. Furthermore, consider-ing the short flowerconsider-ing time and the high biomass production in rainfed conditions (18.3 Mg ha–1), this genotype could be a valid
candidate for biomass production in water limited conditions. A full characterisation of sorghum genotypes for bioenergy production has to take into account not only biomass production, but also the soluble sugar content (Ratnavathi et al., 2010) and the chemical composition of the biomass. Miller and Ottman (2010) found that water stress imposed in their study did not increase the sugar concentration in sweet sorghum, while in the present study the °Brix value, measured in three years of experi-mentation under rainfed and irrigated conditions, was affected by irrigation treatment in 2011 and 2012 with two opposite trend. The reason of this different trend could be found in the different amount of rainfall recorded in the first period of the growing
sea-Table 7. Overview of acid detergent lignin, acid detergent fibre, and hemicellulose content, expressed in percentage, in 2011 and 2012. ADL ADF H Genotype 2011 2012 2011 2012 Mean 2011-2012 ABF306 1.6b 2.5a 23b 31a 25 Biomass133 2.1ab 1.3b 27ab 25b 22 Biomass140 2.5a 2.1ab 29a 29ab 24 Biomass150 2.7a 1.9ab 31a 30ab 25 Bulldozer 2.2ab 1.9ab 29a 27ab 23 H132 2ab 1.6ab 27ab 28ab 24 Sucrosorgo405 1.6b 1.8ab 24b 29ab 24 Sucrosorgo506 2.1ab 2.1ab 29a 33a 26 TrudanHL 1.9ab 1.6ab 2ab 26b 22 ADL, acid detergent lignin; ADF, acid detergent fibre; H, hemicellulose.a,bValues within a column
fol-lowed by the same letter are not significantly different at the P=0.05 level by Sidak post-hoc test.
Figure 8. Correlation existing between transpiration efficiency and dry biomass production, and between transpiration efficiency and water transpired. Four correlations were performed between i) the dry biomass production and the transpiration efficiency calculated separately as shoot transpiration efficiency (STE) and total transpiration efficiency (TTE), and ii) the water transpired (kg) and the transpiration efficiency calculated separately as STE and TTE for the two experiments carried out (Exp1 and Exp2) in 2014.
sons (June-July) in 2011 and 2012, being extremely abundant in 2011 and extremely scarce in 2012. Despite the difference in meteorological conditions, ABF306, Biomass140, Bulldozer, P.811 and TrudanHL did not show significant differences in the concentration of soluble sugar in the juice between years or water treatments, therefore these genotypes could be considered a suit-able choice when a constant and stsuit-able °Brix are requested for bioethanol production. It is interesting to note that the biomass genotype ABF306 had on average a higher °Brix value than the sweet genotype Sucrosorgo506.
All the quality parameters related to fibre composition varied a lot depending on the Irrigation or the interaction Genotype x Year and Irrigation x Genotype x Year. Cellulose, hemicellulose and lignin are respectively the first, the second and the third most abundant organic compounds (Hendrick and Zeeman, 2009). Hemicellulose is a physical barrier that surrounds the cellulose fibres and protects the cellulose from enzymatic attack during the gasification process (Taherzadeh and Karimi, 2008). Cellulose and hemicellulose are cemented together by lignin, which is responsible for the integrity and structural rigidity of the cell wall and is the most recognised factor responsible for recalcitrance of lignocellulosic materials to enzymatic degradation (Taherzadeh and Karimi, 2008). Being water supply the main factor affecting the synthesis of secondary cell walls in plants (Carmi et al., 2006), cellulose, hemicellulose and ADF increased in response to water availability. Therefore, a restriction in water supply could reduce the cellulose, hemicellulose, ADF and lignin (ADL) con-tent in the stems in order to have a more efficient conversion pro-cess to bioenergy. The cellulose content was significantly affect-ed by irrigation treatment in 2011 and 2012. Whilst in 2011, sig-nificant differences were highlighted among the genotypes both under rainfed and irrigated conditions, in 2012 there were no sig-nificant differences among the genotype in the two water treat-ment. The lignin cellulose ratio depicts the suitability of the genotype to anaerobic microbe digestion for biogas production (Kanapeckas et al., 2011).
High contents of nitrogenous substances (RP), high content of soluble sugars (°Brix), low lignin (ADL) content and high non-structural carbohydrates (ADF, NDF), combined with high biomass production, linearly correlated to the biogas production (Mahmood et al., 2013), are desirable traits in selection process for bioenergy production (Kanapeckas et al., 2011).
Transpiration efficiency, calculated with Δ13C discrimination
method developed by Farquhar et al. (1982), is a very expensive method and, despite its wide use in C3 plants, it is not applicable to a C4 plant like sorghum (Henderson et al., 1998; Lambrides et al., 2004). A method recently described by Xin et al. (2008) enables traspiration efficiency to be determined very easily and at an affordable price. Transpiration efficiency is inversely pro-portional to the VPD of the environment and is crop specific (Tanner and Sinclair, 1983). In this study at high VPD (2.2 kPa, Exp1) all the sorghum genotypes displayed lower shoot transpi-ration efficiency (STE) compared to the value obtained in Exp2 carried out at lower VPD conditions (1.9 kPa). This result is con-sistent with that found by other authors (Tanner and Sinclair, 1983; Xin et al., 2008). The significant interaction Genotype x Experiment (G x E), found only for the STE, highlighted that the effect of VPD on sorghum root system is limited. Furthermore, the correlation between biomass production and STE (and TTE) and between water transpired and STE (and TTE), showed that in sorghum an increase in transpiration efficiency is driven mainly by an increase of biomass production rather than a reduction of transpiration. For this, selecting genotypes with high
transpira-tion efficiency reduces the chance to select plants with low biomass productivity, as often happens when the selection is based on the Δ13discrimination method (Condon et al., 2002;
Impa et al., 2005).
The lack of correlation between transpiration efficiency and TI (r=0.06) confirms that the traits controlling transpiration effi-ciency are different from those controlling drought tolerance (Xin et al., 2008). Therefore, the development of new sorghum genotypes, well adapted to drought prone environment and with a better use of water resources (Xin et al., 2008), could be achieved combining high transpiration efficiency traits with high drought tolerance ones.
Table 8. Average of shoot transpiration efficiency and total tran-spiration efficiency of eight sorghum genotypes recorded in the 1stand 2ndexperiment carried out in 2014.
STE (g/kg) TTE (g/kg) Exp1 Exp2 Exp1 Exp2
ABF306 6.3ab 10.2a 11.0 15.1ab Biomass133 6.1b 8.8ab 12.5 14.6ab Biomass140 6.1b 7.8abc 7.9 12.2bc Biomass150 8.6a 8.0abc 11.9 13.5ab Bulldozer 6.8ab 6.8bc 11.9 17.5a P.811 5.3b 5.9c 9.9 8.1c Sucrosorgo506 5.3b 5.9c 7.5 11.8bc TrudanHL 5.9ab 8.7ab 9.1 15.9ab Mean 6.3 7.8 10.2 13.6
STE, shoot transpiration efficiency; TTE, total transpiration efficiency. a-cValues within a column followed
by the same letter are not significantly different at the P=0.05 level by Tukey’s honestly significant dif-ference test.
Table 9. One-way univariate analysis of variance table for shoot and total transpiration efficiency recorded at the 1st and 2nd experiment.
STE TTE
df MS F Significance df MS F Significance
Exp1 Genotypes 7 3.87 3.84 P<0.05 7 12.3 1.81 Exp2 Genotypes 7 7.49 9 P<0.001 7 26.94 8.8 P<0.001
STE, shoot transpiration efficiency; TTE, total transpiration efficiency; df, degree of freedom; MS, mean square; F, Fischer-f.
Table 10. Two-factor univariate analysis of variance table for shoot and total transpiration efficiency.
STE TTE df MS F Significance df MS F Significance Genotypes 7 5.85 5.69 P<0.001 7 25.7 5.13 P<0.001 Experiments 1 24.5 23.87 P<0.001 1 120 24 P<0.001 Genotypes× 7 3.4 3.29 P<0.001 7 7.72 1.5 Experiments
STE, shoot transpiration efficiency; TTE, total transpiration efficiency; df, degree of freedom; MS, mean square; F, Fischer-f.
Conclusions
In conclusion, the genotypic characterisation performed in the present work enabled different sorghum types to be assessed for their suitability for cultivation as a bioenergy crop in Northern Italy under rainfed conditions. High and constant biomass production, also under rainfed conditions, high and constant °Brix value, low lignin content and high non-structural carbohydrates content, good performance in terms of transpiration efficiency under high VPD conditions, are the desirable traits for this purpose. The ABF306 dif-fers and stands out from the other biomass sorghum and the sweet sorghum genotypes due to a favourable combination of these traits. Its high tolerance index combined with stable soluble sugar content (°Brix) and relatively high stability in biomass production, cellulose and acid detergent fibre content that are not affected by water avail-ability, and a relatively high transpiration efficiency under high VPD conditions, make this genotype a suitable candidate for bioenergy production in the area of the present study.
References
Amaducci S, Amaducci MT, Benati R, Venturi G, 2000. Crop yield and quality parameters of four annual fibre crops (hemp, kenaf, maize and sorghum) in the North of Italy. Ind. Crop. Prod. 11:179-86.
Amaducci S, Colauzzi M, Battini F, Fracasso A, Perego A, 2016. Effect of irrigation and nitrogen fertilization on the production of biogas from maize and sorghum in a water limited environ-ment. Europ. J. Agron. 76:54-65.
Amaducci S, Monti A, Venturi G, 2004. Non-structural carbohy-drates and fibre components in sweet and fibre sorghum as affected by low and normal input techniques. Ind. Crop. Prod. 20:111-8.
Beck PA, Hutchison S, Gunter SA, Losi TC, Stewart CB, Capps PK, Phillips JM, 2007. Chemical composition and in situ dry matter and fiber disappearance of sorghum x Sudangrass hybrids. J. Anim. Sci. 85:545-55.
Berardo N, Boccardi F, Piccinini E, Ursino A, Odoardi M, 1997. La spettroscopia nel vicino infrarosso (NIRS) per l’analisi qualitativa dei foraggi. Rivista di Agronomia XXXI 1:208-11. Berardo N, Habayarimana E, Lorenzoni C, 2002. Biomass, struc-tural carbohydrates and lignin evaluation in sorghum hybrid constitutions and advanced recombinant inbred lines. Proc. 46th Italian Society of Agricultural Genetics-SIGA, Giardini
Naxos, Italy.
Carmi A, Aharoni Y, Edelstein M, Umiel N, Hagiladi A, Yosef E, Nikbachat M, Zenou A, Miron J, 2006. Effects of irrigation and plant density on yield, composition and in vitro digestibil-ity of a new forage sorghum variety, Tal, at two maturdigestibil-ity stages. Anim. Feed. Sci. Tech. 131:121-33.
Condon AG, Richards RA, Rebetzke JR, Farquhar GD, 2002. Improving intrinsic water-use efficiency and crop yield. Crop Sci. 42:122-31.
Dajue L, 1992. Developing Sweet Sorghum to Meet the Challenge of Problems on Food, Energy and Environment in 21st Century. Pp 19-34 in Proc. 1stInt. Sweet Sorghum Conference,
Beijing, China.
Dolciotti I, Mambelli S, Grandi S, Venturi G, 1998. Comparison of two Sorghum genotypes for sugar and fiber production. Ind. Crop. Prod. 7:265-72.
Doorenbos J, Pruitt WO, 1977. Crop Water Requirement. FAO Irrigation and Drainage Paper No. 24. Available from: http://www.fao.org/3/a-f2430e.pdf
Eberhart SA, Russell WA, 1966. Stability parameters for compar-ing varieties. Crop Sci. 6:36-40.
Farquhar GD, O’Leary MH, Berry JA, 1982. On the relationship between carbon isotope discrimination and the intercellular carbon dioxide concentration in leaves. Austr. J. Plant. Physiol. 9:121-37.
Farré I, Faci JM, 2006. Comparative response of maize (Zea mays L.) and sorghum (Sorghum bicolor L. Moench) to deficit irri-gation in a Mediterranean environment. Agr. Water. Manage. 341:135-43.
FAO, 2006. Guidelines for soil description, 4th edn. FAO, Rome, Italy. Available from: http://www.fao.org/docrep/019/a0541e/ a0541e.pdf
FAO, 2015. FAO Water Development and Management Unit. Crop Water Information: Sorghum. FAO, Rome, Italy. Available from: http://www.fao.org/nr/water/cropinfo_sorghum.html Godfray HCJ, Beddington JR, Crute IR, Haddad L, Lawrence D,
Muir JF, Pretty J, Robinson S, Thomas SM, Toulmin C, 2010. Food security: the challenge of feeding 9 billion people. Science 327:812-8.
Guimarães CC, Simeone MLF, Parrella RAC, Sena MM, 2014. Use of NIRS to predict composition and bioethanol yield from cell wall structural components of sweet sorghum biomass. Microchem. J. 117:194-201.
Guiying L, Weibin G, Hicks A, Chapman KR, 2000. A training Manual for Sweet Sorghum, FAO/CAAS/CAS, Bangkok, Thailand. FAO, Rome, Italy.
Habyarimana E, Bonardi P, Laureti D, Di Bari V, Cosentino S, Lorenzoni C, 2004a. Multilocational evaluation of biomass sorghum hybrids under two stand densities and variable water supply in Italy. Ind. Crop. Prod. 20:3-9.
Habyarimana E, Laureti D, Ninno MD, Lorenzoni C, 2004b. Performances of biomass sorghum [Sorghum bicolor (L.) Moench] under different water regimes in Mediterranean region. Ind. Crop. Prod. 20:23-8.
Han KJ, Pitman WD, Kim M, Day DF, Alison MW, McCormick ME, Aita G, 2013. Ethanol production potential of sweet sorghum assessed using forage fiber analysis procedures. GCB Bioenergy 5:358-66.
Hao X, Thelen K, Gao J, 2012. Prediction of the ethanol yield of dry-grind maize grain using near infrared spectroscopy. Biosystems Eng. 112:161-70.
Heaton EA, Flavell RB, Mascia PN, Thomas SR, Dohleman FG, Long SP, 2008. Herbaceous energy crop development: recent progress and future prospects. Curr. Opin. Biotech. 19:202-9. Henderson S, von Caemmerer S, Farquhar GD, Wade LJ, Hammer GL, 1998. Correlation between carbon isotope discrimination and transpiration efficiency in lines of the C4 species Sorghum bicolor in the glasshouse and the field. Aust. J. Plant. Physiol. 25:111-23.
Hendriks ATWM, Zeeman G, 2009. Pretreatments to enhance the digestibility of lignocellulosic biomass. Bioresource Technol. 100:10-8.
Impa SM, Nadaradjan S, Boominathan P, Shashidhar G, Bindumadhava H, Sheshshayee MS, 2005. Carbon isotope dis-crimination accurately reflects variability in WUE measured at a whole plant level in rice. Crop Sci. 45:2517-22.
Jones HG, 1992. Plants and microclimate. A quantitative approach to environmental plant physiology. 2nd ed. Cambridge,
Kanapeckas J, Lemežienė N, Butkutė B, Stukonis V. 2011. Evaluation of tall fescue (Festuca arundinacea Schreb.) vari-eties and wild ecotypes as feedstock for biogas production. Agriculture 98:149-56.
Karp A, Richter GM, 2011. Meeting the challenge of food and energy security. J. Exp. Bot. 62:263-71.
Lambrides CJ, Chapman SC, Shorter R, 2004. Genetic variation for carbon isotope discrimination in sunflower: association with transpiration efficiency and evidence for cytoplasmic inheritance. Crop Sci. 44:1642-53.
Lorenzoni C, Cosentino S, Foti S, Habyarimana E, 2005. Selezione di nuovi genotipi di sorgo per la produzione di biomassa. Agroindustria 1:17-25.
Magaña C, Núñez-Sánchez N, Fernández-Cabanás VM, García P, Serrano A, Pérez-Marín D, Pemán JM, Alcade E, 2011. Direct prediction of bioethanol yield in sugar beet pulp using near infrared spectroscopy. Bioresource Technol. 102:9542-9. Mahmood A, Honermeier B, 2012. Chemical composition and
methane yield of sorghum cultivars with contrasting row spac-ing. Field. Crop. Res. 128:27-33.
Mahmood A, Ullah H, Ijaz M, Javaid MM, Naeem A, 2013. Evaluation of sorghum hybrids for biomass and biogas produc-tion. Aust. J. Crop Sci. 7:1456-62.
Maiti RK, Ibarra MR, Sandoval N, 1994. Genotypic variability in glossy sorghum lines for resistance to drought, salinity and temperature stress at the seedling stage. J. Plant Physiol. 143:241-4.
Mastrorilli M, Kate N, Rana G, Steduto I, 1995. Sweet sorghum in Mediterranean climate: radiation use and biomass water use efficiencies. Ind. Crop. Prod. 3:253-60.
Mastrorilli M, Katerji N, Rana G, 1999. Productivity and water use efficiency of sweet sorghum as affected by soil water deficit occurring at different vegetative growth stages. Eur. J. Agron. 11:207-15.
McIntosh MS, 1983. Analysis of combined experiments. Agron. J. 75:153-5.
McLaughlin SB, Walsh ME, 1998. Evaluating environmental con-sequences of producing herbaceous crops for bioenergy. Biomass. Bioenerg. 14:317-24.
Meki MN, Snider JL, Kiniry JR, Raper RL, Rocateli AC, 2013. Energy sorghum biomass harvest thresholds and tillage effects on soil organic carbon and bulk density. Ind. Crop. Prod. 43:172-82.
Miller AN, Ottman MJ, 2010. Irrigation frequency effects on growth and ethanol yield in sweet sorghum. Agron. J. 102:60-70. Monti A, Barbanti L, Zatta A, Zegada-Lizarazu W, 2012. The
con-tribution of switchgrass in reducing GHG emissions. GCB Bioenergy 4:420-34.
Murray SC, Rooney WL, Mitchell SE, Sharma A, Klein PE, Mullet JE, Kresovich S, 2008. Genetic Improvement of Sorghum as a Biofuel Feedstock: II. QTL for Stem and Leaf Structural Carbohydrates. Crop Sci. 48:2180-93.
Perego A, Wu L, Gerosa G, Finco A, Chiazzese M, Amaducci S, 2016. Field evaluation combined with modelling analysis to study fertilizer and tillage as factors affecting N2O emissions:
A case study in the Po valley (Northern Italy). Agr. Ecosys. Environ. 225:72-85.
Pohl F, Senn T, 2011. A rapid and sensitive method for the evalua-tion of cereal grains in bioethanol producevalua-tion using near infrared reflectance spectroscopy. Bioresource Technol. 102:2834-41.
Prasad S, Singh A, Jain N, Joshi HC, 2007. ethanol production from sweet sorghum syrup for utilization as automotive fuel in
India. Energ. Fuel. 21:2415-20.
Quaranta F, Belocchi A, Bentivenga G, Mazzon G, Melloni S, 2010. Fibre sorghum: influence of harvesting period and bio-logical cycle on yield and and dry matter in some hybrids. Maydica 55:1737.
Ratnavathi CV, Suresh K, Kumar BSV, Pallavi M, Komala VV, Seetharama N, 2010. Study on genotypic variation for ethanol production from sweet sorghum juice. Biomass. Bioenerg. 34:947-52.
Redaelli R, Berardo N, 2007. Prediction of fibre components in oat hulls by near infrared reflectance spectroscopy. J. Sci. Food Agric. 87:580-5.
Richter F, Graß R, Fricke T, Zerr W, Wachendorf M, 2009. Utilization of semi-natural grassland through integrated generation of solid fuel and biogas from biomass. II. Effects of hydrothermal condi-tioning and mechanical dehydration on anaerobic digestion of press fluids. Grass. Forage. Sci. 64:354-63.
Rooney WL, Blumenthal J, Bean B, Mullet J, 2007. Designing sorghum as a dedicated bioenergy feedstock. Biofuel. Bioprod. Bioref. 1:147-57.
Schittenhelm S, 2010. Effect of drought stress on yield and quality of maize/sunflower and maize/sorghum intercrops for biogas production. J. Agron. Crop. Sci. 196:253-61.
Schittenhelm S, Schroetter S, 2014. Comparison of drought toler-ance of maize, sweet sorghum and sorghum-sudangrass hybrids. J. Agron. Crop. Sci. 200:46-53.
Serra P, Colauzzi M, Amaducci S, 2017a. Biomass sorghum pro-duction risk assessment analysis: A case study on electricity production in the Po Valley. Biomass Bioenerg. 96:75-86. Serra P, Giuntoli J, Agostini A, Colauzzi M, Amaducci S, 2017b.
Coupling sorghum biomass and wheat straw to minimise the environmental impact of bioenergy production. J. Clean Prod. 154:242-54.
Sipos B, Réczey J, Somorai Z, Kádár Z, Dienes D, Réczey K, 2009. Sweet sorghum as feedstock for ethanol production: enzymatic hydrolysis of steam-pretreated bagasse. Appl. Biochem. Biotech. 153:151-62.
Taherzadeh MJ, Karimi K, 2008. Pretreatment of lignocellulosic wastes to improve ethanol and biogas production: A review. Int. J. Mol. Sci. 9:1621-51.
Tanner CB, Sinclair TR, 1983. Efficient water use in crop production: research or re-search? In: Taylor, H.M., Jordan, W.R., Sinclair, T.R. (eds.), Limitations to efficient water use in crop production. American Society of Agronomy, Madison, WI, USA.
Tingting XIE, Peixi SU, Lishan S, 2010. Photosynthetic character-istics and water use efficiency of sweet sorghum under differ-ent watering regimes. Pak. J. Bot. 42:3981-94.
USDA, 2014. Keys to soil taxonomy. 12th ed. Soil Survey Staff. Available from: https://www.nrcs.usda.gov/wps/portal/nrcs/ detail/soils/survey/class/taxonomy/?cid=nrcs142p2_053580 Venuto B, Kindiger B, 2008. Forage and biomass feedstock
pro-duction from hybrid forage sorghum and sorghum-sudangrass hybrids. Jpn. Society Grassland Sci. 54:189-196.
Vogel KP, Dien BS, Jung HG, Casler MD, Masterson SD, Mitchell RB, 2010. Quantifying actual and theoretical ethanol yields for switch-grass strains using NIRS analyses. Bioenerg. Res. 4:96-110. Weiland P, 2006. Biomass Digestion in Agriculture: A successful
pathway for the energy production and waste treatment in Germany. Eng. Life. Sci. 6:302-9.
Wösten JHM, Pachepsky YA, Rawls WJ, 2001. Pedotransfer func-tions: bridging the gap between available basic soil data and missing soil hydraulic characteristics. J. Hydrol. 251:123-50. Xin Z, Franks C, Payton P, Burke JJ, 2008. A simple method to
determine transpiration efficiency in sorghum. Field. Crop. Res. 107:180-3.
Zegada-Lizarazu W, Monti A, 2013. Photosynthetic response of sweet sorghum to drought and re-watering at different growth stages. Physiol. Plantarum. 149:56-66.
Zhao YL, Dolat A, Steinberger Y, Wang X, Osman A, Xie GH, 2009. Biomass yield and changes in chemical composition of sweet sorghum cultivars grown for biofuel. Field. Crop. Res. 111:55-64.