This article is licensed under a Creative Commons Attribution-NonCommercial NoDerivatives 4.0 International License.
Copyright Ó 2021 Cognizant, LLC. E-ISSN 1555-3906
www.cognizantcommunication.com
1These authors provided equal contribution to this work. 2These authors share senior authorship.
3Current affiliation: Department of Neurosciences, Imaging and Clinical Sciences, “G. D’Annunzio” University of Chieti-Pescara, Chieti, Italy.
Address correspondence to Enrico Mini, Department of Health Sciences, University of Florence, Viale Pieraccini, 6–50139 Firenze, Italy. Tel: +39-055-2758221; E-mail: [email protected] or Stefania Nobili, Department of Neurosciences, Imaging and Clinical Sciences, “G. D’Annunzio” University of Chieti-Pescara, Chieti, Italy. E-mail: [email protected]
631
INTRODUCTION
Colorectal cancer (CRC) is the third most frequently diagnosed type of cancer and the second leading cause of cancer-related death worldwide1. Its prognosis is mainly related to disease stage that directly impacts therapeutic
choices and, in particular, the indication of adjuvant che-motherapy in nonmetastatic setting (about 75% of cases at diagnosis)2. For stage III patients, drug treatment gen-erally consists of a combination of fluoropyrimidine and oxaliplatin. For stage II patients, it is generally represented by a monotherapy with a fluoropyrimidine, in relation to
PNN and KCNQ1OT1 Can Predict the Efficacy of Adjuvant
Fluoropyrimidine-Based Chemotherapy in Colorectal Cancer Patients
Andrea Lapucci,*†1 Gabriele Perrone,*†1 Antonello Di Paolo,‡§ Cristina Napoli,*† Ida Landini,*†
Giandomenico Roviello,*† Laura Calosi,¶ Antonio Giuseppe Naccarato,# Alfredo Falcone,# Daniele Bani,¶ Enrico Mini,*†§2 and Stefania Nobili*†§2,3
*Department of Health Sciences, University of Florence, Florence, Italy †DENOTHE Excellence Center, University of Florence, Florence, Italy ‡Department of Clinical and Experimental Medicine, University of Pisa, Pisa, Italy §Cancer Pharmacology Working Group of the Italian Society of Pharmacology, Milan, Italy ¶Department of Experimental and Clinical Medicine, University of Florence, Florence, Italy
#Department of Translational Research and New Technologies in Medicine and Surgery, University of Pisa, Pisa, Italy
The benefit of adjuvant chemotherapy in the early stages of colorectal cancer (CRC) is still disappointing and the prediction of treatment outcome quite difficult. Recently, through a transcriptomic approach, we evidenced a role of PNN and KCNQ1OT1 gene expression in predicting response to fluoropyrimidine-based adjuvant chemotherapy in stage III CRC patients. Thus, the aim of this study was to validate in an independent cohort of stages II–III CRC patients our previous findings. PNN and KCNQ1OT1 mRNA expression levels were evalu-ated in 74 formalin-fixed paraffin-embedded tumor and matched normal mucosa samples obtained by stages II–III CRC patients treated with fluoropyrimidine-based adjuvant chemotherapy. PININ, the protein encoded by PNN, was immunohistochemically evaluated in 15 tumor and corresponding normal mucosa samples, selected on the basis of a low, medium, or high mRNA expression tumor/mucosa ratio. PNN and KCNQ1OT1 mRNA mean expression levels were significantly higher in tumor compared with normal tissues. Patients with high PNN or KCNQ1OT1 tumor mRNA levels according to ROC-based cutoffs showed a shorter disease-free survival (DFS) compared with patients with low tumor mRNA gene expression. Also, patients with tumor mRNA expression values of both genes below the identified cutoffs had a significantly longer DFS compared with patients with the expression of one or both genes above the cutoffs. In a representative large cohort of stages II–III CRC untreated patients retrieved from GEO datasets, no difference in DFS was observed between patients with high and low PNN or KCNQ1OT1 gene expression levels. These data confirm our previous find-ings and underscore the relevance of PNN and KCNQ1OT1 expression in predicting DFS in early stages of CRC treated with fluoropyrimidine-based adjuvant chemotherapy. If further validated in a prospective case series, both biomarkers could be used to identify patients who benefit from this treatment and to offer alterna-tive chemotherapy regimens to potential unresponsive patients. In relation to the suggested biological role of PNN and KCNQ1OT1 in CRC, they might also be exploited as potential therapeutic targets.
Key words: Colorectal cancer; Adjuvant chemotherapy; Predictive biomarkers; Gene expression;
the presence of biological and clinical–pathological risk factors3. Although adjuvant chemotherapy has reduced the risk of disease recurrence and prolonged survival in high-risk stage II and stage III CRC patients, around 40% develop metastases within 3 years after surgery2. CRC is a biologically heterogeneous tumor, and this causes a highly stage-independent prognostic variability, with a survival ranging from 84% to 59% in patients with stage II disease and from 83% to 36% in patients with stage III disease4.
Many oncogenic signal transduction pathways are dys-regulated in CRC due to mutations in various driver genes (e.g., APC, p53, KRAS, NRAS, PIK3CA, and BRAF)5,6. However, only some of these mutations appear to be useful today as biomarkers7 and/or as potential drug targets8–11.
Genomic, epigenetic, or immunological markers with a potential prognostic role in early stage CRC are, for instance, the status of microsatellites12,13, BRAF and KRAS mutations13,14, the CpG island methylator phenotype15, and the degree of infiltration of immune cells in the tumor16–18.
However, other molecular markers of neoplastic pro-gression, immunocompetence status, or alterations in the expression of signaling molecules and of oncogenic metabolism, and morphological–topographic markers of key immune cells in the tumor microenvironment19–21 as well as specific somatic mutations of CRC6,7,9,22 may play a role in response to approved and experimental therapies.
Results from clinical trials with selective inhibitors of molecular targets in stage III patients [e.g., use of immune checkpoint inhibitors associated with chemotherapy in deficient mismatch repair (dMMR) tumors] are awaited23. Studies aimed at evaluating treatments with BRAF inhibi-tors associated with anti-EGFR monoclonal antibodies in
BRAF-mutated stage III cancer patients may also be war-ranted based on positive results in the metastatic setting11. Through the years, candidate gene approaches as well as genome-wide approaches have been exploited with the aim of identifying prognostic and/or predictive CRC molecular biomarkers.
The main results obtained by these approaches are rep-resented, respectively, by genes involved in the pyrimidine pathway (e.g., TYMS and DUT)24,25 and by the more recent CRC molecular classifications (CMS and CRIS)26,27 whose clinical utility has recently been evaluated in stages II–III CRC patients with promising results18,28.
However, the clinical value of these markers in pre-dicting response to standard adjuvant chemotherapy is substantially unknown. Also, commercially available multigene assays based on the evaluation of the expres-sion of selected genes, although prognostic for stages II–III survival parameters, have not been shown to pre-dict the adjuvant chemotherapy benefit2.
Recently, through a transcriptomic approach, we showed the ability of PNN or KCNQ1OT1 gene expres-sion to predict response to fluoropyrimidine-based
adjuvant chemotherapy in two extreme prognosis cohorts of stage III CRC patients29. A successful validation of these findings was obtained in an independent cohort obtained from GEO datasets with similar clinical/patho-logical characteristics but unselected for prognosis. Only patients with low PNN or KCNQ1OT1 mRNA tumor lev-els benefitted from adjuvant chemotherapy29.
PNN codifies PININ, whereas KCNQ1OT1 is a long noncoding RNA (KCNQ1 opposite strand/antisense tran-script 1). PININ is a 140-kDa phosphoprotein that was initially characterized as a desmosome-associated mol-ecule30, and it was later proposed to have a tumor sup-pressor function in renal cell carcinomas31. More recent studies have instead suggested a contribution of PININ in the activation of the EGFR/ERK signaling pathway32,33 and its involvement in cancer progression32–34.
Long noncoding RNAs (lncRNAs) belong to a cat-egory of transcripts largely implicated in biological pro-cesses, and their aberrant expression is an important cause of cancer development and progression35. KCNQ1OT1 expression may be altered in Beckwith–Wiedemann syn-drome (BWS)36, although it has been found to be altered also in several malignant tumors of non-BWS patients where its oncogenic properties have been identified37–43. For KCNQ1OT1, a potential role in tumor drug resistance has also been suggested44–49.
On this basis, the validation of PNN and KCNQ1OT1 as biomarkers predictive of chemotherapy outcome could allow the identification of patients with predicted unfa-vorable outcome who might benefit from alternative adjuvant chemotherapy regimens with existing or new drugs based on the presence of specific druggable targets, whereas patients with predicted favorable outcome to fluoropyrimidine-based adjuvant chemotherapy could be treated with these standard regimens.
Thus, the aim of this study was to confirm previous results and to further validate the predictive role of PNN and KCNQ1OT1 in response to fluoropyrimidine-based adjuvant chemotherapy in a cohort of stages II–III CRC patients.
MATERIALS AND METHODS
Tissue Samples and Patients
Formalin-fixed paraffin-embedded (FFPE) stages II–III CRC tissues and their paired normal colonic mucosa were used for both quantitative PCR (RT-qPCR) and immunohistochemistry analyses. Overall, 74 FFPE CRC tissues and 57 FFPE normal colonic tissues were available. All samples (tumor and matched normal tis-sues) were obtained during primary surgery, thus prior to the starting of adjuvant chemotherapy.
CRC patients had been enrolled consecutively at a single institution according to criteria reported in Di
Paolo et al.50. All patients had been treated with fluoro-pyrimidine-based adjuvant chemotherapy represented by the Machover’s schedule including six cycles in which patients were treated with daily bolus injections of leu-covorin (100 mg/m2) and 5-FU (370 mg/m2) for 5 days every 4 weeks51. Tissue specimens were obtained accord-ing to an institutional review board-approved protocol, and patients signed an informed consent for the use of their tissue samples and clinical/pathological data for research purpose.
RNA Extraction
Total RNA was isolated from FFPE CRC tissues and paired normal mucosa. Briefly, total RNA was isolated from a thin section (20 µm) by means of the NucleoSpin TotalRna FFPE XS kit according to the manufacturer’s protocol (Macherey-Nagel, Düren, Germany). RNA was quantified by Qubit™ 3.0 Fluorometer (Invitrogen-ThermoFisher Scientific, Waltham, MA, USA). After quantification, total RNA was analyzed to determine the quality of samples by the Agilent RNA 6000 Nano LabChip® kit with the Agilent 2100 Bioanalyzer (Agilent Technologies, Santa Clara, CA, USA). The accepted val-ues of RNA integrity were ³7.
Quantitative Real-Time RT-PCR
The mRNA expression levels of PNN and KCNQ1OT1 were analyzed by RT-qPCR using a RotorGene 3000 (Qiagen, Hilden, Germany) instrument. Primers were pur-chased from IDT (Dessau-Roßlau, Germany). Five hun-dred nanograms of total RNA from samples obtained as described above were retrotranscribed using iScript (Bio-Rad, Irvine, CA, USA) and amplified with specific primers: for PNN, GAACAGAAGGCGGAACAAGAAGAGGG (forward) and TCATTGTGCTGATTACCTGTCTCCTCC (reverse), and KCNQ1OT1, GGGCACCATAAGAAGG CATGAAGCTG (forward) and CCTGGATTGCCTGG ACAAGGCTGAC (reverse). PCR amplification was carried out by SsoAdvanced™ Universal SYBR® Green Supermix (Bio-Rad) according to the manual instruc-tion. In the present analysis, 18s rRNA was confirmed to be stable and was used as the normalizer: CGGC TACCACATCCAAGGAA (forward) and GTTATTTTT CGTCACTACCTCCCCGGG (reverse). The RT-qPCR was performed using the following procedure: 98°C for 2 min, 40 cycles of 98°C for 5 s, and 60°C for 10 s. The pro-gram was set to reveal the melting curve of each ampli-con from 60°C to 95°C with a read every 0.5°C.
Immunohistochemistry
Immunohistochemistry analysis of PININ protein lev-els was performed on 15 tumor and corresponding normal mucosa samples, selected on the basis of low, medium, or high PNN mRNA expression ratio.
Sections from FFPE tissue blocks were incubated at 60°C for 12 h, then deparaffinized and hydrated in descending concentrations of ethanol and finally in ddH2O. To expose masked epitopes, the sections were microwaved in citrate buffer (pH 6.0) for 2 × 5 min and washed in PBS for 2 min. After blocking of nonspecific epitopes with 1.5% blocking serum in PBS for 10 min, primary rabbit polyclonal anti-PININ antibody (ABCAM, Cambridge, MA, USA) was added and then incubated at 4°C overnight. After wash-ing with PBS, a horseradish peroxidase-labeled secondary anti-rabbit antibody (ABCAM) was added. After 30 min, the sections were rinsed with PBS, and immune reaction was revealed by the VECTASTAIN® Elite® ABC HRP kit (Vector Laboratories, Burlington, ON, Canada). All runs also included negative controls in which PBS replaced the primary antibody.
From each section, five microscopical fields were pho-tographed at 20× final magnification with a light micro-scope (Eclipse E200; Nikon, Tokyo, Japan) equipped with a digital camera (DS-F12; Nikon) under fixed lighting conditions. On each image, three different square regions, each measuring about 2,000 µm2, were chosen at random with the only criterion to exclude large stromal tissue areas. These were used to perform quantitative analysis of the optical density of immunostaining by means of the ImageJ open source software (https://imagej.nih.gov).
Retrieval of Untreated Stages II–III CRC Patients From GEO Datasets
To confirm that PNN and KCNQ1OT1 gene expression levels play a predictive role of response to fluoropyrimi-dine-based chemotherapy, untreated stage II and stage III CRC patients were retrieved from three Gene Expression Omnibus (GEO) datasets (i.e., GSE14333, GSE39582, GSE103479) (https://www.ncbi.nlm.nih.gov/gds). These datasets satisfied the following criteria: availability of untreated CRC patients, knowledge of disease stage, date of disease recurrence, and follow-up duration. Overall, 332 untreated stage II patients and 109 untreated stage III CRC patients for a total of 441 patients were retrieved from the abovementioned datasets without performing any selection to avoid the risk of introducing bias. Thus, the untreated cohort was analyzed to evaluate relation-ships between PNN and KCNQ1OT1 gene expression levels and disease-free survival (DFS).
Statistical Analysis
Potential differences in clinical/pathological characteris-tics of CRC patients or in gene or in protein between tumor and normal tissues were analyzed by the Student’s t-test. Univariate and multivariate Cox proportional hazard regres-sion analyses were used to correlate clinical/pathological characteristics and gene expression with patient DFS. Kaplan–Meier survival plots and the log-rank test were
used to assess differences in DFS between patients with low and high gene expression levels determined according to a receiving operating characteristic (ROC) curve analysis. Kaplan–Meier survival plots and the log-rank test were also used to assess differences in DFS between patients belong-ing to the selected GEO datasets whose tumor expressed low or high levels of PNN and KCNQ1OT1 according to the gene expression median value of datasets. DFS time was calculated from the date of diagnosis until disease recurrence. Analyses were carried out using the SPSS v.26 software. Values of p < 0.05 were considered significant.
RESULTS
Patient Characteristics
Clinical and pathological characteristics of the study cohort including 19 CRC stage II and 55 CRC stage III patients are reported in Table 1. About 57% of the patients were males and 64.9% of patients were affected by colon cancer. Among these, tumor was located in the right colon in 43.5% of the cases with a known site. All patients were treated with fluoropyrimidine-based adjuvant chemo-therapy. As expected, the Kaplan–Meyer curve showed a statistically significant difference between DFS of stage III and stage II CRC patients (p = 0.049) (Fig. 1). Median DFS was not reached for stage II CRC patients (median follow-up 69.4 months), whereas it was 19.2 months for stage III CRC patients. The main clinical and pathologi-cal characteristics of patients belonging to the selected GEO datasets are reported in Table 2.
PNN and KCNQ1OT1 Gene Expression Levels in Study
Mucosa and Tumor Tissue Samples
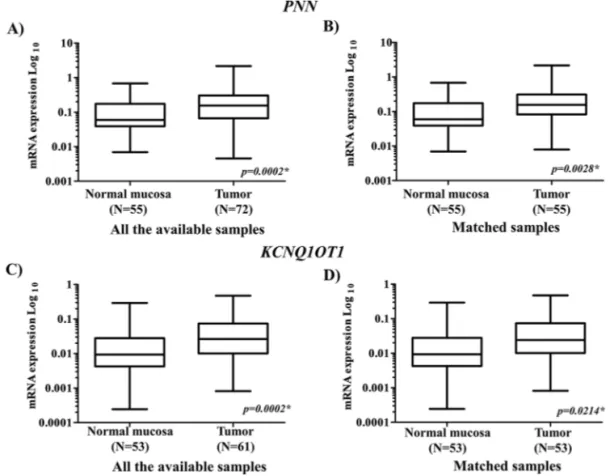
Overall, PNN was detectable in 72 FFPE tumor tis-sues and in 55 FFPE matched normal mucosa, whereas
KCNQ1OT1 in 61 FFPE tumor tissues and 53 FFPE matched normal mucosa. The study of the mRNA expres-sion of PNN and KCNQ1OT1 in tumor and in the adja-cent mucosa showed that the mRNA expression levels of both genes were significantly higher in tumor samples compared with those in normal mucosa (Fig. 2A–D). These findings were reported for PNN and KCNQ1OT1 when all the available cases were analyzed (p = 0.0002 for both genes, respectively) (Fig. 2A and C) and were confirmed when the comparison was limited to patients for whom both tumor and paired normal tissues were
Table 1. Main Clinical/Pathological Characteristics
of Study Colorectal Cancer (CRC) Patients (N = 74)
Characteristics No. (%)
Age [median (range)] 63 (39–77)
Gender Male 42 (56.8%) Female 32 (43.2%) Grading 1 1 (1.4%) 2 61 (82.4%) 3 12 (16.2%) Stage IIA 19 (25.7%) IIIA 3 (4.1%) IIIB 22 (29.7%) IIIC 30 (40.5%) Adjuvant therapy 74 (100.0%)
Primary tumor site
Left colon 26 (35.1%)
Right colon 20 (27.1%)
Colon (site unspecified) 2 (2.7%)
Rectum 26 (35.1%)
Figure 1. Overall survival of colorectal cancer (CRC) patients according to disease stage (stage II, n = 19; stage III, n = 55). *Log-rank
Table 2. Main Clinical/Pathological Characteristics of the GEO CRC Cohort Characteristics GSE14333 (N = 100) GSE39582 (N = 257) GSE103479 (N = 84) Total (N = 441) Gender Male 53 (53.0%) 146 (56.8%) 48 (57.1%) 247 (56.0%) Female 47 (47.0%) 111 (43.2%) 36 (47.9%) 194 (44.0%)
Mean age (SD, range) 71 (12.66; 30–92) 73 (12.8; 24–94) 75.9 (9.38; 53.2–93) 73 (12.56; 24-94)
Primary tumor localization
Left sided 39 (39%) 140 (54.47%) 32 (38.09%) 211 (49.72%) Right sided 47 (47%) 117 (45.52%) 34 (40.47%) 198 (43.57%) Rectum 14 (14%) – 18 (21.42%) 32 (6.14%) TNM TNA NA 10 (3.48%) – NA T2 NA 9 (3.13%) 3 (3.57%) NA T3 NA 186 (64.8%) 61 (72.61%) NA T4 NA 52 (18.11%) 20 (23.8%) NA NNA NA 10 (3.89%) – NA N+ NA 2 (0.69%) – NA N0 NA 195 (67.94%) 57 (67.85%) NA N1 NA 34 (11.84) 17 (20.23) NA N2 NA 17 (5.92%) 10 (34.84%) NA N3 NA – – NA M0 NA 247 (86.06%) 44 (52.38%) NA Mx NA 10 (3.48%) 40 (47.61%) NA Stage AJCC II 72 (72%) 203 (78.98%) 57 (67.85%) 332 (75.28%) III 28 (28%) 54 (21.01%) 27 (32.14%) 109 (24.71%)
Displayed are numbers and percentages for each group. NA, not available.
available (p = 0.0028 and p = 0.0214, respectively) (Fig. 2B and D).
Also, PNN and KCNQ1OT1 expression levels were both higher in stage III tumors compared with stage II tumors, although this difference was statistically sig-nificant only for the KCNQ1OT1 gene (p = 0.133 and
p = 0.020, respectively) (data not shown).
Correlations Between Tumor PNN and KCNQ1OT1
Gene Expression Levels and DFS in Stages II–III CRC Patients Treated With Adjuvant Chemotherapy
The accuracy of tumor gene expression in predicting DFS (i.e., the identification of the optimal cutoff value for differentiation of patients with presence or absence of disease recurrence following fluoropyrimidine-based treat-ment) was evaluated by receiver operating characteristic (ROC) analysis. Cutoff values able to significantly differ-entiate recurrent from nonrecurrent disease were 0.251 and 0.042 for PNN and KCNQ1OT1, respectively. According to the identified respective gene expression level cutoff (Fig. 3A and C), patients with higher mRNA tumor expression of
PNN or KCNQ1OT1 showed a shorter DFS compared with patients with lower mRNA expression levels (p = 0.009 and
p = 0.001, respectively) (Fig. 3B and D).
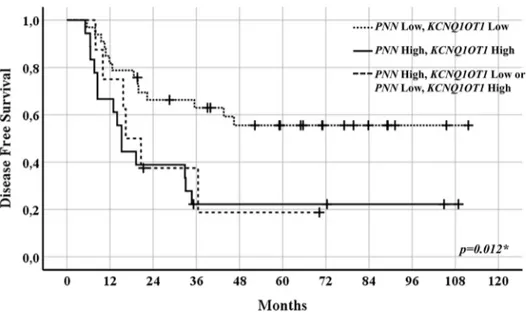
In 59 patients for whom mRNA expression levels were detectable for both genes, a DFS analysis by group-ing patients accordgroup-ing to specific cutoff value criteria (i.e., both genes above or both genes below the PNN or KCNQ1OT1 cutoffs, or one of the two genes above its respective cutoff) (Fig. 4) was also performed (Fig. 5). Patients who had mRNA expression values of both genes below their respective cutoff (i.e., 0.251 for PNN and 0.042 for KCNQ1OT1) had significantly longer DFS compared with that of patients with at least one gene whose expression was above its cutoff (p = 0.012).
By using the above-reported cutoffs, statistically signif-icant differences in tumor gene expression levels of PNN or KCNQ1OT1 were observed also when patients were subanalyzed grouped for tumor stage (i.e., p = 0.0035 and
p = 0.0127, respectively, for stage II and p < 0.0001 for both genes for stage III; data not shown). According to stage, both PNN and KCNQ1OT1 maintained their predictive
Figure 3. PNN (A) and KCNQ1OT1 (C) tumor gene expression subdivided according to the disease recurrence (DR) cutoff obtained
by ROC curves. Kaplan–Meier curves of disease-free survival (DFS) indicating probability of DR for patients with PNN (B) and KCNQ1OT1 (D) tumor gene expression above or equal/below the DR cutoff. *Student’s t-test; **Log-rank test.
role, that is, patients with higher mRNA tumor expression of PNN or KCNQ1OT1 showed a shorter DFS compared with patients with lower mRNA expression levels. These differences were found to be statistically significant in stage II patients (p < 0.001 for both genes), whereas only
a trend was observed in stage III patients (p = 0.258 and
p = 0.055 for PNN and KCNQ1OT1, respectively) (data not shown). The behavior observed when DFS of the entire case series was evaluated according to the above-mentioned specific cutoff value criteria was confirmed
Figure 4. Patients grouped in low PNN and KCNQ1OT1 mRNA expression levels (n = 33) (left), high PNN and KCNQ1OT1 mRNA
expression levels (n = 18) (right), and low PNN and high KCNQ1OT1 or high PNN and low KCNQ1OT1 mRNA expression levels (n = 8) (middle) in CRC tissues.
Figure 5. Kaplan–Meier curves of disease-free survival (DFS) indicating probability of disease recurrence (DR) for CRC patients
treated with adjuvant chemotherapy according to PNN and KCNQ1OT1 DR cutoffs. PNN and KCNQ1OT1 mRNA expression levels below DR cutoffs (dotted line) (n = 33); PNN and KCNQ1OT1 mRNA expression levels above DR cutoffs (solid lane) (n = 18); PNN or KCNQ1OT1 mRNA expression levels above DR cutoffs (dashed line) (n = 8). *Log rank test.
when the same parameters were analyzed in stage II and stage III patients, separately (p = 0.001 and p = 0.242 for stage II and stage III, respectively; data not shown).
Univariate and Multivariate Analyses of Clinical, Pathological, and Molecular Parameters and Treatment Outcome
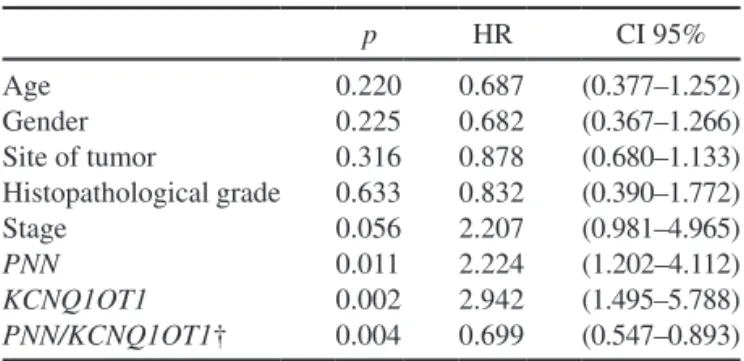
Among the study clinical/pathological and experimen-tal variables, univariate analysis showed statistically sig-nificant differences for PNN and KCNQ1OT1 tumor gene expression (p = 0.011 and p = 0.002, respectively) and only a marked trend for stage (p = 0.056) (Table 3).
Multivariate analysis showed KCNQ1OT1 mRNA expression levels as the unique variable predictive of DFS in the entire cohort of patients (p = 0.031) and PNN/
KCNQ1OT1 in the subgroup of patients analyzed accord-ing to the above-reported specific cutoff value criteria (p = 0.012) (data not shown).
PININ Immunohistochemistry Staining in Mucosa and Tumor Tissue Samples
In order to evaluate the concordance between the mRNA expression of PNN and the expression of its prod-uct, PININ protein expression levels were analyzed in 15 CRC and 15 paired normal mucosa tissue samples, chosen according to PNN tumor and normal tissue mRNA fold variation. On this basis, five samples with tumor mRNA/ normal tissue mRNA ratio ³4, five samples with tumor mRNA/normal tissue mRNA ratio ranging between <4 and >0.75, and five samples with tumor mRNA/normal tissue mRNA ratio <0.75 were analyzed. The results are shown in Figure 6A. Overall, a 93.3% of concordance between PNN mRNA and PININ protein expression levels was observed. Only in one case, belonging to the first group (i.e., tumor mRNA/normal tissue mRNA ratio ³4), a higher protein expression level in mucosa com-pared with the paired tumor tissue was observed. Two
representative immunohistochemically stained 20× mag-nification photographs are shown in Figure 6B, in which differences in nuclear PININ expression between tumor and paired normal mucosa are highlighted.
Correlations Between Tumor PNN or KCNQ1OT1 Gene
Expression Levels and DFS in Untreated Stages II–III CRC Patients From GEO Datasets
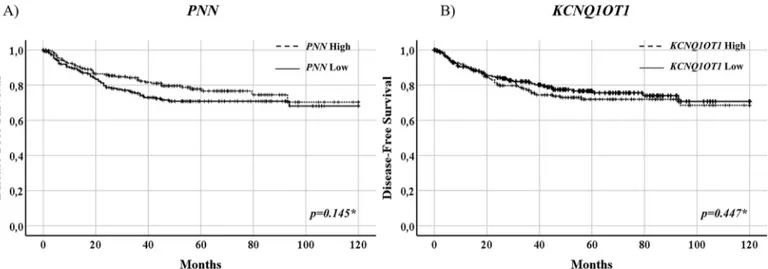
The study of correlations between PNN or KCNQ1OT1 gene expression levels and DFS showed no statisti-cal difference between untreated patients belonging to GSE14333, GSE39582, and GSE103479 datasets whose tumors expressed high or low expression of the two study genes (PNN, p = 0.145, KCNQ1OT1, p = 0.447) (Fig. 7). This observation further validated the predictive role of
PNN or KCNQ1OT1 gene expression levels in the study cohort of CRC patients treated with fluoropyrimidine-based chemotherapy.
DISCUSSION
Although the administration of adjuvant chemother-apy provides advantages in high-risk stage II and stage III CRC patients (i.e., a fluoropyrimidine alone and a fluo-ropyrimidine plus oxaliplatin, respectively), the 5-year overall survival is still disappointing since about 40% of them develop metastases within 3 years after surgery2.
Although, genomic, epigenetic, or immunological mark-ers have been suggested to have a potential prognostic role in early stage CRC12–18, none of them have entered yet the clinical routine. Also, the implementation of molecular CRC classifications, such as CMS26 and CRIS27, whose prognostic role has been evidenced, cannot be easily trans-lated into the clinic.
We recently identified, by RNA sequencing, PNN and
KCNQ1OT1 as predictive biomarkers of response to fluoro-pyrimidine-based adjuvant chemotherapy in stage III CRC patients29. These genes belong to a cluster of 108 genes we found to be differentially expressed between two extreme cohorts of stage III patients (good prognosis cohort, DFS longer than 5 years; poor prognosis group, DFS shorter or equal to 3 years; GSE122246)29. Among 108 differentially expressed genes, PNN or KCNQ1OT1 were successfully validated in a GEO-independent cohort of patients, similar for clinical/pathological characteristics to the identifica-tion cohort but unselected for prognosis. Results showed that patients with low PNN or KCNQ1OT1 mRNA tumor expression levels benefitted from adjuvant chemotherapy29. Based on these previous findings, we have now ana-lyzed PNN and KCNQ1OT1 mRNA expression levels in an independent cohort of stages II and III CRC patients who underwent standard adjuvant chemotherapy. The observed statistically significant difference in the PNN and KCNQ1OT1 mRNA expression levels between mucosa and tumor tissues as well as between stage II
Table 3. Univariate Analysis* of Main Clinical/Pathological
Parameters of Stages II–III CRC Patients and PNN, KCNQ1OT1, and PNN/KCNQ1OT1 Tumor Gene Expression in Relation to Disease-Free Survival p HR CI 95% Age 0.220 0.687 (0.377–1.252) Gender 0.225 0.682 (0.367–1.266) Site of tumor 0.316 0.878 (0.680–1.133) Histopathological grade 0.633 0.832 (0.390–1.772) Stage 0.056 2.207 (0.981–4.965) PNN 0.011 2.224 (1.202–4.112) KCNQ1OT1 0.002 2.942 (1.495–5.788) PNN/KCNQ1OT1† 0.004 0.699 (0.547–0.893)
*Cox proportional hazard regression.
†PNN/KCNQ1OT1 mRNA expression levels grouped according to PNN and KCNQ1OT1 disease recurrence cutoffs.
and stage III CRC confirmed a pathogenetic role in the progression of CRC for both genes, as also suggested by other authors32–34,44,52.
PININ, codified by PNN gene, has been initially char-acterized as a cell adhesion-related associated protein
involved in the stabilization of the desmosome-interme-diate filament complex in epithelial tissues30. However, PININ is also present at the nuclear level53,54 where it acts as a splicing regulator directly participating in splic-ing reactions or indirectly via other components of the
Figure 6. PININ protein expression of 15 tumor and 15 paired normal mucosa tissue samples selected according to a low, medium,
or high mRNA expression tumor/mucosa ratio. From each analyzed section, five microscopical fields were photographed at 20× final magnification under fixed lighting conditions. On each image, three different square regions, each measuring about 2,000 µm2, were randomly chosen with the only criterion to exclude large stromal tissue areas. These were used to perform quantitative analysis of the optical density of immunostaining by means of the ImageJ software (https://imagej.nih.gov). Analysis of immunohistochemistry stain-ing intensity in group 1 (mRNA tumor ³4 mRNA normal), group 2 (mRNA tumor <4 and >0.75 mRNA normal), and group 3 (mRNA tumor < 0.75 mRNA normal) (A). Representative IHC images of one tumor and one paired normal tissue sample (photographed at 20× magnification) (B). INT, intensity. *p < 0.05; **p < 0.001; ***p < 0.01 Student’s t-test.
Figure 7. Kaplan–Meier curves of disease-free survival (DFS) indicating probability of disease recurrence (DR) for stages II–III CRC
patients (n = 441) retrieved from GEO datasets, according to PNN (A) and KCNQ1OT1 (B) tumor gene expression levels. Patients were subdivided according to PNN or KCNQ1OT1 gene expression median values in high (n = 221) and low (n = 220) expression levels. *Log-rank test.
splicing machinery55. Also, PNN has been suggested to act as a transcriptional regulator of the tumor suppressor gene E-cadherin by interacting with CtBP156. Moreover, downregulation of E-cadherin expression by PNN siRNA in breast cancer cells suggests that PNN may suppress the inhibitory effects of SARNP, involved in mRNA splic-ing and export57. A potential PNN tumor suppressor func-tion was suggested in some types of cancers (e.g., renal cell carcinoma)31, and lower levels of PNN mRNA were reported in a number of human colon cancer cell lines compared with human normal colon mucosa cell lines58,59. The apoptosis induced by the ectopic expression of PNN in a significant percentage of cancer cells was suggested to occur through a pathway mediated by ASY/Nogo-B/ RTN-xs, caspase 12, caspase 9, and caspase 360.
However, a different role of PININ in cancer has also been suggested. PININ expression was shown to be essen-tial for MCF-7 breast cancer cell survival, and its depletion induced apoptosis through the activation of the expression of proapoptotic Bcl-xS transcripts61. Other studies have also shown higher expression levels of PNN and/or PININ in tumor tissue compared with normal tissues [e.g., ovarian cancer32, hepatocellular carcinoma (HCC)33, and CRC34]. In particular, Zhang et al.34 showed that PNN knockdown in ovarian cancer cells resulted in the reduction of CtBP1 protein expression, cell adhesion, anchorage-independent growth, and increased drug sensitivity.
Yang et al.32 demonstrated that high levels of PNN were associated with less differentiated histological grade and reduced overall survival in HCC patients. PNN knockdown inhibited HCC cell proliferation, colony for-mation, cell viability, and promoted glucose deprivation (GD)-induced cell apoptosis, whereas its overexpression attenuated GD-initiated poly(ADP-ribose)polymerase (PARP) cleavage and ERK1/2 dephosphorylation. Thus, it has been suggested that PININ contributes to HCC progression and resistance to GD-induced apoptosis via maintaining ERK1/2 activation and that it could represent a potential therapeutic target in HCC32.
Wei et al.33 demonstrated that the PNN overexpression was significantly associated with CRC aggressive char-acteristics and short overall survival. PNN upregulation was also shown to promote tumor cell proliferation, in vitro invasion, and metastasis in vivo. Also, PNN upregu-lation increased the expression of desmoglein 2 (DSG2) and activated the EGFR/ERK signaling pathway33.
The expression of PNN through miR-1237-3p spong-ing has been shown to be upregulated by AATBC (LOC284837), a new lncRNA whose increased expres-sion has been associated with poor survival in patients with nasopharyngeal carcinoma. In turn, PNN interacted with the epithelial–mesenchymal transition (EMT) acti-vator ZEB1 by upregulating its expression to promote EMT in nasopharyngeal carcinoma cells62.
Overall, our results are in agreement with those of authors that demonstrated an active role of PNN in tumor progression but, in addition, provide information on the potential role of PNN in predicting response to drug treat-ment in CRC patients.
The KCNQ1OT1 transcript is the antisense of the
KCNQ1 gene and is an unspliced lncRNA. It inter-acts with chromatin and regulates transcription of mul-tiple target genes through epigenetic modifications63. Although KCNQ1OT1 transcript is aberrantly expressed in most patients with Beckwith–Wiedemann syndrome (BWS)36, several studies reported associations between aberrant expression of KCNQ1OT1 and cancer progres-sion/metastasis39,44,48,52 and/or tumor drug response44,45,47,48 in non-BWS patients. A role of KCNQ1OT1 in colorectal carcinogenesis through its regulation by b-catenin sig-naling has been reported64 based on several evidences such as the upregulation of KCNQ1OT1 expression in CRC cells in which b-catenin excessively accumulated in the nucleus as well as that of genes (i.e., SLC22A18 and
PHLDA2) regulated by KCNQ1OT1 and resulted associ-ated with its downregulation after b-catenin knockdown, together with the evidence that b-catenin can promote the transcription of KCNQ1OT1 through direct binding to its promoter region64.
In a large CRC case series from the Cancer Genome Atlas (TGCA), KCNQ1OT1 expression levels were shown to be inversely linked to overall survival (p = 0.02). Patients whose tumors expressed higher levels of
KCNQ1OT1 showed a shorter overall survival compared to patients whose tumors expressed lower tumor expres-sion levels65. Also, KCNQ1OT1 expression levels were found to be higher in lung cancer tissues compared with normal lung tissues, and the high levels correlated with poor differentiation, high TNM stage44, and shorter over-all survival51. Another study did not find the same inverse correlations between levels of KCNQ1OT1 expression and overall survival in early stage lung cancer patients66.
The potential oncogenic role of KCNQ1OT1 has also been suggested in poor prognosis patients with breast cancer37, tongue carcinoma48, and cholangiocarcinoma patients39 with higher levels of KCNQ1OT1 compared with good prognosis patients whose tumors showed low levels37,39,48.
Interestingly, most of the studies also included func-tional assays that showed that KCNQ1OT1 promotes tumorigenesis and/or tumor progression by modulat-ing genes through various signalmodulat-ing axis and some examples include SOX4 through miR-140-5p/SOX4 axis in cholangiocarcinoma39,67, CCNE2 through miR-145 in breast cancer37 and through KCNQ1OT1/miR-370/CCNE2 axis in glioma38, and HSP90AA1 through miR-27b-3p/HSP90AA1 pathway in lung cancer51. Recently, in soft tissue sarcoma patients, the investigation
of a network of ceRNAs revealed that the subnetwork lncRNA (KCNQ1OT1)-miRNA (has-miR-29c-3p)-mRNA (JARID2, CDK8, DNMT3A, and TET1) was asso-ciated with a poor prognosis68.
A role for KCNQ1OT1 has also been shown in the development of tumor drug resistance. High mRNA expression levels of KCNQ1OT1 were correlated with methotrexate (MTX) resistance in the human CRC cell line HT29/MTX45 and with paclitaxel resistance in lung cancer tissue samples and cells (i.e., the paclitaxel-resis-tant cell line A549/PA)44. The knockdown of KCNQ1OT1 either in MTX-resistant CRC cells45 and in the lung can-cer paclitaxel-resistant cells44 restored sensitivity to these drugs. In particular, in MTX-resistant CRC cell lines, the knockdown of KCNQ1OT1 increased MTX chemosensi-tivity by the sponging of miR-760 and reduced their pro-liferation by regulating the miR-760/PPP1R1B axis with consequent cell cycle arrest and apoptosis45.
Similarly, upregulation of KCNQ1OT1 was shown in human tongue carcinoma tissues, human tongue carci-noma cell lines48,49, and osteosarcoma cell lines47 resistant to cisplatin, and its knockdown reduced cisplatin resis-tance, proliferation, and invasion47–49 also in in vivo tumor models48. In particular, in human tongue carcinoma cell lines, KCNQ1OT1 was shown to regulate cisplatin resis-tance by sponging miR-211-5p through the Ezrin/Fak/Src signaling48 or miR-124-3p through the KCNQ1OT1/miR-124-3p/TRIM14 axis49.
Results reported herein are in agreement with those previously reported by the abovementioned authors and by ourselves and are conceivable with an oncogenic role of KCNQ1OT1 and PNN. The mentioned studies that pro-vide insights on molecular mechanisms through which
PNN or KCNQ1OT1 may act in cancer progression and in tumor drug resistance support our findings.
Overall, our results, although obtained in a retrospec-tive cohort, show that high levels of PNN or KCNQ1OT1 predict for a worse prognosis and a suboptimal response to drug treatment. The predictive role of PNN or
KCNQ1OT1 is also further supported by the observation that PNN or KCNQ1OT1 gene expression levels are not associated with DFS of a large GEO cohort of untreated stages II–III CRC patients.
The genetic modulation of PNN and KCNQ1OT1 through available RNA therapeutic approaches (e.g., RNA silencing by siRNAs, aODNs, and CRISPR-Cas9) in CRC experimental models overexpressing PNN and/or
KCNQ1OT1 are warranted to determine the role of PNN and/or KCNQ1OT1 in tumor progression and in 5-fluo-rouracil and/or oxaliplatin sensitivity/resistance.
Overall, it would be important to make PNN and
KCNQ1OT1 clinically actionable. According to the poten-tial ability of both genes to predict tumor drug response, they could be used as biomarkers of drug response in
early stage CRC patients. In particular, the evaluation of
PNN and KCNQ1OT1 gene expression could be infor-mative in relation to the probability of clinical outcome (DFS) to standard adjuvant chemotherapy according to the two cutoff we identified, being able to discriminate between recurrent and nonrecurrent disease. In addi-tion, our results, although on a small number of patients, showed that the presence of only one overexpressed gene out of the two (PNN or KCNQ1OT1) negatively affects DFS. This observation introduces an added value in rela-tion to the interchangeability of these biomarkers.
Our results also showed that PNN gene expression is highly concordant with PININ protein expression, thus the detection of PININ expression levels by IHC could also be proposed as a potential clinical diagnostic test predictive of treatment outcome. In fact, although we analyzed PININ expression levels in a limited number of patients, the approach we followed, i.e. the selection of samples in relation to a ratio of the expression between tumor and normal tissues, further supports the reliabil-ity of the gene/protein concordance. If the role of PNN/ PININ as a predictive biomarker will be further consoli-dated in a prospective translational study, the expression of PININ could be detected by a simple diagnostic IHC method in tumor samples before the starting of chemo-therapeutic treatment.
Moreover, the role of PNN and KCNQ1OT1, as predic-tive factors of tumor drug resistance/response to standard cytotoxic therapeutics along with their involvement in can-cer progression, suggest that they could also be exploited as potential therapeutic targets. Pharmacological strategies aimed at inhibiting PNN client ERK proteins could prob-ably inhibit the modulatory effects of PNN on the MAPK signaling pathway. For instance, ERK1/2 inhibitors (e.g., ulixertinib, LY3214996, and LTT462) that are undergoing phase I clinical investigation69 could be a potential option for patients with high PNN/PININ expression levels.
Due to the ability of KCNQ1OT1 to positively or negatively regulate the expression of several genes, its silencing through synthetic chemical compounds (e.g., pyrrole–imidazole polyamide)70 or through the potential targeting of interacting epigenetic enzymes using differ-ent approaches (e.g., small molecules, aODNs) could rep-resent a valid option to be considered.
In conclusion, our data derived from a retrospective study confirm previous observations reported by us and by others on the role of PNN and KCNQ1OT1 as bio-markers predictive of drug response. These findings deserve to be validated in a larger number of early stage CRC patients to be treated with standard adjuvant chemo-therapy in future retrospective and prospective studies. ACKNOWLEDGMENTS: This study was supported by Associazione Giacomo Onlus 2018-2019 (to E.M.), Intesa San Paolo S.p.A. Fondo di Beneficenza Project No. B/2019/0319 (to
E.M.), AIRC (Associazione Italiana per la Ricerca sul Cancro) IG15565 (to E.M.), and FFABR 2017 (Fondo di Finanziamento per le Attività Base di Ricerca 2017) (to S.N.). The authors declare no conflicts of interest.
REFERENCES
Global Burden of Disease Cancer Collaboration Study. 1.
Global, regional, and national cancer incidence, mortality, years of life lost, years lived with disability, and disability-adjusted life-years for 29 cancer groups, 1990 to 2017: A systematic analysis for the global burden of disease study. JAMA Oncol. 2019;5(12):1749–68.
National Comprehensive Cancer Network (NCCN) Clinical 2.
Practice Guidelines in oncology (NCCN Guidelines). Colon Cancer version 2.2021 - January 21, 2021.
Dienstmann R, Salazar R, Tabernero J. Personalizing colon 3.
cancer adjuvant therapy: Selecting optimal treatments for individual patients. J Clin Oncol. 2015;33(16):1787–96. Gao P, Song YX, Wang ZN, Xu YY, Tong LL, Sun JX, Yu 4.
M, Xu HM. Is the prediction of prognosis not improved by the seventh edition of the TNM classification for col-orectal cancer? Analysis of the surveillance, epidemiol-ogy, and end results (SEER) database. BMC Cancer 2013; 13:123.
Cancer Genome Atlas Network. Comprehensive molecular 5.
characterization of human colon and rectal cancer. Nature 2012;487(7407):330–7.
The ICGC/TCGA Pan-Cancer Analysis of Whole Genomes 6.
Consortium. Pan-cancer analysis of whole genomes. Nature 2020;578(7793):82–93.
Dienstmann R, Mason MJ, Sinicrope FA, Phipps AI, 7.
Tejpar S, Nesbakken A, Danielsen SA, Sveen A, Buchanan DD, Clendenning M, Rosty C, Bot B, Alberts SR, Milburn Jessup J, Lothe RA, Delorenzi M, Newcomb PA, Sargent D, Guinney J. Prediction of overall survival in stage II and III colon cancer beyond TNM system: A retrospec-tive, pooled biomarker study. Ann Oncol. 2017;28(5): 1023–31.
Vogelstein B, Papadopoulos N, Velculescu VE, Zhou S, 8.
Diaz LA Jr, Kinzler KW. Cancer genome landscapes. Science 2013;339(6127):1546–58.
Le DT, Durham JN, Smith KN, Wang H, Bartlett BR, 9.
Aulakh LK, Lu S, Kemberling H, Wilt C, Luber BS, Wong F, Azad NS, Rucki AA, Laheru D, Donehower R, Zaheer A, Fisher GA, Crocenzi TS, Lee JJ, Greten TF, Duffy AG, Ciombor KK, Eyring AD, Lam BH, Joe A, Kang SP, Holdhoff M, Danilova L, Cope L, Meyer C, Zhou S, Goldberg RM, Armstrong DK, Bever KM, Fader AN, Taube J, Housseau F, Spetzler D, Xiao N, Pardoll DM, Papadopoulos N, Kinzler KW, Eshleman JR, Vogelstein B, Anders RA, Diaz LA Jr. Mismatch repair deficiency pre-dicts response of solid tumors to PD-1 blockade. Science 2017;357(6349):409–13.
Kopetz S, Grothey A, Yaeger R, Van Cutsem E, Desai J, 10.
Yoshino T, Wasan H, Ciardiello F, Loupakis F, Hong YS, Steeghs N, Guren TK, Arkenau HT, Garcia-Alfonso P, Pfeiffer P, Orlov S, Lonardi S, Elez E, Kim TW, Schellens JHM, Guo C, Krishnan A, Dekervel J, Morris V, Calvo Ferrandiz A, Tarpgaard LS, Braun M, Gollerkeri A, Keir C, Maharry K, Pickard M, Christy-Bittel J, Anderson L, Sandor V, Tabernero J. Encorafenib, binimetinib, and cetuximab in BRAFV600E-mutated colorectal cancer. N Engl J Med. 2019;381(17):1632–43.
Kopetz S. New therapies and insights into the changing 11.
landscape of colorectal cancer. Nat Rev Gastroenterol Hepatol. 2019;16(2):79–80.
Zaanan A, Shi Q, Taieb J, Alberts SR, Meyers JP, Smyrk 12.
TC, Julie C, Zawadi A, Tabernero J, Mini E, Goldberg RM, Folprecht G, Van Laethem JL, Le Malicot K, Sargent DJ, Laurent-Puig P, Sinicrope FA. Role of deficient DNA mis-match repair status in patients with stage iii colon cancer treated with FOLFOX adjuvant chemotherapy: A pooled analysis from 2 randomized clinical trials. JAMA Oncol. 2018;4(3):379–83.
Sinicrope FA, Chakrabarti S, Laurent-Puig P, Huebner L, 13.
Smyrk TC, Tabernero J, Mini E, Goldberg RM, Zaanan A, Folprecht G, Van Laethem JL, Le Malicot K, Shi Q, Alberts SR, Taieb J. Prognostic variables in low and high risk stage III colon cancers treated in two adjuvant chemotherapy tri-als. Eur J Cancer 2021;144:101–12.
Taieb J, Le Malicot K, Shi Q, Penault-Llorca F, Bouché O, 14.
Tabernero J, Mini E, Goldberg RM, Folprecht G, Luc Van Laethem J, Sargent DJ, Alberts SR, Emile JF, Laurent Puig P, Sinicrope FA. Prognostic value of BRAF and KRAS mutations in MSI and MSS stage III colon cancer. J Natl Cancer Inst. 2016;109(5):djw272.
Gallois C, Taieb J, Le Corre D, Le Malicot K, Tabernero J, 15.
Mulot C, Seitz JF, Aparicio T, Folprecht G, Lepage C, Mini E, Van Laethem JL, Emile JF, Laurent-Puig P; PETACC8 investigators. Prognostic value of methylator phenotype in stage III colon cancer treated with oxaliplatin-based adjuvant chemotherapy. Clin Cancer Res. 2018;24(19):4745–53. Emile JF, Julié C, Le Malicot K, Lepage C, Tabernero 16.
J, Mini E, Folprecht G, Van Laethem JL, Dimet S, Boulagnon-Rombi C, Allard MA, Penault-Llorca F, Bennouna J, Laurent-Puig P, Taieb J; PETACC8 Study Investigators; Austrian Breast and Colorectal cancer Study Group (ABCSG); Belgian Group of Digestive Oncology (BGDO); Lone Nørgård Petersen; Fédération Francophone de Cancérologie Digestive (FFCD); Fédération Nationale des Centres de Lutte Contre le Cancer (UNICANCER); Fédération Nationale des Centres de Lutte Contre le Cancer Association Européenne de Recherche en Oncologie (AERO); Arbeitsgemeinschaft Internistische Onkologie (AIO); Gruppo Italiano per lo Studio dei Carcinomi dell’Apparato Digerente (GISCAD); Gruppo Oncologico dell’Italia Meridionale (GOIM); Istituto Oncologico Romagnolo (IOR); Gruppo Cooperativo Chirurgico Italiano (GOCCI); Gruppo Oncologico Nord Ovest (GONO); Gruppo Oncologico Italiano di Ricerca Clinica (GOIRC); Gruppo Cooperativo do Cancro Digestivo da Associação Portuguesa de Investigação Oncológica (GCCD, APIO); Grupo Español para el Tratamiento de los Tumores Digestivos (TTD); John Allen Bridgewater. Prospective validation of a lymphocyte infiltration prognostic test in stage III colon cancer patients treated with adjuvant FOLFOX. Eur J Cancer 2017;82:16–24.
Allen WL, Dunne PD, McDade S, Scanlon E, Loughrey 17.
M, Coleman H, McCann C, McLaughlin K, Nemeth Z, Syed N, Jithesh P, Arthur K, Wilson R, Coyle V, McArt D, Murray GI, Samuel L, Nuciforo P, Jimenez J, Argiles G, Dienstmann R, Tabernero J, Messerini L, Nobili S, Mini E, Sheahan K, Ryan E, Johnston PG, Van Schaeybroeck S, Lawler M, Longley DB. Transcriptional subtyping and CD8 immunohistochemistry identifies poor prognosis stage II/III colorectal cancer patients who benefit from adjuvant chemotherapy. JCO Precis Oncol. 2018;2:PO.17.00241.
Pagès F, André T, Taieb J, Vernerey D, Henriques J, Borg C, 18.
Marliot F, Ben Jannet R, Louvet C, Mineur L., Bennouna J, Desrame J, Faroux R, Kirilovsky A, Duval A, Plaurent-Puig P, Svrcek M, Catteau A, Galon J, Emile J-F. Prognostic and predictive value of the Immunoscore in stage III colon cancer patients treated with oxaliplatin in the prospective IDEA France PRODIGE-GERCOR cohort study. Ann Oncol. 2020;31(7):921–9.
Sveen A, Kopetz S, Lothe RA. Biomarker-guided therapy 19.
for colorectal cancer: Strength in complexity. Nat Rev Clin Oncol. 2020;17(1):11–32.
Becht E, de Reyniès A, Giraldo NA, Pilati C, Buttard B, 20.
Lacroix L, Selves J, Sautès-Fridman C, Laurent-Puig P, Fridman WH. Immune and stromal classification of col-orectal cancer is associated with molecular subtypes and relevant for precision immunotherapy. Clin Cancer Res. 2016;22(16):4057–66.
Galon J, Hermitte F, Mlecnik B, Marliot F, Bifulco CB, 21.
Lugli A, Nagtegaal ID, Hartmann A, Van Den Eynde M, Roehrl MHA, Ohashi PS, Zavadova E, Torigoe T, Patel PS, Wang Y, Kawakami Y, Marincola F, Ascierto PA, Fox BA, Pages F. Immunoscore clinical utility to identify good prog-nostic colon cancer stage II patients with high-risk clinico-pathological features for whom adjuvant treatment may be avoided. J Clin Oncol. 2019;37:(4 Suppl):487.
Sondka Z, Bamford S, Cole CG, Ward SA, Dunham I, 22.
Forbes SA. The COSMIC cancer gene census: Describing genetic dysfunction across all human cancers. Nat Rev Cancer 2018;18(11):696–705.
Sinicrope FA, Ou Fs, Shi Q, Nixon AB, Mody K, Levasseur 23.
A, Dueck AC, Dhanarajan AR, Lieu CH, Cohen DJ, Innocenti F, Behrens RJ, Peters W, Sargent DJ, Sommer N, O’Reilly EM, Meyerhardt J. Randomized trial of FOLFOX alone or combined with atezolizumab as adju-vant therapy for patients with stage III colon cancer and deficient DNA mismatch repair or microsatellite instabil-ity (ATOMIC, Alliance A021502). J Clin Oncol. 2017;35: (15 Suppl):TPS363035.
Popat S, Matakidou A, Houlston RS. Thymidylate syn-24.
thase expression and prognosis in colorectal cancer: A systematic review and meta-analysis. J Clin Oncol. 2004;22(3):529–36.
Nobili S, Napoli C, Landini I, Morganti M, Cianchi F, 25.
Valanzano R, Tonelli F, Cortesini C, Mazzei T, Mini E. Identification of potential pharmacogenomic markers of clinical efficacy of 5-fluorouracil in colorectal cancer. Int J Cancer 2011;128(8):1935–45.
Guinney J, Dienstmann R, Wang X, de Reyniès A, Schlicker 26.
A, Soneson C, Marisa L, Roepman P, Nyamundanda G, Angelino P, Bot BM, Morris JS, Simon IM, Gerster S, Fessler E, De Sousa E Melo F, Missiaglia E, Ramay H, Barras D, Homicsko K, Maru D, Manyam GC, Broom B, Boige V, Perez-Villamil B, Laderas T, Salazar R, Gray JW, Hanahan D, Tabernero J, Bernards R, Friend SH, Laurent-Puig P, Medema JP, Sadanandam A, Wessels L, Delorenzi M, Kopetz S, Vermeulen L, Tejpar S. The con-sensus molecular subtypes of colorectal cancer. Nat Med. 2015;21(11):1350–6.
Isella C, Brundu F, Bellomo SE, Galimi F, Zanella E, 27.
Porporato R, Petti C, Fiori A, Orzan F, Senetta R, Boccaccio C, Ficarra E, Marchionni L, Trusolino L, Medico E, Bertotti A. Selective analysis of cancer-cell intrinsic transcriptional traits defines novel clinically relevant subtypes of colorec-tal cancer. Nat Commun. 2017;8:15107.
Song N, Pogue-Geile KL, Gavin PG, Yothers G, Kim SR, 28.
Johnson NL, Lipchik C, Allegra CJ, Petrelli NJ, O’Connell MJ, Wolmark N, Paik S. Clinical outcome from oxali-platin treatment in stage II/III colon cancer according to intrinsic subtypes: Secondary analysis of NSABP C-07/ NRG oncology randomized clinical trial. JAMA Oncol. 2016;2(9):1162–9.
Mini E, Lapucci A, Perrone G, D’Aurizio R, Napoli C, 29.
Brugia M, Landini I, Tassi R, Picariello L, Simi L, Mancini I, Messerini L, Magi A, Pinzani P, Mazzei T, Tonelli F, Nobili S. RNA sequencing reveals PNN and KCNQ1OT1 as predictive biomarkers of clinical outcome in stage III colorectal cancer patients treated with adjuvant chemother-apy. Int J Cancer 2019;145(9):2580–93.
Ouyang P, Sugrue SP. Identification of an epithelial protein 30.
related to the desmosome and intermediate filament net-work. J Cell Biol. 1992;118(6):1477–88.
Shi Y, Ouyang P, Sugrue SP. Characterization of the gene 31.
encoding pinin/DRS/memA and evidence for its potential tumor suppressor function. Oncogene 2000;19(2):289–97. Yang X, Sun D, Dong C, Tian Y, Gao Z, Wang L. Pinin 32.
associates with prognosis of hepatocellular carcinoma through promoting cell proliferation and suppressing glu-cose deprivation-induced apoptosis. Oncotarget 2016; 7(26):39694–704.
Wei Z, Ma W, Qi X, Zhu X, Wang Y, Xu Z, Luo J, Wang D, 33.
Guo W, Li X, Xin S, Yu J, Li G. Pinin facilitated proliferation and metastasis of colorectal cancer through activating EGFR/ ERK signaling pathway. Oncotarget 2016;7(20):29429–39. Zhang Y, Kwok JS, Choi PW, Liu M, Yang J, Singh M, Ng SK, 34.
Welch WR, Muto MG, Tsui SK, Sugrue SP, Berkowitz RS, Ng SW. Pinin interacts with C-terminal binding proteins for RNA alternative splicing and epithelial cell identity of human ovarian cancer cells. Oncotarget 2016;7(10):11397–411. Ransohoff JD, Wei Y, Khavari PA. The functions and 35.
unique features of long intergenic non-coding RNA. Nat Rev Mol Cell Biol. 2018;19(3):143–57.
Bliek J, Maas SM, Ruijter JM, Hennekam RC, Alders 36.
M, Westerveld A, Mannens MM. Increased tumour risk for BWS patients correlates with aberrant H19 and not KCNQ1OT1 methylation: Occurrence of KCNQ1OT1 hypomethylation in familial cases of BWS. Hum Mol Genet. 2001;10(5):467–76.
Feng W, Wang C, Liang C, Yang H, Chen D, Yu X, Zhao W, 37.
Geng D, Li S, Chen Z, Sun M. The dysregulated expression of KCNQ1OT1 and its interaction with downstream fac-tors miR-145/CCNE2 in breast cancer cells. Cell Physiol Biochem. 2018;49(2):432–46.
Gong W, Zheng J, Liu X, Liu Y, Guo J, Gao Y, Tao W, 38.
Chen J, Li Z, Ma J, Xue Y. Knockdown of long non-coding RNA KCNQ1OT1 restrained glioma cells’ malignancy by activating miR-370/CCNE2 axis. Front Cell Neurosci. 2017;11:84.
Sun H, Li Y, Kong H, Dai S, Qian H. Dysregulation of 39.
KCNQ1OT1 promotes cholangiocarcinoma progression via miR-140-5p/SOX4 axis. Arch Biochem Biophys. 2018; 658:7–15.
Li C, Miao R, Zhang J, Qu K, Liu C. Long non-coding 40.
RNA KCNQ1OT1 mediates the growth of hepatocellular carcinoma by functioning as a competing endogenous RNA of miR-504. Int J Oncol. 2018;52(5):1603–12.
Guo B, Zhang Q, Wang H, Chang P, Tao K. KCNQ1OT1 41.
promotes melanoma growth and metastasis. Aging (Albany NY) 2018;10(4):632–44.
Wu Y, Bi QJ, Han R, Zhang Y. Long noncoding RNA 42.
KCNQ1OT1 is correlated with human breast cancer cell development through inverse regulation of hsa-miR-107. Biochem Cell Biol. 2020;98(3):338–44.
Wang Y, Zhang L, Yang J, Sun R. LncRNA KCNQ1OT1 43.
promotes cell proliferation, migration and invasion via regulating miR-129-5p/JAG1 axis in non-small cell lung cancer. Cancer Cell Int. 2020;20:144.
Ren K, Xu R, Huang J, Zhao J, Shi W. Knockdown of long 44.
non-coding RNA KCNQ1OT1 depressed chemoresistance to paclitaxel in lung adenocarcinoma. Cancer Chemother Pharmacol. 2017;80(2):243–50.
Xian D, Zhao Y. LncRNA KCNQ1OT1 enhanced the meth-45.
otrexate resistance of colorectal cancer cells by regulating miR-760/PPP1R1B via the cAMP signaling pathway. J Cell Mol Med. 2019;23(6):3808–23.
Li Y, Li C, Li D, Yang L, Jin J, Zhang B. lncRNA 46.
KCNQ1OT1 enhances the chemoresistance of oxaliplatin in colon cancer by targeting the miR-34a/ATG4B pathway. Onco Targets Ther. 2019;12:2649–60.
Qi X, Yu XJ, Wang XM, Song TN, Zhang J, Guo XZ, Li 47.
GJ, Shao M. Knockdown of KCNQ1OT1 suppresses cell invasion and sensitizes osteosarcoma cells to CDDP by upregulating DNMT1-mediated Kcnq1 expression. Mol Ther Nucleic Acids 2019;17:804–18.
Zhang S, Ma H, Zhang D, Xie S, Wang W, Li Q, Lin Z, Wang 48.
Y. LncRNA KCNQ1OT1 regulates proliferation and cispla-tin resistance in tongue cancer via miR-211-5p mediated Ezrin/Fak/Src signaling. Cell Death Dis. 2018;9(7):742. Qiao CY, Qiao TY, Jin H, Liu LL, Zheng MD, Wang ZL. 49.
LncRNA KCNQ1OT1 contributes to the cisplatin resistance of tongue cancer through the KCNQ1OT1/miR-124-3p/TRIM14 axis. Eur Rev Med Pharmacol Sci. 2020;24(1):200–12. Di Paolo A, Lencioni M, Amatori F, Di Donato S, Bocci G, 50.
Orlandini C, Lastella M, Federici F, Iannopollo M, Falcone A, Ricci S, Del Tacca M, Danesi R. 5-fluorouracil pharma-cokinetics predicts disease-free survival in patients admin-istered adjuvant chemotherapy for colorectal cancer. Clin Cancer Res. 2008;14(9):2749–55.
Efficacy of adjuvant fluorouracil and folinic acid in 51.
colon cancer. International Multicentre Pooled Analysis of Colon Cancer Trials (IMPACT) investigators. Lancet 1995;345(8955):939–44.
Dong Z, Yang P, Qiu X, Liang S, Guan B, Yang H, Li F, 52.
Sun L, Liu H, Zou G, Zhao K. KCNQ1OT1 facilitates progression of non-small-cell lung carcinoma via modu-lating miRNA-27b-3p/HSP90AA1 axis. J Cell Physiol. 2019;234(7):11304–14.
Brandner JM, Reidenbach S, Franke WW. Evidence that 53.
“pinin,” reportedly a differentiation-specific desmo-somal protein, is actually a widespread nuclear protein. Differentiation 1997;62(3):119–27.
Ouyang P. Antibodies differentiate desmosome-form 54.
and nucleus-form pinin: Evidence that pinin is a moon-lighting protein with dual location at the desmosome and within the nucleus. Biochem Biophys Res Commun. 1999;263(1):192–200.
Wang P, Lou PJ, Leu S, Ouyang P. Modulation of alterna-55.
tive pre-mRNA splicing in vivo by pinin. Biochem Biophys Res Commun. 2002;294(2):448–55.
Alpatov R, Shi Y, Munguba GC, Moghimi B, Joo JH, Bungert 56.
J, Sugrue SP. Corepressor CtBP and nuclear speckle protein Pnn/DRS differentially modulate transcription and splicing of the E-cadherin gene. Mol Cell Biol. 2008;28(5):1584–95.
Kang GJ, Park MK, Byun HJ, Kim HJ, Kim EJ, Yu L, 57.
Kim B, Shim JG, Lee H, Lee CH. SARNP, a participant in mRNA splicing and export, negatively regulates E-cadherin expression via interaction with pinin. J Cell Physiol. 2020;235(2):1543–55.
Yamashita A, Hakura A, Inoue H. Suppression of anchor-58.
age-independent growth of human cancer cell lines by the drs gene. Oncogene 1999;18(34):4777–87.
Mukaisho K, Suo M, Shimakage M, Kushima R, Inoue H, 59.
Hattori T. Down-regulation of drs mRNA in colorectal neo-plasms. Jpn J Cancer Res. 2002;93(8):888–93.
Tambe Y, Isono T, Haraguchi S, Yoshioka-Yamashita A, 60.
Yutsudo M, Inoue H. A novel apoptotic pathway induced by the drs tumor suppressor gene. Oncogene 2004;23(17):2977–87. Leu S, Lin YM, Wu CH, Ouyang P. Loss of Pnn expression 61.
results in mouse early embryonic lethality and cellular apop-tosis through SRSF1-mediated alternative expression of Bcl-xS and ICAD. J Cell Sci. 2012;125(Pt 13):3164–72. Tang T, Yang L, Cao Y, Wang M, Zhang S, Gong Z, Xiong 62.
F, He Y, Zhou Y, Liao Q, Xiang B, Zhou M, Guo C, Li X, Li Y, Xiong W, Li G, Zeng Z. LncRNA AATBC regulates Pinin to promote metastasis in nasopharyngeal carcinoma. Mol Oncol. 2020;14(9):2251–70.
Chiesa N, De Crescenzo A, Mishra K, Perone L, Carella M, 63.
Palumbo O, Mussa A, Sparago A, Cerrato F, Russo S, Lapi E, Cubellis MV, Kanduri C, Cirillo Silengo M, Riccio A, Ferrero GB. The KCNQ1OT1 imprinting control region and non-coding RNA: New properties derived from the study of Beckwith-Wiedemann syndrome and Silver-Russell syn-drome cases. Hum Mol Genet. 2012;21(1):10–25. Sunamura N, Ohira T, Kataoka M, Inaoka D, Tanabe H, 64.
Nakayama Y, Oshimura M, Kugoh H. Regulation of functional KCNQ1OT1 lncRNA by b-catenin. Sci Rep. 2016;6:20690.
Zhang Z, Qian W, Wang S, Ji D, Wang Q, Li J, Peng W, 65.
Gu J, Hu T, Ji B, Zhang Y, Wang S, Sun Y. Analysis of lncRNA-associated ceRNA network reveals potential lncRNA biomarkers in human colon adenocarcinoma. Cell Physiol Biochem. 2018;49(5):1778–91.
Sun X, Xin Y, Wang M, Li S, Miao S, Xuan Y, Wang Y, Lu 66.
T, Liu J, Jiao W. Overexpression of long non-coding RNA KCNQ1OT1 is related to good prognosis via inhibiting cell proliferation in non-small cell lung cancer. Thorac Cancer 2018;9(5):523–31.
Wang W, Zhang J, Zhan X, Lin T, Yang M, Hu J, Han 67.
B, Hu S. SOX4 is associated with poor prognosis in cholangiocarcinoma. Biochem Biophys Res Commun. 2014;452(3):614–21.
Zhu Z, Jin Z, Zhang H, Zhang M, Sun D. Integrative clus-68.
tering reveals a novel subtype of soft tissue sarcoma with poor prognosis. Front Genet. 2020;11:69.
Sullivan RJ, Infante JR, Janku F, Lee Wong DJ, Sosman 69.
JA, Keedy V, Patel MR, Shapiro GI, Mier JW, Tolcher AW, A Wang-Gillam A, Sznol M, Flaherty K, Buchbinder E, Carvajal RD, Varghese AM, Lacouture ME, Ribas A, Patel SP, DeCrescenzo GA, Emery CM, Groover AL, Saha S, Varterasian M, Welsch DJ, Hyman DM, Li BT. First-in-class ERK1/2 inhibitor ulixertinib (BVD-523) in patients with MAPK mutant advanced solid tumors: Results of a phase I dose-escalation and expansion study. Cancer Discov. 2018;8(2):184–95.
Chin HM, Lai DK, Falchook GS. Extracellular signal- 70.
regulated kinase (ERK) inhibitors in oncology clinical tri-als. J Immunother Precision Oncol. 2019;2(1):10–6.