■ C A S E R E P O R T ■
Optical Coherence
Tomography
Angiography in the
Multimodal Imaging
Evaluation of
Interferon-Associated Retinopathy:
A Case Report
Leonardo Mastropasqua, MD; Enrico Borrelli, MD; Francesco Amodei, MD;
Agbeanda Aharrh-Gnama, MD; Lisa Toto, MD; Peter A. Mattei, MD; Rodolfo Mastropasqua, MD
ABSTRACT: The authors present the case of a 59-year-old woman in treatment with interferon alfa-2b for stage IV melanoma and widespread me-tastases who presented with interferon-associated retinopathy. An ocular examination revealed mul-tiple retinal cotton-wool spots and hard exudates. Interferon treatment was suspended. The patient was followed up for 5 months following the base-line visit by means of en face optical coherence tomography (OCT), spectral-domain OCT, and OCT angiography. Multimodal imaging was useful in the follow-up of this condition, permitting the characterization of all the lesions hallmarking the interferon-retinopathy and showing that this ill-ness was related to a reduction of the retinal vas-cular perfusion.
[Ophthalmic Surg Lasers Imaging Retina. 2017;48:498-504.]
INTRODUCTION
Interferon (IFN) is a family of glycoproteins in-volved in immunological response used as therapy for numerous pathologies, including chronic hepa-titis C,1 multiple sclerosis,2 and malignancies.3 A
not infrequent complication is mild and usually re-versible retinopathy.4
Recent advances in spectral-domain optical co-herence tomography (SD-OCT) and en face SD-OCT scans have resulted in detailed images of retinal structure, which have been used to show changes in various pathologies. OCT angiography (OCTA) is a new en face imaging technique capable of providing images of the retinal and choroidal microvascula-ture without requiring dye.5,6
In this report, we illustrated how a multimodal imaging approach was useful in the diagnosis and follow-up of this rare condition, in addition to il-lustrating novel signs that provide insight into the pathogenesis of this disorder.
CASE REPORT
A 59-year-old woman was referred to our depart-ment with metamorphopsia and scotomas in both eyes (OU) for 7 days. The patient had been in treat-ment with interferon alfa-2b for stage IV melanoma and widespread metastases for 10 weeks. Her medi-cal history was otherwise unremarkable.
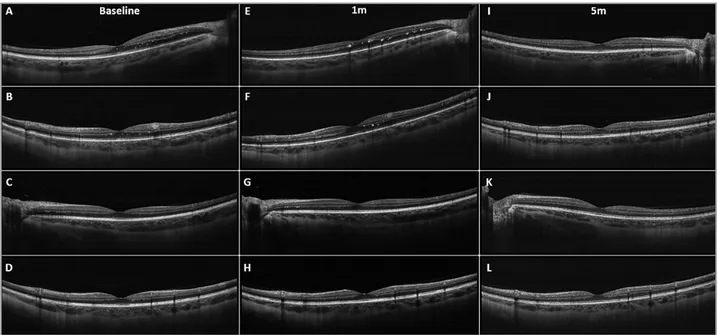
At presentation, best-corrected visual acuity (BCVA) was 0.0 LogMAR for both eyes. Slit-lamp anterior segment examination and intraocular pres-sure were normal. Funduscopy revealed extensive macular cotton-wool spots and hard exudates OU, the latter located mainly in the superior-nasal mac-ular regions. The patient also underwent SD-OCT (AngioVue; OptoVue, Fremont, CA) examina-tion. Peripapillary B-scan revealed swelling of the retinal nerve fiber layer (RNFL) OU, especially in the superior and inferior temporal sectors. Macu-lar linear B-scans revealed some Macu-large hyperre-flective lesions in the RNFL (corresponding to cotton-wool spots) and numerous smaller hyper-reflective dots in the outer plexiform layer (OPL) corresponding to hard exudates (Figure 1). En face analysis clearly visualized these lesions. The hyperreflective lesions in the RNLF were circle-shaped and were distributed throughout the extra- foveal macular regions, corresponding to fundus-copy location of cotton-wool spots (Figure 2). The hyperreflective dots in the OPL formed a macular star-like lesion and were also distributed in the su-perior-nasal and in the nasal sectors of the macula (Figure 3). Furthermore, en face OCT showed swell-ing of the arcuate nerve fibers. OCTA detected a
From the Ophthalmology Clinic, Department of Medicine and Science of Ageing, University G. D’Annunzio Chieti-Pescara, Chieti, Italy (LM, EB, FA, AAG, LT, PAM); and Moorfields Eye Hospital NHS Foundation Trust, London, United Kingdom (RM).
Originally submitted August 31, 2016. Revision received January 9, 2017. Accepted for publication February 22, 2017.
The authors report no relevant financial disclosures.
Address correspondence to Enrico Borrelli, MD, Via dei Vestini 6, Chieti, Italy; email: [email protected].
diffuse reduction in capillary perfusion in both the superficial and the deep capillary plexuses (Figures 4 and 5). Thus, a diagnosis of interferon-related reti-nopathy was made.
In agreement with the oncology team, IFN treat-ment was suspended.
At the 1-month follow-up visit, the BCVA was 0.0 LogMAR in both eyes with an improvement of visual symptoms. Both the SD-OCT and en face OCT showed an incomplete resolution of the hyper-reflective lesions in the RNFL. The smaller hyperre-flective dots in the OPL were similar in number and size to those observed at presentation (Figures 1-3). At the 5-month follow-up visit after the interrup-tion of the IFN therapy, BCVA was still 0.0 LogMAR in both eyes and visual symptoms were completely resolved. OCT showed that RNFL swelling and cir-cle-shaped hyperreflective lesions were completely resolved with no consequences, and hyperreflective dots in the OPL were significantly reduced in num-ber and size (Figures 1-3). OCTA revealed an evi-dent bilateral increase in macular perfusion that was more evident in the deep capillary plexus (Figures 4 and 5).
DISCUSSION
Although IFN-associated retinopathy is not rare, it is usually subclinical and reversible.7,8 Typical
signs of IFN-associated retinopathy are cotton-wool infarcts and superficial hemorrhages, whereas
mac-ular edema, retinal vascmac-ular occlusion, and other ischemic complications are less common (eg, isch-emic optic neuropathy).4,9 Cases of severe
retinopa-thy were more frequently described in patients with diabetes and hypertension.7 In these cases, vision
loss might be only partially reversible.10
The pathogenic process in IFN retinopathy is controversial. Yoshitoshi et al.11 hypothesized that
IFN retinopathy is secondary to an immunological dysfunction, whereas Guyer et al.12 suggested an
im-mune complex deposition in the retinal vasculature and a subsequent retinal capillary perfusion failure. The latter hypothesis is more plausible, given that it better explains most of the possible manifestations of the disease, mainly associated with retinal isch-emia. It also explains why other microangiopathies, above all diabetes and hypertension, are considered as risk factors for the development of IFN-associat-ed retinopathy.4
Several studies demonstrated the utility of SD-OCT in detecting macular edema in patients affect-ed by IFN retinopathy.13–15 Nevertheless, changes in
macular perfusion observed with OCTA in patients affected by IFN-related retinopathy have not been reported previously. In our case, OCTA showed a reduction in both superficial and deep retinal vas-cular perfusion. Perfusion significantly improved within 5 months after interruption of IFN. This sup-ports the theory that IFN retinopathy is secondary to an ischemic process.
Figure 1. Spectral-domain optical coherence tomography (SD-OCT) scans performed at baseline, at the 1-month visit (1m), and at the 5-month visit (5m). At baseline, both horizontal (A, C) and vertical (B, D) scans of the right eye (OD) and of the left eye (OS) revealed large hyperreflective lesions in the retinal nerve fiber layer and smaller hyperreflective dots in the outer plexiform layer. These lesions tended to disappear in horizontal (E, I) and vertical (F, J) OD scans, and horizontal (G,K) and vertical (H,L) OS scans at the follow-up visits.
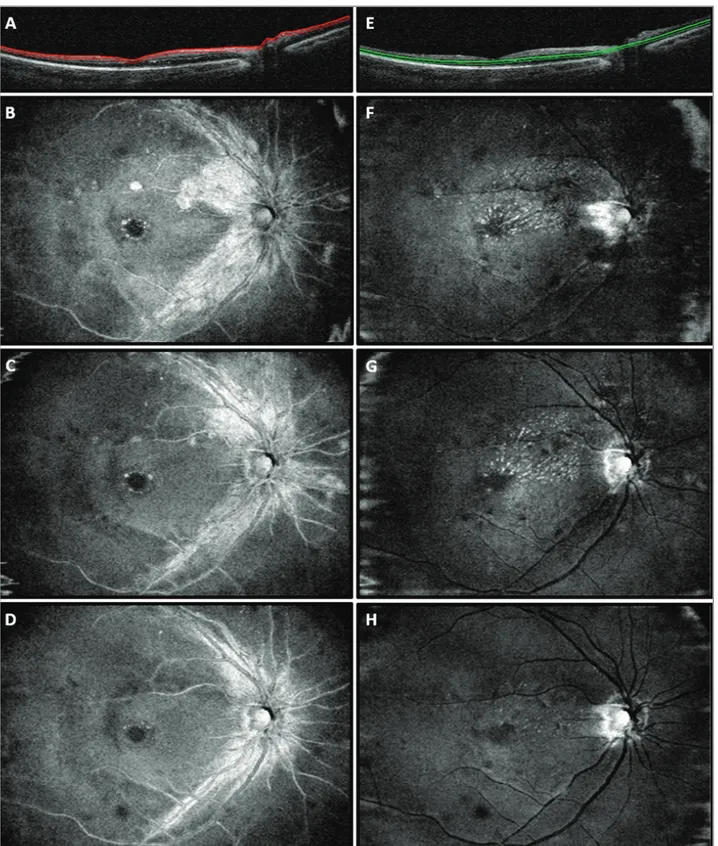
Figure 2. En face optical coherence tomography (OCT) scans from the right eye of the case report patient. (A) OCT B-scan showing the slab set to evaluate the retinal nerve fiber layer (RNFL). At baseline (B), RNFL swelling, as well as RNFL circle-shaped lesions throughout the extra-foveal macular regions, were found. These alterations improved at the 1-month follow-up visit (C) and resolved at the 5-month follow-up visit (D). (E) OCT B-scan showing the slab set to evaluate the outer plexiform layer (OPL). At baseline (F) hyperreflective dots in the OPL formed a macular star-like lesion. The number of lesions was stable at the 1-month follow-up visit (G) and reduced at the 5-month follow-up visit (H).
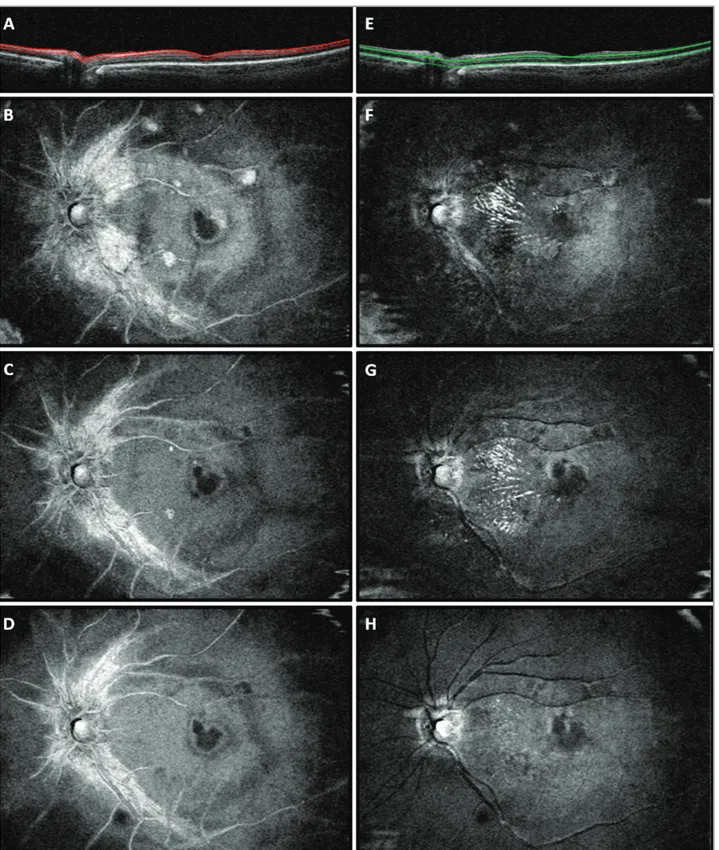
Figure 3. En face optical coherence tomography (OCT) scans from the left eye of the case report patient. (A) OCT B-scan showing the slab set to evaluate the retinal nerve fiber layer (RNFL). At baseline (B), RNFL swelling and RNFL circle-shaped lesions throughout the extra-foveal macular regions were found. The lesions improved at the 1-month follow-up visit (C), and resolved at the 5-month follow-up visit (D). (E) OCT B-scan showing the slab set to evaluate the outer plexiform layer (OPL). At baseline (F), hyperreflective dots in the OPL formed a macular star-like lesion. The lesions were stable at the 1-month follow-up visit (G) and improved at the 5-month follow-up visit (H).
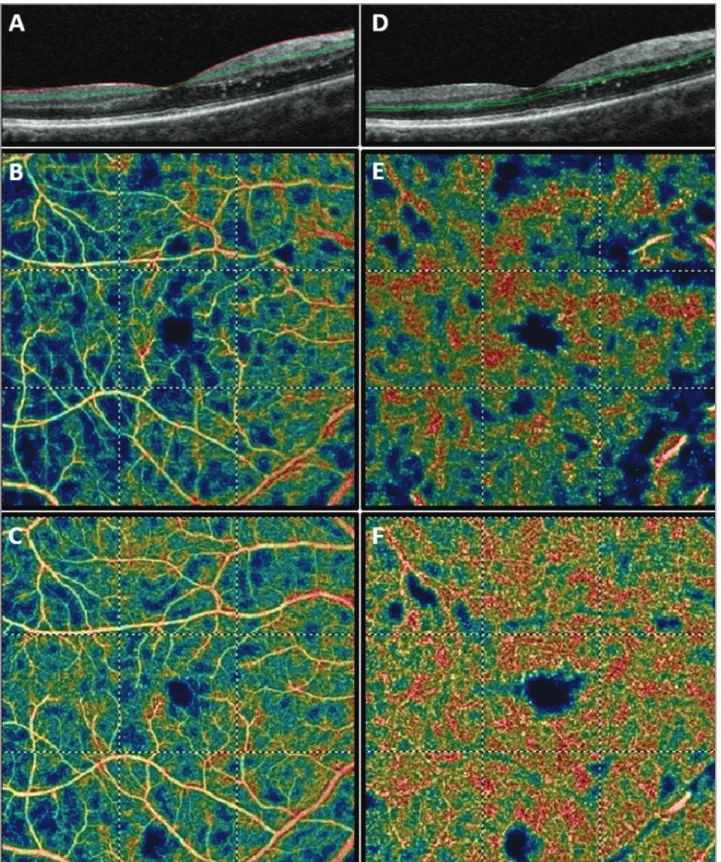
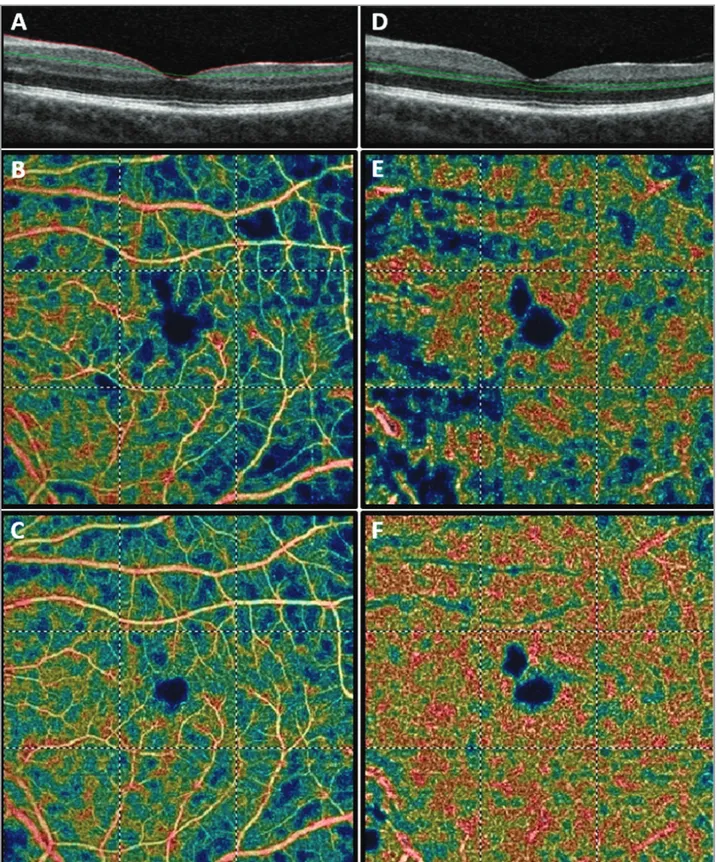
Figure 4. Optical coherence tomography angiography (OCTA) of the right eye. (A) OCT B-scan showing the slab set to evaluate the superficial retinal plexus (slab 60 µm thick starting from the inner limiting membrane). (B) Baseline OCTA color-coded flow density map of the macula 6 mm × 6 mm scan showing the superficial vascular plexus (warmer colors indicate greater flow). (C) Five-month follow-up OCTA color-coded flow density map of the macula 6 mm × 6 mm scan showing the superficial vascular plexus. (D) OCT B-scan showing the slab set to evaluate the deep retinal plexus (slab 30 µm thick layer from the inner plexiform layer). (E) Baseline OCTA color-coded flow density map of the macula 6mm × 6 mm scan showing the deep vascular plexus (the warmer is the color the greater is the flow). (F) Five-month follow-up OCTA color-coded flow density map of the macula 6 mm × 6 mm scan showing the deep vascular plexus.
Figure 5. Optical coherence tomography angiography (OCTA) of the left eye. (A) OCT B-scan showing the slab set to evaluate the superficial retinal plexus (slab 60 µm thick starting from the inner limiting membrane). (B) Baseline OCTA color-coded flow density map of macula (6 mm × 6 mm scan) showing the superficial vascular plexus (warmer colors indicate greater flow). (C) Five-month follow-up showing the superficial vascular plexus. (D) OCT B-scan showing the slab set to evaluate the deep retinal plexus (slab 30 µm thick layer from the inner plexiform layer). (E) Baseline OCTA color-coded flow density map of the macula 6 mm × 6 mm scan showing the deep vascular plexus (warmer colors indicate greater flow); (F) Five-month follow-up OCTA color-coded flow density map of the macula 6 mm × 6 mm scan showing the deep vascular plexus.
In the current case, the combination of B-scan and en face OCT analysis clearly revealed the depth and localization of the hyperreflective alterations of IFN retinopathy. Two distinctive hyperreflective al-terations were found: circle-shaped hyperreflective alterations in the RNFL distributed throughout the macula, and smaller hyperreflective dots in the OPL mainly distributed in the perifoveal region and form-ing a macular star-like lesion. Multimodal imagform-ing characterized these lesions, making an easy com-parison with funduscopical examination possible. The former alteration corresponded to RNFL infarcts and was in agreement with a retinal ischemia patho-genesis. En face visualization of the different retinal layers provided a distinct representation of the topo-graphical position of the hard exudates (correspond-ing to the latter type of hyperreflective lesion). This finding indicated the agreement between the arrange-ment and depth of these lesions and the arrangearrange-ment and the depth of Henle’s fibers. We hypothesis that these lesions are secondary to involvement of the deep capillary plexus. A reduction in the overall number of perfused vessels may lead to an increase in hydrostatic pressure and a slowdown of hematic circulation, determining a greater capillary filtration pressure that can cause this type of lesion. This is confirmed by the fact that both the deep capillary plexus and the hyperreflective lesions are located in the same layer. It is also supported by the fact that more severe retinopathy is found in patients with hy-poalbuminemia.15
These findings open new perspectives to the still-unclear pathogenesis of IFN-associated retinopathy. Directly measuring reduced flow in retinal capillary perfusion, for the first time, may strongly demon-strate the actual vascular nature of this disorder. The increase and normalization in vessel density after discontinuing IFN treatment offer strong support to the hypothesis put forth by Guyer et al.12 Vascular
perfusion assessment may become a useful method for monitoring disease progression.
In conclusion, a multimodal imaging strategy proved to be an optimal method for diagnosis and monitoring the progression of IFN-associated reti-nopathy. It also explained still unclear aspects of the pathogenesis of this infrequent disease.
REFERENCES
1. Shepherd J, Waugh N, Hewitson P. Combination therapy (interferon alfa and ribavirin) in the treatment of chronic hepatitis C: A rapid and systematic review. Health Technol Assess. 2000;4(33):1-67. 2. Plosker GL. Interferon-β-1b: A review of its use in multiple sclerosis.
CNS Drugs. 2011;25(1):67-88.
3. Goldstein D, Laszlo J. The role of interferon in cancer therapy: A current perspective. CA Cancer J Clin. 38(5):258-277.
4. Raza A, Mittal S, Sood GK. Interferon-associated retinopathy during the treatment of chronic hepatitis C: A systematic review. J Viral Hepat. 2013;20(9):593-599.
5. Spaide RF, Klancnik JM, Cooney MJ. Retinal vascular layers imaged by fluorescein angiography and optical coherence tomography angiography. JAMA Ophthalmol. 2015;133(1):45-50.
6. Dolz-Marco R, Phasukkijwatana N, Sarraf D, Freund KB. Optical coherence tomography angiography in fovea plana. Ophthalmic Surg Lasers Imaging Retina. 2016;47(7):670-673.
7. Medhat E, Esmat G, Hamza E, et al. Ophthalmological side effects of interferon therapy of chronic hepatitis C. Hepatobiliary Surg Nutr. 2016;5(3):209-216.
8. Mousa N, Besheer T, Gad Y, Elbendary A, Mokbel T, Abdel-Aziz A. Is combination therapy interferon and ribavirin in patients with chronic hepatitis C infection toxic for eyes? J Ocul Pharmacol Ther. 2013;29(3):345-348.
9. Stoffelns BM. [Interferon causes ischemic ocular diseases--case studies and review of the literature]. Klin Monatsblätter für Augenheilkd. 2006;223(5):367-371.
10. Chambers RB, Downie A, Foote B, Davidorf FH. Interferon alfa-associated retinopathy. J Am Osteopath Assoc. 1997;97(1):43-45. 11. Yoshitoshi T, Saegusa K, Watanabe A, et al. A case of panophthalmitis
developed during interferon therapy. Jpn J Ophthalmol. 1994;48:692-693.
12. Guyer DR, Tiedeman J, Yannuzzi LA, et al. Interferon-associated retinopathy. Arch Ophthalmol. 1993;111(3):350-356.
13. Borrego-Sanz L, Sáenz-Francés F, Fernández-Tresguerres MF, Jiménez-Santos M, Donate-López J. Interferon-associated retinopathy in a patient with metastatic melanoma. Arq Bras Oftalmol. 2014;77(5):321-323.
14. Sheth HG, Michaelides M, Siriwardena D. Cystoid macular edema and visual loss as sequelae to interferon alpha treatment of systemic hepatitis C. Indian J Ophthalmol. 58(2):147-148.
15. Shimura M, Saito T, Yasuda K, Tamai M. Clinical course of macular edema in two cases of interferon-associated retinopathy observed by optical coherence tomography. Jpn J Ophthalmol. 49(3):231-234.