Scuola Normale Superiore di Pisa
Tesi di perfezionamento in Neurobiologia
2011-2014
Cell dynamics during killifish embryos
development and diapause
CANDIDATO
RELATORE
1
Contents
Abstract ... 4
1. Introduction ... 6
1.1 The model taxon ... 6
1.1.1 Killifishes ... 6
1.1.2 Annualism ... 7
1.1.3 Embryogenesis and development ... 8
1.1.4 Diapause ... 11 1.1.5 Nothobranchius furzeri ... 13 1.2 Transgenesis ... 15 1.2.1 Basis of trasgenesis ... 15 1.2.2 Transgenesis in Nothobranchius ... 16 1.3 Cell cycle ... 18 1.3.1 General mechanics ... 18 1.3.2 FUCCI ... 19 Aims ... 22 2. Results ... 23 2.1 Developmental differences ... 23
2.1.1 Non-annual killifishes development description ... 26
2.1.2 Annual killifishes development description ... 29
2.1.3 Cleavage rate differences ... 30
2.2 Exploring cell dynamics during development ... 33
2.2.1 Segmentation ... 33
2.2.2 FUCCI transgenic fish... 35
2.2.3 FUCCI red F2 fish description. ... 37
2.2.4 FUCCI green F2 fish description. ... 40
2.2.5 Fin cut FUCCI green adult validation. ... 45
2.3 F3 double FUCCI fish time lapse. ... 47
2.3.1 Epiboly ... 48
2.3.2 Early dispersed phase (Wourms stages 19-20) and diapause I. ... 51
2.3.3 Release from diapause I. ... 53
2.3.4 Late dispersed phase (Wourms stage 20). ... 55
2.3.5 Reaggregation (Wourms stages 21-26). ... 56
2.3.6 Somitogenesis (Wourms stages 29-33+). ... 60
2.3.7 Diapause II ... 64
2
2.3.9 DCE development past diapause II (Wourms stages 33+). ... 68
2.3.10 Development of not-DCE ... 68
2.4 Molecular analysis of diapause ... 71
2.4.1 MicroRNAs differential analysis ... 71
2.4.2 MiR-430 expression in N. furzeri ... 75
3. Discussion ... 78
3.1 Early development in annual and non-annual killifishes ... 78
3.2 FUCCI transgenesis in N. furzeri. ... 79
3.3 Diapause I ... 79
3.4 Release from dipause I ... 81
3.5 Diapause II ... 82
3.6 Diapause molecular factors. ... 83
4. Material and methods ... 86
4.1 Fish maintenance ... 86 4.1.1 Fish husbandry ... 86 4.1.2 Fish feeding ... 86 4.2 Breeding ... 87 4.3 Eggs collection ... 87 4.4 Eggs husbandry ... 88
4.5 Transgenic eggs husbandry ... 89
4.6 Transgenic embryos screening ... 89
4.7 Transgenic lines generation ... 90
4.7.1 FUCCI plasmids construction ... 90
4.7.2 Tol2 RNA synthesis ... 91
4.7.3 Eggs injection ... 91
4.8 FUCCI synthetic RNA... 91
4.9 Mir-430 reporter RNA ... 92
4.10 Microscopy ... 92
4.10.1 Samples preparation ... 92
4.10.2 Brightfield acquisitions ... 93
4.10.3 Brightfield videos and images processing ... 93
4.10.4 Confocal acquisitions ... 93
4.10.5 Fluorescence images processing ... 94
4.10.6 Imaris analysis ... 94
4.11 Graphs productions ... 95
3
4.12.1 Samples collection ... 95
4.12.2 RNA extraction ... 96
4.12.3 Sequencing ... 96
4.13 Fin cut experiment ... 96
4.14 Mir-430 sensor experiment ... 97
4.14.1 Sensor injection ... 97
4.14.2 Sensor image acquisition ... 97
4.14.3 Sensor graph production ... 97
4
Abstract
Annual killifishes inhabit temporary ponds and their embryos survive the dry season encased in the mud by entering diapause, a process that arrests embryonic development in response to hostile conditions. During diapause oxygen consumption is suppressed and the cell cycle arrested, however the key factors responsible for these effects are largely unknown. Killifish developmental stages were described in the 70s in several species, mainly by direct microscopic observation. There is however lack of a precise description of cells dynamics during the whole developmental process. Annual killifishes are present within three clades distributed in Africa (one East and one West of the Dahomey gap) and South America. Within each of these phylogenetic clades, a non-annual clade is sister taxon to a annual clade and therefore represent an example of convergent evolution.
Transgenesis is possible in at least one among the killifishes annual species, Nothobranchius furzeri.
Early cleavage of teleost embryos is characterized by a very fast cell cycle (15-30 minutes) and lack of G1 and G2 phases. In this work I used time lapse brightfield microscopy to investigate cells division’s kinetics during the first developmental stages of annual- and non-annual species belonging to the three different phylogenetic clades. Annual killifishes of all three clades had cleavage times significantly longer when compared to their non-annual sister taxa (average 35 min vs. average 75 min), showing, for the first time, that cell cycle rate during cleavage, a trait thought to be rather evolutionary conserved can undergo convergent evolutionary change in response to variations in life-history.
Furthermore, using FUCCI fluorescent imaging of the cell cycle after microinjection in the annual species Nothobranchius furzeri, I demonstrated that the first 5 division are synchronous, do not show a G1 phase, and cell cycle synchronization is lost after the 5th cleavage division.
I generated FUCCI N. furzeri trangenic fish and finely characterized through time-lapse imaging cell cycle progression during all developmental steps: epiboly, dispersed phase, diapause I, reaggregation, somitogenesis and diapause II. I discovered that dispersed phase is divided in two steps and that diapause I arrest happens at the transition between them. In addition, I showed that the reactivation of cell cycle upon release from diapause I and II release is synchronous and very fast (hours).
Finally, I compared the microRNA profile of several species (annual and non annual) in diapause II or at the equivalent morphological stage and I identified some miRNAs that are differentially
5 expressed. Among these the miR-430 cluster is a particularly interesting candidate since it plays a key role during early development of zebrafish embryos.
6
1.
Introduction
1.1 The model
taxon
1.1.1 Killifishes
Killifish are small oviparous (egg-laying) fish that belong to the order of Cyprinodontiformes. Altogether, there are about 1270 different species of killifish, divided in 7 families according to fishbase, including Aplocheilidae, Cyprinodontidae, Fundulidae, Nothobranchiidae, Profundulidae, Rivulidae and Valenciidae [1].
Killifishes are mainly distributed in three regions of the world: South America, middle-west Africa (west of Dahomey gap) and middle-east Africa (east of Dahomey gap) and families that live in the same geographical area belong to a mophyletic group [2].
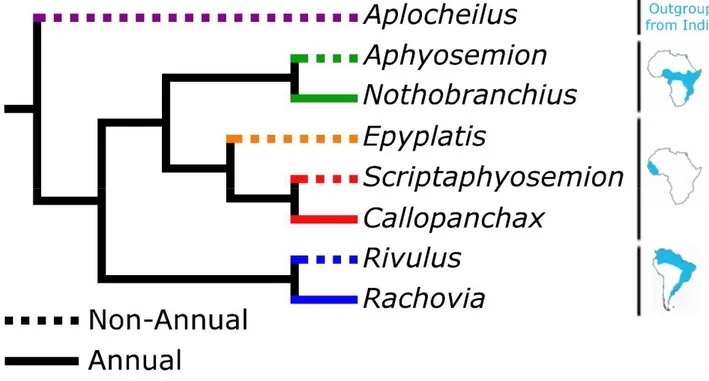
Killifishes usually colonize environments like permanent streams, rivers and lakes, but some species adapted to survive in extreme enviroments like ephemeral pond of water. These species are called annual while the species that lives in permanent water environments are called non annual [3] Early studies suggest the existence of four events of loss and re-gain of an ancestral annual trait [2], [4], [5] while more recent studies suggests that it repeatedly evolved, at least three times in Africa and three times in South America [6]. In either of the two scenarios, an annual clade has always a sister non-annual clade that is phylogenetically closer than any other annual clade (Figure 1.1).
7
Figure 1.1: Distribution of annualism onto the proposed molecular phylogeny. Left, the cladogram belongs to Murphy and Collier molecular analysis [2] based on cytochrome b, 12 s rRNA and 16 s rRNA genes. Black branches represent annual lineages, while white branches indicate non-annual lineages. Right, the tree has been done by Furness et al. using supermatrix tree construction methods on seven mitochondrial and two nuclear genes from GenBank [6]. Species highlighted in red have embryos capable of undergoing diapause II, while those in black do not.
1.1.2 Annualism
Annual killifishes inhabit ephemeral bodies of water that fill during the monsoon season and disappear by evaporation after its end. Annual killifishes are present in Africa and South America and are adapted to alternating wet and dry seasons [2], [7]–[11] (Figure 1.2).
8
Figure 1.2: Annual killifishes life cycle. Fertilized eggs are layed in the mud during the rainy season. Their development arrests in Diapause I II or III in response to negative environmental condition due to the dry season, not hatching and preserving the species. As rainy season starts again embryos complete their development and hatch. The figure has been modified from aqualog.de.
For surviving in such an extreme environment, annual killifishes (regardless of the species) evolved some peculiar and distinctive traits, that mainly concern embryonic development, grow rates and lifespan.
Growth rates of annual killifishes are extraordinary high [8], not only for cyprinodontiformes but for vertebrates in general. The largest body of studies on this aspect has been conducted in the african annual killifish Nothobranchius furzeri, that shows exceptional growing rates after hatching, reaching its maximum size in less than 10 weeks[9]. Annual killifish evolved this very fast growth rate in order to reach sexual maturity and reproduce before their environment dryes out, becoming fertile in less than three weeks [8].
With each breeding event, annual fish can lay in the mud up to hundreds of eggs every day [8]. All adult fish die when their habitat dries out and survival of the population is ensured by desiccation-resistant eggs that enter into diapause and remain encased in the dry mud until the next rainy season [2], [7]–[12].
Diapause is a common feature of insect species from temperate climates and seasonal life cycle and fresh-water crustaceans from ephemeral habitats such as Artemia [13]–[15]. In vertebrates evolved in annual killifishes species and in over 130 species of mammals, including mouse, mustelid carnivores and some species of marsupialis, that are three of the most studied mammals models [16]. It consists in a suspension of development at precise developmental stages and its trigger can greatly vary among the species. In insects is mainly triggered in response to onset of direct hostile enviromental conditions or changes of the photoperiod predicting the proximity of the winter season [13]. In mammals it instead happens as an obligatory developmental stage or in response to
maternal signals like hormonal changes, that indicates adverse environmental conditions outside the uterus [16].
1.1.3 Embryogenesis and development
Killifishes embryos developmental stages are broadly similar to any other teleost fish embryo. Embryos proceed through the phases of early meroblastic discoidal cells cleavages (segmentation), late cell cleavages, epiboly, dispersed phase, diapause I (optional), reaggregation, axis formation, somitogenesis, diapause II (optional), organogenesis and diapause III (optional). Among these
9 phases only dispersed phase, reaggregation and diapauses are peculiar of some of killifishes species (mainly, but not only, annual species), while all the other steps are common to all teleost fishes [3], [17], [18].
In the killifish Fundulus heteroclitus [19], it is well described that during the cleavage phase cell divisions are synchronized so that 2, 4, 8, 16 and 32 cells arise in succession. This pattern is broadly conserved in teleost species, and cell cycle during cleavage is extremely fast (in the order of 15 to 30 minutes) in typical model teleosts such as Danio rerio [20], Oryzia latipes [21], Gasterosteus aculeatus [22] and also Xenopus laevis [23]. During cleavage, there is no transcription of the embryonic genome but only translation of maternal transcripts and the cell cycle lacks the G1 and G2 phases, thus proceeding directly from S- to M-phase [24], [25].
Not so much is known about the activation of zygotic transcription. Recent studies revealed that in medaka and also in zebrafish the first signs of transcription from the zygotic genome are observed around the sixth division [26], [27] and are defined as pre-MBT transcription. This is considerably earlier than the tenth division, as originally reported for D. rerio in correspondence to the mid blastula transition [20], and is in line with recent results obtained in O. latipes, where the
desynchronization is observed between the fifth and the sixth division [26]. It is therefore possible that in annual fish as well, the activation of the very first zygotic genes corresponds to the first signs of asynchrony.
Epiboly in Fundulus heteroclitus [19] is very similar or identical to Danio rerio [20], Oryzia latipes [21], Gasterosteus aculeatus [22], and cells generated at the animal pole migrate over the yolk surface until the complete envelopment.
As it happens for zebrafish, two layers of cells migrate during epiboly: the yolk syncytial layer and the blastomeres layer [17], [28]. The YSL is a transient extra-embryonic syncytial tissue that forms during early cleavage stages and persists until larval stages. During gastrulation, the YSL undergoes highly dynamic movements, which are tightly coordinated with the movements of the overlying blastomeres cells layer, and has critical functions in cell fate specification and morphogenesis of the early germ layers [28], the blastomeres cells instead are the cells that will form the embryos
primordial axis [17].
Due to the dispersed phase that happens after the end of epiboly, axis formation in killifishes occurs at a different time compared to other teleost species like medaka or zebrafish. These two species in fact start to form the axis already before the epiboly is completed [20], [21] while killifishes first
10 completely envelop the yolk with cells, then disperse the blastomeres, and finally reaggregate them to form the primordial axis [17], [19].
The morphogenetic events that occur during somitogenesis and organogenesis in killifish are broadly similar to those shaping embryos of other teleost fish, with the obvious exception of
diapause II arrest phase, that was never described in other fish like medaka or zebrafish. The somite formation dynamics are characterized by a progressive increase in the somites number together with the formation of the precursors of some of the main organs of an embryo, like eyes, heart, brain and liver [12], [29].
During somitogenesis two different developmental pathways have been described for annual
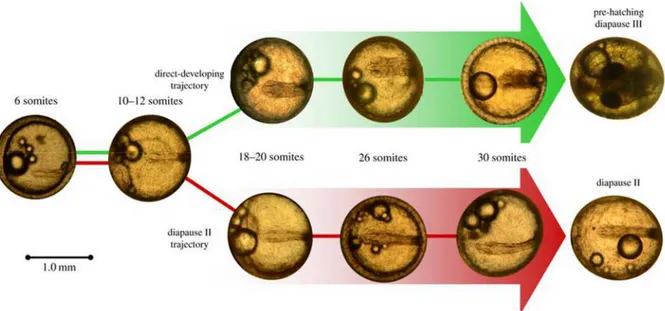
killifishes, in relation to their commitment to go or not in diapause II [30], [31]. The commitment to enter diapause II is made during the previous developmental stages (already at the 24 somites stage or even earlier) and is irreversible [31]. This decision will lead embryos that will stop or not on diapause II to follow two different developmental ways, assuming a different morphology during somitogenesis. Embryos that will enter diapause II develop evolving their primordial axis mainly increasing its lenght and not growing radially. As a result, once arrested in diapause II, at the stage of 30-36 somites, these embryos present with a long and thin axis and head. Embryos that will not enter diapause II instead homogeneously develop growing both over the antero-posterior and the radial axis during somitogenesis, resulting broad at 30-36 somites (Figure 1.3). At this stage these embryos have indeed an axis and a head that are considerably wider compared to embryos entered in diapause II. In addition the head and some of its structures like the eyes primordia are way bigger and more defined than in diapausing embryos. These dynamics were demonstrated for
Austrofundulus limnaeus [31] and for Nothobranchius furzeri [30], a south american and african annual species, respectively, and are thought to be a common feature among annual killifishes species. Due to this, diapause II has recently been defined as an alternative developmental pathway more than as a developmental stage itself, which affect a large part of embryos morphogenesis, shaping in a different way embryonal axis during almost all the somitogenesis.
11
Figure 1.3: Nothobranchius furzeri differential developmental pathways. Nothobranchius furzeri and annual killifishes in general develop in a different way accordingly to their decision to stop or not in diapause 2. Diapause 2 is entered around the 30-somite stage, yet morphological divergence in the head region is readily apparent well before this stage is reached. Figure design modified from original [30].
1.1.4 Diapause
The early development of annual fish is conserved in the different annual genera Callopanchax, Nematolebias, Rachovia, Nothobranchius, Austrofundulus, Cynolebias [3], [17], [30], [32] and is characterized by three possible points of developmental arrest, termed diapause I, II and III [3]. Diapause I occurs early in development, after epiboly ends and before the somite embryo has formed, during a dispersed cell phase, which is unique to annual killifish [3]. Although embryos have been induced to enter this state through low temperatures or hypoxia [3], [18], [33], embryos reared under standard laboratory conditions rarely undergo diapause I [30]. Diapause II occurs after the formation of the embryonic axis, in embryos possessing from 30 to 36 pairs of somites, and several organ systems are recognizable [3], [18]. Lastly, diapause III occurs when the embryo is fully developed and precedes hatching.
The major point of developmental arrest occurs during diapause II (DII). DII is a facultative stage: it can be skipped when embryos are incubated at high temperature [8], [30], [31], [34], [35],but lower temperature, darkness, dehydration or anoxia (all conditions occurring in natural habitats) induce DII [10], [33], [36]. The duration of DII is highly variable and the embryos can remain in this stage for several months [11], [34] or even years (A. Cellerino, unpublished).
As a result of arrest at one or more of these three stages, embryos can extend greatly their developmental time, allowing them to overcome the dry season, when adult fish have perished.
12
Embryos, even of the same clutch, routinely follow different developmental trajectories arresting or not in diapause I, II, or III [17], [31]that makes their individual developmental time very different and unpredictable. This is supposed to represent a bet hedging strategy, to cope with the fact that environmental conditions are only partially predictable. The rain season can vary in its timing and amount of pluvial input, up to the point that in some particularly dry seasons the habitats may not be filled for sufficient amount of time to sustain killifish reproduction while in other seasons they may fill multiple times. Such a bet hatching strategy is well known for seed banks in the soil [37], [38]. Multiple phases of developmental arrest, that can last a variable amount of time, generate therefore diversity in the developmental stage of embryos, so that embryos of the same clutch can be shifted in any phase of the development. Among the whole pool of embryos a subgroup will be always ready to hatch in response to any sudden environmental change, giving the species an extremely high chance to survive in its extreme environment [38].
The physiological and molecular mechanisms of diapause were studied in detail in the South-American species, Austrofundulus limnaeus. Diapause II is characterized by drastic depression of protein synthesis, oxygen consumption and of mitochondrial respiration associated with G1 arrest of the cell-cycle [11], [39]–[41]. These basic mechanisms seem to be conserved in also in African annual genus Nothobranchius [6], [30], [38], [42].
Diapause in annual killifish is also associated with major metabolic remodeling, where several pathways involved in energy production are modulated in order to minimize the embryo's aerobic metabolism and production of reactive oxygen species allowing quiescence. During diapause, oxygen consumption is suppressed and the cell cycle arrested [11], [41]. In some habitats of annual killifish the duration of the temporary pools is only a few months [43], and therefore the animals spend the largest fraction of their life in diapause.
Studies in the tapeworm Caenorabditis elegans have drawn a connection between diapause and aging. C. elegans can enter a stage of dormancy called dauer when the environmental conditions are unfavorable. Some genetic mutations that influence dauer formation also modulate longevity. In particular, the daf-2 mutation that affects an ortholog of the IGF/insulin receptor, increases lifespan over two-fold. Strikingly, the influence of the IGF/insulin pathway on longevity is conserved also in vertebrates and humans [44], [45]. In addition, the gene expression profile in the dauer larvae stage show high similarities to the expression profile of long-lived adult mutants [46]. Also small non-coding RNAs are embedded in the genetic network that links diapause and longevity, as exemplified by miR-71. This microRNA is a longevity gene and an aging biomarker in C. elegans and is also essential for diapause [47]–[50].
13
1.1.5 Nothobranchius furzeri
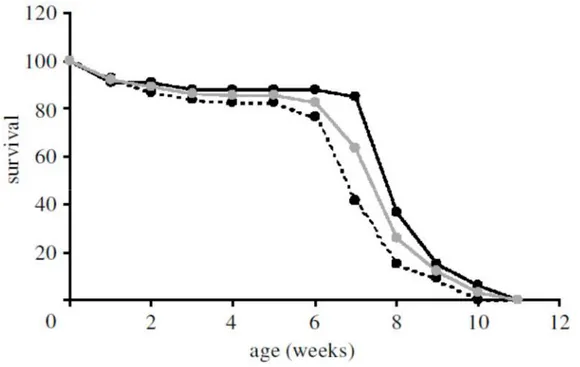
One of the most studied annual killifishes is the african species Nothobranchius furzeri. This species of killifish, as many african annual killifishes, is small (typically <8 cm), with marked sexual dimorphism and dichromatism. Due to its reduced dimensions, large tollerance of water parameter and ease of alimentation with commercially-available foods, captive care of this species is relatively easy and convenient (though time-consuming), and studies requiring a large number of individuals (in the order of hundreds) have been performed in several laboratories [9], [51], [52] Nothobranchius fish have a short maximum natural lifespan (<12 months) due to annual desiccation of the pools they inhabit. Notably, this short lifespan is also retained in captivity, varying between 3 and 18 months [52]–[54] and depends on the humidity of habitat of origin, suggesting that duration of the pools in the wild drives evolution of aging in natural populations [43] (Figure 1.4).
Figure 1.4: Survival trajectory of Nothobranchius furzeri in the laboratory. Survival is expressed as a percentage of maximum survival. The 25°C curve (dashed line) plots the survival rate of 68 fishes kept at a constant temperature of 25°C. The ‘Var’ curve (black line) plots the survival rate of 33 fishes kept at room temperature during the months June–August in Canossa, Italy. Tot (grey line) is the average of the two curve [52].
Nothobranchius extremely short lifespan and aging phenotype has made this taxon a laboratory model for in research for the study of age related diseases and age mechanics. Over the years, many
14 aspects of their aging phenotype were charachterized [53], [54], such as behavioural impairmentes [55]–[57], histopathological lesions [58] and disruption of the circadian rhythms [54]. In addition, telomere erosion [59]–[61], reduced mitochondrial numbers and function [62], accumulation of lipofuscin [56], [61], [63], [64], increased apoptosis [58], [63] and dramatic reduction of stem cell activity [65] were described in aged fishes. Finally, genome-wide analysis of transcript regulation revealed similarities in gene expression during aging between N. furzeri and humans both at the level of microRNAs and protein-coding transcripts [66], [67]. The Nothobranchius life cycle is entirely adapted to the ephemeral and unpredictable conditions of their habitat. As the other annual killifishes described above, fish hatch when the pool is filled with water, grow rapidly and become sexually mature within a few weeks [8], [37]. After reaching sexual maturity, they reproduce daily, also in laboratory conditions [8], [68], that means that every day a lot of eggs are available for observation or manipulation. Nowadays embryos can be routinely genetically manipulated in order to generate transgenic lines with a gene insertion [35] or deletion [69].
Diapause and early development in N. furzeri have been characterized over years, with studies that investigated specifically cleavage and early cell movements in Nothobranchius as well as the effects of some environmental variables on diapause [42], [70]–[72].
Nothobranchius furzeri developmental stages and diapause dynamics reflect entirely the stages and the dynamics described above for Austrofundulus [12] or any other annual killifish.
15
1.2 Transgenesis
1.2.1 Basis of trasgenesis
Transgenesis is used in a wide variety of research applications ranging from the study of gene expression to the creation of animal models of human diseases. Transgenic tools enabled in vivo labeling and detailed observation of specific cell types using fluorescent reporters and thereby complement mutagenesis by facilitating targeted genetic screens [73], [74].
In fish, many of the transgenesis techniques were developed in zebrafish, due to its high fecundity, ease of egg manipulation, developmental speed and the transparency of the zebrafish embryos [20]. Transgenic zebrafish were first generated by microinjection of naked DNA [75]. In this technique, a plasmid DNA is linearized with a restriction enzyme, purified, and then microinjected into the cytoplasm of one-cell stage embryos. On average, a small percentage of the injected fish (< 10%) transmit the transgene to the next generation. These transgenes tend to form tandem arrays or concatamers at the integration site, which in some cases may lead to variegated expression or silencing in the subsequent generation. Thus, while numerous transgenic fish have been generated with this technique [76]–[78], the germline transmission frequency and the reliability of transgene expression have been low. Pseudotyped retroviral vectors have also been successfully used for transgenesis in zebrafish, particularly for genome-wide insertional mutagenesis [79], [80] and enhancer trapping [81]. However, the retroviral vectors can only carry inserts of small sizes and their application in the laboratory is labor intensive.
To further improve the rate and ease of transgenesis in zebrafish and to create vectors that are useful for genetic analyses in this model vertebrate, were optimized transposable elements [82]–[85]. Among them, the Tol2 transposable element from the medaka fish appears to have the highest rate of genomic integration in the germ lineage and is now widely used as a genetic tool (reviewed in [86], [87]).
Tol2 is an active DNA transposable element capable of catalyzing transposition upon recognition of a target sequence. The Tol2 transposition system used for transgenesis consists of two elements: an RNA encoding the Tol2 transposase and a plasmid containing a nonautonomous Tol2 transposon (i.e. not encoding the transposase) surrounding the gene of interest [87]–[89]. The transposase recognizes the target Tol2 sequence in the plasmid, excises the gene of interest, and integrates it into the host’s genome [88], [90], thus allowing efficient and stable transgenesis.
16 In addition, a vector containing the minimal DNA sequences required for Tol2 transposition has been described, making preparation of new transgene constructs relatively easy [91], [92]. Many Tol2 vectors have been reported to date, including vectors that facilitate the rapid
construction of promoter- or protein-GFP fusions through the Gateway technology [93]–[95]. These vectors can be used for expression of any foreign genes in embryos by transient and stable
transgenic approaches. Furthermore, Tol2 gene and enhancer trap vectors have been developed for gene expression studies and mutagenesis [96]–[98]. Tol2 -mediated transgenesis is a highly efficient method to create stable transgenic fish since 50–70% of injected fish transmit genomic insertions of the injected Tol2 construct to the next generation [92], [96]. Insertion, however, remains mosaic. Tol2 transposon was also developed as a system to efficiently generate transgenic animals in other fish model systems, including stickleback and cichlids [99] or commercially relevant fishes species such as salmon, trout, and tilapia [100], [101]
1.2.2 Transgenesis in Nothobranchius
In the year 2011, Valenzano et al. Tested the efficiency of the Tol2 system in N. furzeri and
reported a good efficiency of transgene insertion in the germline [35] (Figure 1.5). Early embryonic development is much slower in N. furzeri as compared to zebrafish, with cell cycle speeds in the order of almost two hours as opposed to 15 minutes (see Results). This may facilitate early integration of the transgene and germline transmission. The slow embryonic development of N. furzeri might increase the chances of early embryo integration and, therefore, robust germline transmission as compared with other model systems. Indeed, the frequency of GFP-positive F1 offspring from a cross between GFP-positive P0 parents and wild-type fish was reported to be about 30% in N. furzeri [35]. These results were replicated by Hartmann & Englert and Allard et al. [102]
17 Figure 1.5:Nothobranchius furzeri transgenic fish. Expression of GFP in pCska-gfp Tol2 transgenic N. furzeri. GFP expression in live noninjected (top row), injected P0fish (second row), and the F1 (third row),and F2 (bottom row) progeny of GFP positive N. furzeri. [35]
18
1.3
Cell cycle
1.3.1 General mechanics
Cell cycle is an ubiquitous, complex process involved in the growth and proliferation of cells, organismal development, regulation of DNA damage repair, tissue hyperplasia and response to injury and diseases such as cancer. The cell cycle involves numerous regulatory proteins that direct the cell through a specific sequence of events culminating in mitosis and the production of two daughter cells. Central to this process are the cyclin-dependent kinases (cdks) and the cyclin proteins that regulate the cell’s progression through the stage of the cell cycle referred to as G1, S, G2 and m phases [103].
The cell cycle can be morphologically subdivided into interphase and stages of M (mitotic) phase, which include prophase, metaphase, anaphase, and telophase [104]. Interphases encompasses G1, S, and G2 [103]. The G1 and G2 phases of the cycle represented the “gaps” in the cell cycle that occur between the two obvious landmarks, DNA synthesis and mitosis. In the first gap, G1 phase, the cell is preparing for DNA synthesis. S phase cells are synthetizing DNA and therefore have aneuploid DNA content between 2N and 4N. The G2 phase is the second gap in the cell cycle during which the cell prepares for mitosis or M phase. G0 cells are not actively cycling [103].
The timely execution of each stage of the cell cycle is intimately linked to key developmental processes such as differentiation and organogenesis. On the other hand, failure to precisely regulate cell-cycle progression leads to various diseases such as cancer [105], [106]. To ensure that events such as S phase and mitosis proceed both in an orderly fashion and with high fidelity, cells have developed a series of checkpoints that act as quality control centers at each stage of the cell cycle. These checkpoints, which govern the transitions between G1/S and G2/M, are designed to monitor cellular parameters such as genomic integrity and cell size throughout the division cycle [107], [108].
If a cell fails to meet minimal requirements at any point during the process, regulatory factors prevent the onset of the next phase until the task at hand has been completed [107]. For many years, it has been difficult to precisely track cell-cycle progression in a live, multicellular context. This is because most of the techniques currently used to monitor the cell cycle—such as BrdU
incorporation or immunostaining of cell-cycle markers—require cell fixation prior to analysis. As a consequence, these methods do not permit the dynamic behaviors of cycling cells to be visualized in real time.
19
1.3.2 FUCCI
In the 2008 Sakaue-Sawano and colleagues designed a fluorescent reporter to track cell-cycle progression with high spatiotemporal resolution in a multicellular contex [109] that provided a molecular tool to easily distinguishing between cells engaged in different stages of the cell cycle with minimal perturbation to the system under study, allowing the dynamic behavior of cycling cells to be monitored in real-time.
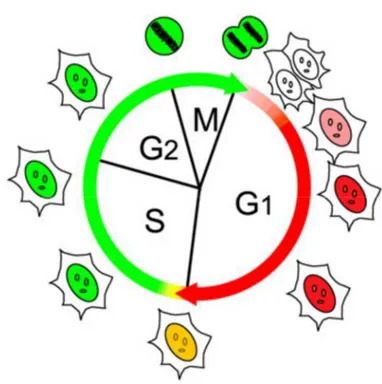
Figure 1.6: Cell cycle visialization with FUCCI reporters. Cells that brings FUCCI reporters emit green fluorescence during S G2 and M phases, red fluorescence during G1 and G0 phases and are colorless at the interface between M and G1/G0 phase. This method, termed fluorescent ubiquitination-based cycle indicator (FUCCI), exploits cell-cycle-dependent proteolysis of the ubiquitination oscillators, Cdt1 and Geminin, to specifically mark the G1/S transition in living cells [109], [110].
By fusing the red- and green-emitting fluorescent proteins monomeric Kuzabira Orange 2 (mKO2) and monomeric Azami Green (mAG) to the sequences of Cdt1 and Geminin respectively that carry the ubiquitination sites, is possible to achieve striking contrast between various stages of the division cycle (Figure 1.6). Specifically, the nuclei of cells in G1 phase (and G0) appear red, because the mAG-Gemin fusion protein is preferentially degraded, while those of cells in S/G2/M appear green because the mKO2-Cdt1 fusion protein is preferentially degraded. During the
20 transition from G1 to S phase, cell nuclei turn yellow, clearly marking cells that have initiated DNA replication [109], [110].
The dramatic color changes exhibited by Fucci are based upon the reciprocal activities of the ubiquitin E3 ligase complexes APCCdh1 and SCFSkp2 [111].
The APCCdh1 and SCFSkp2 complexes are E3 ligase activities that mark a variety of proteins with Ub in a cell cycle-dependent manner [111]. Because the SCFSkp2 complex is a direct substrate of the APCCdh1 complex but also functions as a feedback inhibitor of APCCdh1 [112], [113], these two ligase activities oscillate reciprocally during the cell cycle. The APCCdh1 complex is active in the late M and G1 phases, while the SCFSkp2 complex is active in the S and G2 phases. Two direct substrates of the APCCdh1 and SCFSkp2 complexes, Geminin and Cdt1, are involved in ‘‘licensing’’ of replication origins [114]. This carefully regulated process ensures that replication occurs only once in a cell cycle. In higher eukaryotes, proteolysis and Geminin-mediated inhibition of the licensing factor Cdt1 are essential for preventing re-replication.
Consequently, the APCCdh1 and SCFSkp2 substrates Geminin and Cdt1 are specifically degraded during G1 and S/G2/M, respectively [115].
Even if these proteins function as effective G1 and S/G2/M markers, geminin, but not Cdt1, is interchangeable between mammals and fish in terms of ubiquitin-mediated degradation [116]. In the 2009 Sugiyama et al. generated DNA constructs using the zebrafish homologs of Cdt1 (zCdt1) and geminin (zGem), characterized them using cultured fish cells, constructed transgenic zebrafish lines and observed the correct dynamic patterns of cell-cycle progression in several parts of the embryo, including the retina and notochord [116] (Figure 1.7).
21 Figure 1.7: Time-lapse imaging of a FUCCI transgenic zebrafish embryo during segmentation. Green and red cells populate specific embryonic regions during development. First steps of segmentation are characterized by a predominance of green cells, and red cells increase in number, populating the somites, as development proceeds. Due to z-stacking, green and orange signals at different z-positions merge to generate yellow signal. Note that zebrafish FUCCI reporters does not yield yellow fluorescence at the G1/S transition, whereas the original FUCCI in mammalian cells does [116].
Summarizing, FUCCI technology offers a powerful in-vivo tool for studying the cell cycle in mammals and fishes, because cell nuclei color changes in a fast and reliable way as cell cycle proceeds.
This technique is particularly powerful when used in combination with traditional confocal laser scanner microscopy [117] or new generation microscopy, such as selective plane illumination microscopy [118] and digital scanned laser light sheet fluorescence microscopy [119], that have been developed for high-speed in vivo observation of embryonic development at subcellular resolution.
22
Aims
Annual killifishes are some of the most stiking fishes living on our planet, because of their
adaptation to extreme environments, that led to the evolution of extreme growth rates ,extraordinary fast aging, peculiar embryonic development and the evolution of diapause.
Unfortunately, our knowledge of annual killifish biology is very limited and many observations were made by amateurs that raise these fishes as an hobby rather than by professional scientists. For this reason, even basic aspects of embryonic development and diapause mechanics are unknown. The objective of my thesis was to shed some light on the processes that characterize the cell cycle of annual and non annual killifishes during embryonic development and in the diapause phase both from a macroscopic and molecular point of view.
I therefore set three main aims:
1) To describe the development of non annual kilifishes embryos (that lacks from the literature entirely) and compare it with the known development of annual killifishes [3], [17], [18], evidencing any possible difference in morphogentic processes.
2) To test the applicability of FUCCI technology [116] to killifish species to describe cellular dynamics during early development and diapause phases, in order to define the cell cycle profile for embryos arrested in diapause, committed to enter in diapause, committed to escape diapause and releasing from diapause.
3) To identify some of the molecular factors involved in the diapause control, in particular microRNAs.
23
2.
Results
2.1 Developmental differences
The first set of experiments aimed at describing the early developmental dynamics of a taxonomically representative collection of killifishes species covering all continents where killifishes are distributed:. South America, west Africa and east Africa (Figure 2.1)
Eggs or adults of 12 killifishes species were obtained and raised under laboratory conditions. At least one annual and one non-annual species were chosen for each of the three geographical clades. From South America, we chose the annual species Rachovia brevis and the related non-annual species Rivulus cylindraceus. From Africa, west of Dahomey gap, the annual species Callopanchax occidentalis and the non-annual species Scriptaphyosemion guignardi and Epiplatys dageti
monroviae. From Africa, east of Dahomey gap, the annual species Nothobranchius furzeri, N. guentheri, N. korthausae and N. melanospilus and the non-annual species Aphyosemion australe and A. striatum.
As outgroup, we chose the closest outgroup taxon to all annual killifishes Aplocheilus lineatus, as based on the phylogeny reported by Murphy and Collier [2]. However, more recently two studies of molecular phylogeny indicate that Aplocheilus is sister taxon to the African killifishes [30]. These studies were published after my work was completed. According to these views, an outgroup for all killifishes would be Fundulus, for which a detailed description of embryonic development is
24
Figure 2.1: Phylogram of the species used for the experiments. Dashed lines indicate non-annual species, solid lines annual species and color codes for the three evolutionary lineages. The geographic distribution of each lineage is show on the right. The phylogram is derived from the original Murphy and Collier molecular phylogram [2] based on cytochrome b, 12 s rRNA and 16 s rRNA genes.
To document embryonic development, we used live imaging and fertilized embryos were imaged for hours up to days, every few minutes (2 to 5 minutes, depending on the species), with a
brightfield microscope. For most of the species analyzed, it was possible to image the development up to some days after the end of epiboly and in some cases also the formation of the embryonic axis and the process of somitogenesis (Figure 2.2).
25
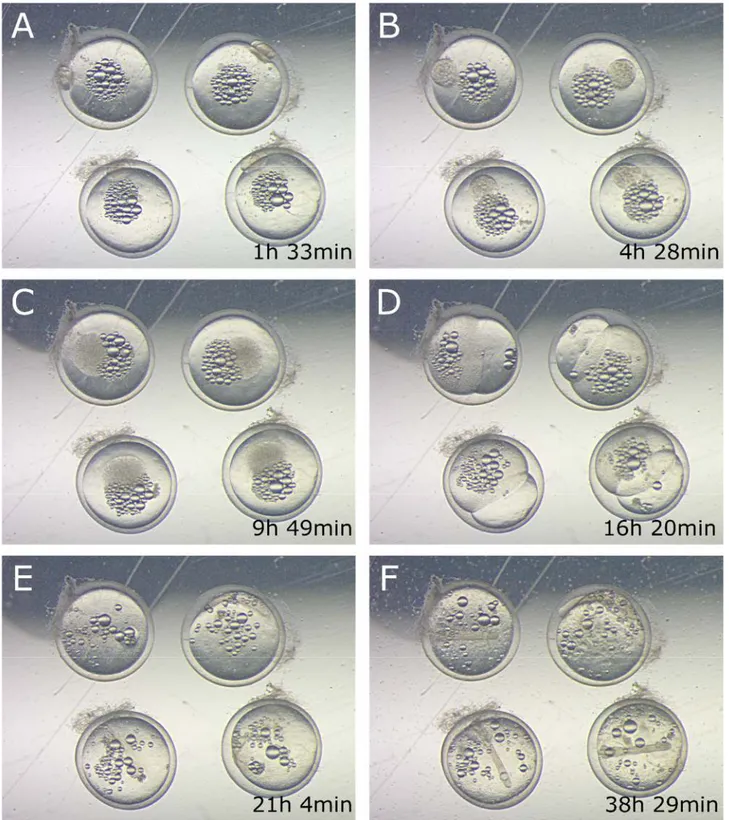
Figure 2.2: Killifish embryo time lapse example. Figures show Aplocheilus lineatus embryos raw acquisitions, in some of the critical developmental steps: segmentation (A), asynchronous cell divisions (B,C) epiboly (D), axis formation (E) axis grow (F). Time at which each stage occurs is shown.
26
2.1.1 Non-annual killifishes development description
Non-annual killifishes have an early development that is very similar to the one described for other fish model organism, like Fundulus [19], zebrafish [20] or medaka [21].
For the first hours, the cells divide synchonously, rapidly and at regular time intervals of less than 30 minutes (Figure 2.3).
After this phase of synchronous divisions (that on average spans the first 6 cleavages),
asynchronous division starts and each cell or cells group divides independently, with a pace that depends on its position within the embryo.
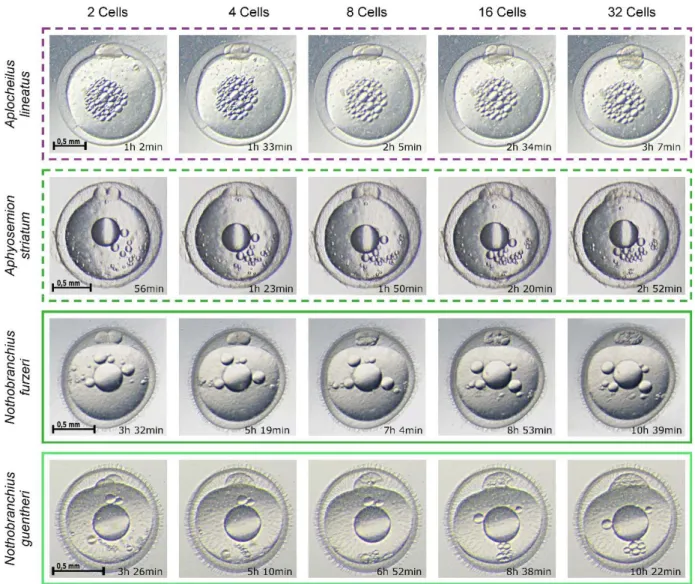
Figure 2.3: Early cleavage time-lapse. Non-annual species (dashed boxes) are compared with annual species (solid boxes) by brightfield time lapse imaging. Early cleavage stages are shown for each species and the average time at which they occur is indicated. There is a large difference in early cell division rates between annual and non-annual species.
27 When a critical number of cells is reached (this number cannot be assessed by simple brightfield microscopy due to overlaid cell masses) the epiboly starts and cells begin to migrate over the yolk surface toward the opposite part of the embryo (Figure 2.4 D).
Two layers of migrating cells can be recognized. The first layer that migrate is a thin and almost transparent layer of cells and is composed by the yolk syncytial layer (YSL) cells, that contact directly the yolk surface (Figure 2.4 D,E).
The other layer of cells is composed by the epiblast cells, that migrate in the same direction of YSL cells, moving on top of them, and not contacting the yolk directly. These cells appear to be much smaller and their borders are well-defined compared to the YSL cells that form a syncitium. Once epiboly is completed, or in some species, even before this process ends, the embryonic axis starts to appear, as a thicker and oval aggregation of cells (Figure 2.4 H).
Some species, like Aplocheilus and Epiplatys, shows a pecocius formation of the primordial axis, that precedes the completion of epiboly, as it happens in other teleost fishes like zebrafish [20]. Other species, belonging to Aphyosemion or Scriptaphyosemion genera shows instead a delayed formation of the axis. These fishes after epiboly is completed have a phase similar to annual fishes dispersed phase (Figure 2.5), where epiblast cells migrates over the YSL for minutes or hours, without reaggregating to form the axis.
The embryonic axis extends over time, generating slowly the several embryo structures like the somites, the head, the eyes, the fins and all the other organs (Figure 2.4 I-M).
All these structures slowly evolve, growing and shaping in a continuous developmental process, forming finally a fry ready to hatch (Figure 2.4 N). All the developmental process, from the fertilized cell to the fry, regardless to the species of killifish, excluding diapauses arrests, usually takes an average time of 22 days at 26°C.
28
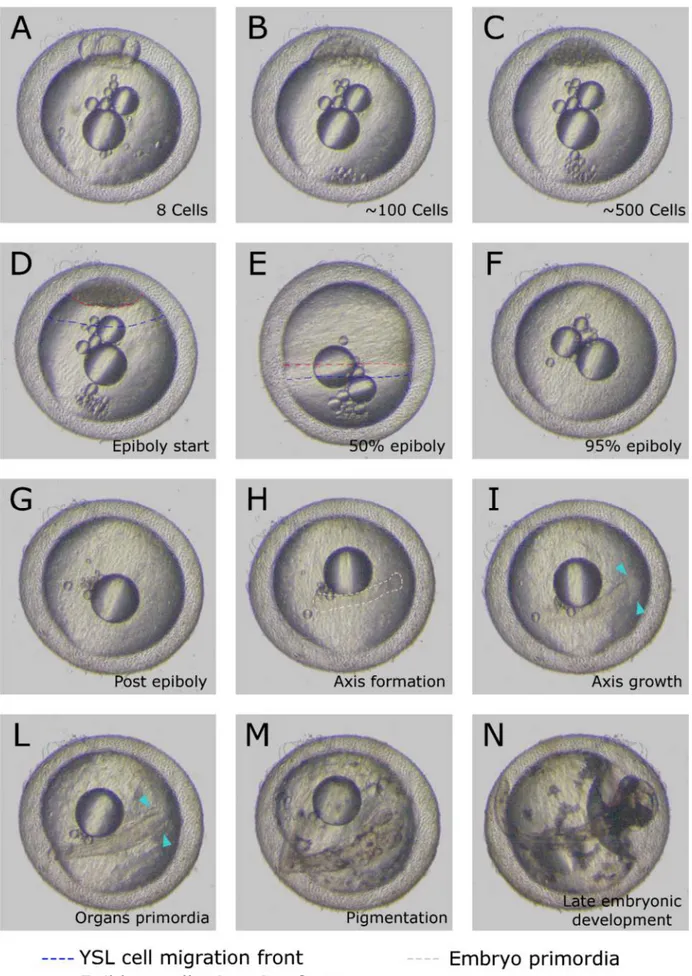
Figure 2.4: Killifish developmental table. Aphyosemion striatum (non annual) complete embryonic development. The developmental steps shown are common to annual and non annual killifishes.
29
2.1.2 Annual killifishes development description
Development of annual killifishes (Movie S1) shares various similarities with the development of non-annual species, but presents some major differences.
In the first place, as treated in the introduction, annual killifish can stop their development in diapause, but the arrest of the development itself is not the only peculiar feature since alternative developmental pathways are taken in embryos that enter or skip diapause.
Diapause I is a phase where an embryo can arrest after epiboly ends, when the YSL and the epiblast cells have already completely enveloped all the yolk surface (Figure 2.5). Annual embryos epiboly dynamics are slightly different from non-annual ones, because epiblast cells are smaller in number and are dispersed (Figure 2.5 B, arrows). In annual embryos, indeed, epiblast cells never contact closely each other, as it is the case in the majority of non annual species . The number of epiblast cells that migrate over the YSL greatly varies among the observed non annual species. Cell density is reduced in Scriptaphyosemion (Figure 2.5 A) and in Aphyosemion while is very high in Epiplatys and Rivulus, so much that is impossible to distinguish one cell from each other with brightfield microscopy. Non annual species that have a lower epiblast cells density during epiboly have as well an higher propension to not immediately form embryonic axis after epiboly and to spend some hours in a dispersed-phase like stage. Annual species always have spread and clearly detectable epiblast cells, as well as they always have a dispersed phase that lasts for several days (figure 2.5 B).
30
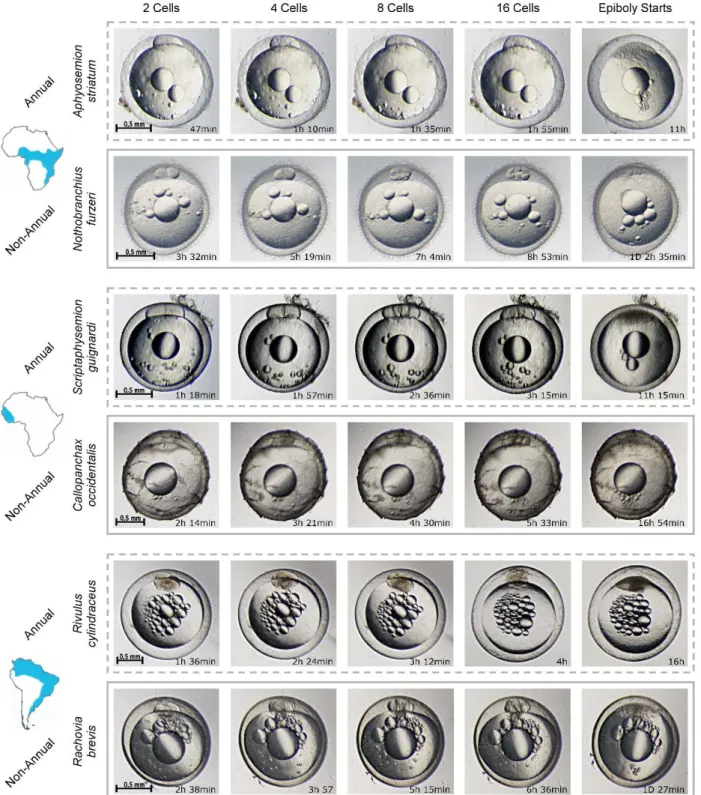
Figure 2.5: Differential development after epiboly in non annual and annual killifishes. A Scriptaphyosemion guignardi (non annual) and a Rachovia brevis (annual) embryos are compared during and after epiboly. Epiboly proceeds the same in both species, with YSL and epiblast cells enveloping the yolk. In S. guignardi epiblast cells’ density is higher (A) while in R. brevis they are more discrete and spread (B, arrows). Few hours after epiboly ends S. guignardi forms the embryonic axis, while R. brevis begins the dispersed phase or stops in the diapause 1 phase. The embryonic axis in R. brevis willstart to form much later.
Once epiboly is over, annual killifishes epiblast cells continue to randomly migrate over the yolk surface for an undefined amount of time (usually days) before reaggregating to form the embryonic axis. This phase has been described as the dispersed phase, is peculiar of annual species and is obligatory. During this phase, an arrest in diapause I can happen.
31 The main result obtained from brightfield time lapse analysis is a large-scale difference in
segmentation timings between annual and non-annual species (Figure 2.6).
Converting the image sequences into videos, it was possible to evaluate the pace of cell divisions for each species, in order to precisely quantify this difference (Movie S2).
Figure 2.6: Early cleavage time-lapse. Non-annual species (dashed boxes) are compared with annual species (solid boxes) by brightfield time-lapse imaging. Early cleavage stages are shown for each species and the time at which they occur is indicated. There is a large difference in early division rate between annual and non-annual species.
32 The length of the cell cycle varies dramatically between annual and non-annual species (Figure 2.7, Student’s t-test, P <0.001) and this difference is conserved in both the africans and the south
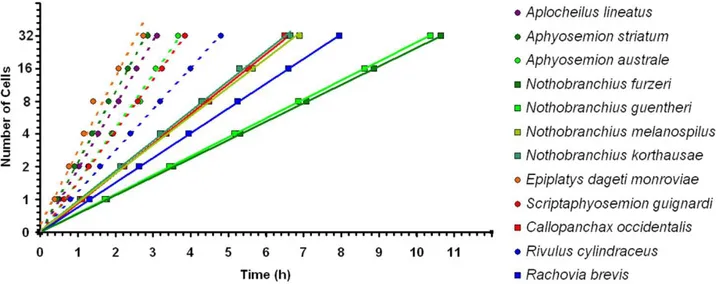
americans killifish species. As showed in figure 2.8, where the number of cells is reported as a function of time for each of the species of our taxonomical sampling, there is a clear separation between annual and non-annual killifish early segmentation rates. Regardless of the phylogenesis or the geographic orgin of a given species, if that species is annual, it has an early cleavage rate that is slower than any other non-annual species. Precisely, the five non-annual species analyzed show an average cleavage time of 34.8 minutes (range 23.0 to 48.0), that is comparable to the outgroup A. lineatus, while the six annual species analyzed show an average cleavage time of 75.6 minutes (range 66.0 to 100.0). If Fundulus and not Aplocheilus is considered as outgroup, according to Furness and Moritz phylogenesis, the result of the study remains unchanged. In fact Fundulus has a cleavage time of 28 minutes [19], that is comparable with non annual species cleavage time.
Figure 2.7: Difference between annual and non-annual division rate is conserved in Aplocheloidei. All species followed with time-lapses videos were plotted. Developmental stages are shown on the x-axis and time at which they occur on the y-axis. Dashed lines indicate non-annual species, solid lines annual species and color codes the geographic clade. For each species only one individual embryo is plotted.
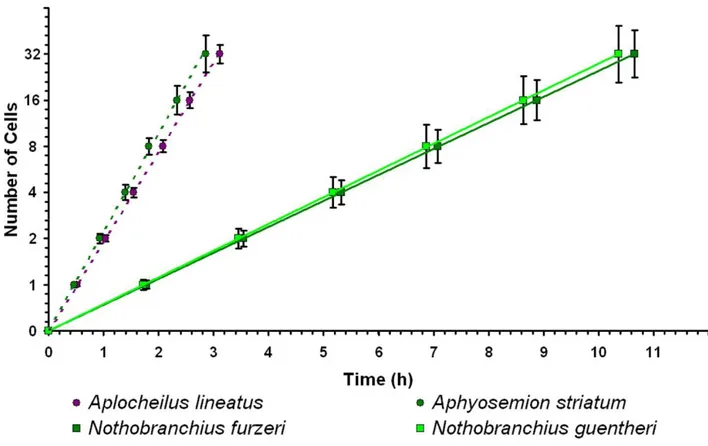
To confirm the data, replications of the time lapses were performed for the crucial species considered for the studies: Nothobranchius furzeri and N. guentheri, as annual killifishes, their closest non-annual relative Aphyosemion striatum, and the closest outgroup taxon to all annual killifishes Aplocheilus lineatus.
As before, a clear separation between annual and non-annual segmentation rates is observed, with a very low variation between the replicas (Figure 2.8).
33 The average cells doubling time is 106.5 minutes +/-2.2 for N. furzeri (annual), 103.6 minutes +/- 2.6 for N. guentheri (annual), 28.2 minutes +/- 1.5 for A. striatum (non-annual) and 31.1 +/- 0.8 for A. lineatus (non-annual).
Figure 2.8: Early division rates greatly differ between annual and non-annual species. Time-lapses videos were plotted, with developmental stages on the x-axis and time of occurrence on y-axis. Data are means of three independent experiments. Error bars represent standard deviations. Dashed lines indicates confidence intervals of the regressions. The slopes of the lines clearly show the great difference between annual and non-annual early division times.
2.2 Exploring cell dynamics during development
2.2.1 Segmentation
The differences in segmentation rates between annual and non-annual species led to the next question concerning the mechanisms responsible for this difference .
Non annual killifishes show division rates similar to those observed in the other teleost fishes were this phenomenon was investigated, with very fast early cleavages (under 40 minutes for each division), probably due to an alternation of only an M and a S phase [24], that can be considered as a basal trait. Therefore, I focused my investigations on annual species, whose segmentation
34 Nothobranchius furzeri, because it is the annual species most diffused in the scientific community, protocols for microinjections are available [35], [102] and it showed the slowest cell division rate in the segmentation phase. I assume that the basic mechanisms will be identical in the two other annual clades.
Cell cycle dynamics of Nothobranchius furzeri embryos were explored by FUCCI (see
Introduction). In this system, a red and a green fluorescent reporters are fused to protein motives that drive degradation in the G1 and the S phase respectively [109]. Therefore, a cell in the G1 phase would appear red and a cell in the S/G2/M phase green, while cells at the transition between M and G1, or M and S, would show no fluorescence. This experiment therefore will indicate whether slow cell cycle is due to slower S and M phases or rather to the presence of a G1 phase.
FUCCI reporter mRNAs optimized for zebrafish [116] were microinjected in N. furzeri fertilized one cell stage eggs and then the embryos fluorescence was analysed in time lapse using confocal microscopy (five independent experiments). From these experiments (Figure 2.9 and Movie S3), it is clear that the first five divisions (Wourms stages 4-8) are synchronous. The red and green fluorescent reporters rise in phase after cell division (Figure 2.9 A-F), become cytoplasmic (Figure 2.9 G) and are then degraded (Figure 2.9 H) shortly before cell division. Starting from the sixth division (Wourms stage 9) (Figure 2.9 K), cells with a prevalence of red fluorescence intermingled with cells with a prevalence of green fluorescence are detectable, demonstrating desynchronization of the cell cycle and the appearance of a G1 phase.
35
Figure 2.9: Cell cycle during early cleavage (Wourms stages 4-11). Cell cycle progression in Nothobranchius furzeri was visualized by fluorescent ubiquitination-based cell cycle indicator (FUCCI). From (A) to (H) the last synchronus division (fourth) is shown, all nuclei are yellow and cells perfectly synchronized in cycling. (I) Represents the first division where asynchrony starts. (J) last synchronous dark stage. (K-L) later stages when cells are clearly asynchronous and cells in different phases can be recognized at the same time point.
2.2.2 FUCCI transgenic fish.
Exogenous RNA has limited half-life and is stable just for 5-14 day once injected in a N. furzeri embryos. This stability greatly depends on the temperature of embryo incubation, which in turns influences developmental pace, and the time spent in the diapause I stage. In practical terms,
injecting a dose of exogenous RNA that does not cause toxicity in an embryo always lead to a RNA stability that in a major part does not last longer than the dispersed phase, resulting in a weak signal and leading to a difficult or not correct microscopic analysis . So, tracking cell cycle progression and cell movements after the dispersed phase for exploring cell cycle dynamics during diapause I, somitogenesis, diapause II and organogenesis, required the generation of a transgenic line with stable expression of FUCCI reporters.
36 Two different N. furzeri transgenic lines were created, integrating FUCCI constructs in the fish genome through the TOL2 transgenesis system [87].
The first transgenic line carried the FUCCI red construct (Kusabira orange - Cdt1) under the control of the zebrafish ubiquitin promoter (Figure 2.10 B)
The second transgenic line carried the FUCCI green construct (Azami green - Geminin) under the control of the zebrafish ubiquitin promoter (Figure 2.10 A)
Zebrafish ubiquitin promoter is a 3483 base pair promoter that drives ubiquitous expression of the downstream gene in zebrafish at all developmental stages. Its activity was tested in our lab in the Nothobranchius species and the expression pattern resulted the same as for zebrafish (Figure 2.10 D).
Figure 2.10: FUCCI transgenic lines generation. A and B are schematic representations of FUCCI green and red constructs, respectively. FUCCI constructs were injected separately in different 1 cell stage fertilized embryos. Positive embryos were raised into adult fish, bred and screened for 3 generations (C). F2 FUCCI green fish were finally bred with F2 FUCCI red fish to generate
37
double FUCCI embryos, that were used for the largest part of the experiments (C). D is a schematic representations of zUbiquitin-EGFP construct. zUbiquitin-EGFP expression in Nothobranchius embryos and adult fish is shown.
F0 transgenic fish were bred one to another for 2 generations (FUCCI red with FUCCI red and FUCCI green with FUCCI green, separately), in order to increase the number copies of FUCCI constructs in their genome, enhancing the signal. F2 transgenic fish were then used to characterize the FUCCI pattern (Figure 2.10 C).
2.2.3 FUCCI red F2 fish description.
FUCCI red was documented during the dispersed phase (Wourms stages 19-20), the somitogenesis (Wourms stage 31), in the newly hatched embryo (Wourms stage 44) and in adult fish.
FUCCI red fluorescence was nuclear. During the dispersed phase, two cell types express red fluorescence: large cells of the YSL and some other smaller cells of the epiblast (Figure 2.11). The nucleus of the YSL cells was 22-27 µm of diameter and these nuclei formed a regular array.The nuclear diameter of the epiblast cells was much smaller, in the order of 7-9 µm (Figure 2.11, arrows). The red fluorescence YSL appeared as a constant red signal that lasted for all the embryonic development, until hatch and over, while the red signal of the epiblast cells was transient, and lasted for a variable amount of hours before fading.
38
Figure 2.11: Dispersed phase FUCCI red embryo (Wourms stages 19-20). Big red nuclei belong to the YSL (yolk syncytial layer) cells while small red nuclei (arrows) belong to epiblast cells. YSL nuclei red fluorescence never fade or cycle, so YSL cells are probably blocked in G0 phase.
At the somitogenesis stage, the YSL pattern was unchanged and all the other red cells showed a clear patterned distribution that delinated specific regions of the embryo (Figure 2.12). In the older, more rostral, somites, the inner part of the somite showed a high concentration of red cells. In the more caudal part of the embryo, where somites were still forming, red cells were more spread and diffused. Once that the new somite pair was completely formed, they increased in numbers and retained the higher density in the inner part. These groups of somite red cells were reminiscent of the pattern previously described in zebrafish FUCCI transgenic line [116]. Just below the
nothochord midline there was another narrow streak of red cells that extended from the tip of the head region to the tip of the tail. Also in the head, several regions contained red cells, but in these regions they were quite rare, spread and did not delineate specific areas.
39
Figure 2.12: Mid somitogenesis FUCCI red embryo (Wourms stage 31). Red aggregates of cells belonging to somites are clearly distinguishable. Red cells also populate some undefined regions of the head and a narrow streak that goes from the base of the head to the tip of the tail between the somite pairs.
In the hatched fry, the concentration of red cells increased greatly (Figure 2.13). The lateral muscles of the trunk (d) and of the tail (e) presented a majority of red cells. In the head region, almost every part of the brain had some spread red cells or red cells aggregates (a). The lens (b) showed strong red fluorescence at this stage. This could be an artefact due to the high protein stability in this region that did not permit the correct degradation of the FUCCI reporter. What remained of the yolk, was still sorrounded by red large cells belonging to the YSL (f). As last, the pectoral fins (c) appeared to be greatly populated by red cells.
Figure 2.13: Hatched FUCCI red fry (Wourms stage 44). Discrete regions in the embryo’s body are populated by red cells at this stage: a) brain b) lens c)pectoral fins d-e) trunk dorsal and lateral muscles, f) YSL leftovers cells.
40 The adult FUCCI red trasgenic fish appeared completely red under the fluorescence since many cells were in a G1 or G0 phase at this stage (Figure 2.14).
Males and females showed a pattern that could be defined identical, and also the signal intensity was comparable between different specimens.
Figure 2.14. Adult FUCCI red fish. The majority of the cells present red at this stage, probably in G0 phase since many of them are fully differentiated. Fish look homogeneously red under the microscope and there are no striking differences between males and females specimens. The signal in the lens could be artificial, due to incorrect protein stability in this region..
2.2.4 FUCCI green F2 fish description.
FUCCI green fish showed two different kind of fluorescence patterns, one of which was unexpected. Some specimens showed the a concentration of green fluorescent cells in the mitotically-active regions of the embryo while some other specimens showed a ubiquitous
expression of green fluorescence at any developmental stage (Figure 2.15). This odd pattern was not further investigated and the embryos discared, but is probably the result of a partial integration of
41 the construct in the fish genome, or a mutation in the transgene sequence itself, that impairs the functionality of the geminin targeting sequence.
.
Figure 2.15. Unexpected FUCCI green embryos pattern. Examples of embryos showing the unexpected FUCCI green pattern. In these embryos the fluorescence is ubiquitous at any developmental stage.
The “correct” pattern of the FUCCI green F2 embryos can be described as follows:
During the dispersed phase, a variable proportion of green epiblast cells were detected (Figure 2.16). The nuclei of these cells were between 7 and 25 µm in diameter, with a higher proportion of the smaller cells. During this developmental stage, both in the case that many (Figure 2.16 B) or few (Figure 2.16 A) green cells were present, they seemed to be arranged randomly on the embryo surface. The phase of the cell cycle of these cells was for sure one among S/G2/M, but
42
Figure 2.16: Dispersed phase FUCCI green embryos (Wourms stages 19-20). At the dispersed phase FUCCI green embryos revealed two possible conditions of cells proliferation. A) represent the condition where only few green cells are present while B) the one where many of them can be detected. There is a simultaneous presence of big and small green nuclei at this stage, even if small nuclei are predominant.
During active somitogenesis (in developing embryos and not in diapausing ones) proliferating green cells were spotted in every part of the developing embryo. The signal was moderately strong both in the trunk, in the tail and in the head primordia (figure 2.17). The maximum intensity of the signal, that corresponded to the maximum density of proliferating cells, was limited to a narrow region along the midline of the embryo, that went from the end of the head to the end of the tail, and that was positioned between the yolk surface and the ventral part of the developing embryo. Among the
43 yolk surfaces, a large number of green cells, that reminded the dispersed phase stage, were still visible, even if was not clear if these cells were actually proliferating or blocked in the G2 phase and migrating on the yolk surface.
Figure 2.17: Mid somitogenesis FUCCI green embryo (Wourms stage 31). At this stage the whole growing axis is populated by green cells. The higher density of green cells lies in a narrow streak in the middle of the forming axis, starting from the base of the head and ending in the middle part of the embryonic axis.
In the hatched fry, the proliferative regions in the embryo were more defined (Figure 2.18). In the torso and the tail the proliferating green cells that could be detected were spread and
homogeneously distributed (f). Other spread green cells, even if with a slightly increased density, could be detected in the caudal and pectoral fins (d) and at the base of the head, in the hindbrain (e). The forebrain (a) showed a totally different pattern. The proliferating cells were not widespread but formed dense aggregates on the borders of the optic tectum that corresponded to the neuronal stem cell niches [65], while no proliferating cells could be seen in the inner part, that appeared
completely dark. The olfactory epithelium (b) at this stage seemed to be one of the major
proliferating regions, composed by dense streaks of proliferating cells. As last, the pupils (c) shone of green fluorescence at this stage, but, as discussed for the FUCCI red trasgenic line, this could be an artefact due to the high protein stability in the lens that did not permit the correct degradation of the FUCCI construct.
44
Figure 2.18: Hatched FUCCI green fry (Wourms stage 44). Discrete regions are populated by green cells at this stage: a) forebrain b) olfactory nerves c) lens d) fins e) hindbrain f) torso and tail muscles.
In adult FUCCI green specimens, no green cells could be detected under a stereomicroscope and the only green signal present at this stage was confined to the region of the eye (Figure 2.19).
Figure 2.19. Adult FUCCI green fish. The majority of the cells present colorless at this stage because prolifertion is greatly reduced at this stage, compared to embryonic stages. Green intense signal is retained in the lens but it could be an artefact due to increased protein stability in this region.
45 This negative pattern was expected, since only few cells proliferate in the adult fish and only the skin surface is visible. For this reason, is understandable that no green signal was detectable with a stereomicroscope.
Concerning the signal retained in the eye, as noticed for the previous stage of hatched fry, it was probably due to a different stability of the proteins in the lens, caused by the peculiar chaperones present there that protects crystallins from degradation. These chaperones probably lead to an uncommon high stability of FUCCI in this region, and so there is the chance that azami green-geminin protein formed in the lens primordia could not be degraded as soon as the cells exited from S/G2/M phases, accumulating over time.
2.2.5 Fin cut FUCCI green adult validation.
To check if the rest of the body, that appeared not green, was still able to express the green signal in response of proliferation events, a fin cut experiment was performed (Figure 2.20).
One male and one female belonging to the F2 generation of FUCCI green were isolated and half of their caudal fin was cutted away. Another FUCCI green F2 female was left uncutted, as control. After 24 hours and for the next 9 days the transgenic fish showed a huge amount of green cells near to the cutted region of the fin, as long as it was regrowing, indicating proliferation. So, FUCCI green marker was absolutely able to mark proliferating cells also in the adult.
In details the proliferation event showed a burst in all the region before the cutted site just after 48 hours from the cut. 72 hours after the cut was performed, the green cells clustered in a specific region just next to the cutted site, defining short and dense proliferation areas that spread single cells towards the distal part of the fin. These green proliferating regions extended as the fin grew, reducing gradually their density until the fin was totally regenerated.
46
Figure 2.20. FUCCI green adult speciemen caudal fin cut. In a normal condition there are no green cells in the caudal fin of an adult FUCCI green fish. If part of the fin is removed performing a cut, after 2 days many green cells gathers, with a density that slowly drops toward the animal body. In the following days green cells specifically localize in proximity of the injury, reducing greatly their presence in the distal part. Over time the number of green cells drops, until the fin is totally regenerated.
47
2.3 F3 double FUCCI fish time lapse.
Once verified the correct pattern and functioning of both the FUCCI red and green transgenic lines, the F2 fish were crossed (FUCCI red with FUCCI green), generating double FUCCI green/red embryos, that were analyzed through confocal imaging.
Three to five embryos that showed at the stage of epiboly both the green and the red signal
(indicating the inheritance of both the FUCCI red and green transgene), were acquired for periods spanning from hours to days at stages from the end of epiboly to almost the end of somitogenesis, i.e. past the stage when embryos would enter into diapause II.
The stacks of images of each time point were then processed with Imaris and analyzed through particle analysis or surface analysis, depending on the specific cases.
All experiments were performed through time lapse confocal microscopy, acquiring the same embryo or different embryos multiple times, for many hours, during different phases of their development. Unfortunately each of these experiments required a huge amount of time, since every single time lapse acquisition lasted from 8 hours to 4 days, and for this reason the amount of repetitions for each stage is small (Table 2.1). In addition some stages, like the release from
diapause I, are very difficult to image, since they do not happen at a fixed developmental time, and last a relatively short amount of time (10 hours or less). I used the time lapse strategy because my main purpose was to give a complete overview about N. Furzeri development even if the
compromise was to have a small number of repetitions.
The transgenes expression was activated after the MBT stage, and detection of a fluorescence signal with a confocal microscope was not possible before the stage of 70% epiboly, so any image
reported here and relative to an earlier stage was obtained by synthetic RNA injection.
Embryonic Stage Amount of embryos imaged
Dispersed Phase (WS 19-20)
Early (with few green cells) 4
Late (with many green cells) 6
Dispersed Phase transition (from few to many green cells) 1
Reaggregation Phase (WS 21-25) 4
Extension Phase (WS 26) 4
Somitogenesis (without diapause II arrest) (WS 29-33) 6