1
INDEX
GENERAL INTRODUCTION
PART I: METHODOLOGY
1.0 INTRODUCTION
1.1 SONAR PRINCIPLES IN THE WATER 1.2 ECHOSOUNDING
1.3 MULTIBEAM
1.4 CHIRP SUB-BOTTOM 1.5 SPARKER SYSTEM
1.6 BATHYMETRIC AND SEISMIC INTERPRETATION SOFTWARES 1.6.1 GLOBAL MAPPER
1.6.2 SWANPRO™
1.6.3 GEOSUITE ALLWORKS 1.7 SEISMIC STRATIGRAPHY PRINCIPLES 1.8 THE SEISMIC RESOLUTION
PART II:
CONTINENTAL SHELF ENVIRONMENT:
STRUCTURAL-STRATIGRAPHIC EVOLUTION OF LAMPEDUSA ISLAND
AND SOUTH-EAST SICILY OFFSHORE
2.0 INTRODUCTION
2.1 PHYSIOGRAPHIC FEATURES OF THE CONTINENTAL SHELF
2.2 DEPOSITIONAL ENVIROMENTS: AUTOGENIC AND ALLOGENIC CONTROLS 2.3 SEQUENCE STRATIGRAPHY
2.3.1 SEQUENCE STRATIGRAPHIC UNITS 2.3.2 SEQUENCE STRATIGRAPHIC SURFACES
2.4 LATE MIOCENE TO QUATERNARY STRUCTURAL EVOLUTION OF THE LAMPEDUSA ISLAND OFFSHORE
2 2.4.1 GEOLOGICAL SETTING
2.4.2 DATA DESCRIPTION AND INTERPRETATION 2.4.2.1 Northern sector
2.4.2.2 Southern Sector 2.4.2.3 Eastern sector 2.4.3 DISCUSSION
2.4.4 CONCLUSIONS
2.5 STRUCTURAL AND STRATIGRAPHIC RECONSTRUCTION OF THE SOUTH-EAST SICILY CONTINENTAL SHELF
2.5.1 GEOLOGICAL SETTING
2.5.2 DATA DESCRIPTION AND INTERPRETATION 2.5.3 DISCUSSION
2.5.4 CONCLUSIONS
PART III:
SHALLOW-WATER DEPOSITIONAL SYSTEM:
GEOMORPHOLOGICAL EVOLUTION OF THE NORTH-EAST SICILY
3.0 INTRODUCTION
3.1 TRANSGRESSIVE WAVE-DOMINATED COASTS
3.2 PHYSICAL PROCESSES AND MAIN SEDIMENTARY STRUCTURES 3.2.1 RIPPLES AND HUMMOCKY CROSS-STRATIFICATION 3.2.2 PLANAR STRATIFICATION
3.2.3 DUNES
3.2.4 BARRIERS AND BEACHES 3.3 DELTA
3 3.4 GEOMORPHOLOGICAL RECONSTRUCTION OF THE NORTH-EAST SICILY CONTINENTAL SHELF
3.4.1 GEOLOGICAL SETTING
3.4.2 DATA DESCRIPTION AND INTERPRETATION 3.4.2.1 Shelf sector n. 1
3.4.2.2 Shelf sector n. 2 3.4.2.3 Shelf sector n. 3 3.4.3 DISCUSSION
3.4.3.1 LAST TRANSGRESSIVE STAGE RECONSTRUCTION 3.4.4 CONCLUSIONS
5
GENERAL INTRODUCTION
The main aims of this Ph.D Thesis are the characterization of the structural-stratigraphic evolution of the continental shelf deposits in offshore areas and the definition of its morphological features, through the interpretation of seismic profiles and bathymetric data.
The methodological study represented an important study phase, because the knowledge of the physical principles and of the technologies used in Marine Geology is the basis of a good interpretation of the acquired data. In particular, the geophysical technologies employed to acquisition of bathymetric data and seismic profiles interpreted in this Thesis are: the Multibeam system, Sparker system and Sub-Bottom CHIRP.
The Multibeam system allows to investigate the bathymetry of the seabed and, therefore, constituted an important instrument for defining the morphological characteristics of the study areas. The CHIRP Sub-bottom is a technology used in marine geology to acquire high resolution sub-bottom lines that represent acoustic sections below the seabed, along the route of the ship during the acquisition phases. The depth of the investigation and the resolution of the seismic data depend on the best compromise between source energy and signal frequency. The Sparker System is another high-resolution seismic-acoustic source and differs from Sub-bottom CHIRP mainly for the type of acoustic wave trigger and for the frequency (50-4000 Hz) of the acoustic signal. The study areas, lying in the inner part of the continental shelf, are the Lampedusa Island, the south-east and the north-east Sicily offshore. In order to develop coherent tectonic-stratigraphic models, the regional geodynamic context of the study areas was always considered during the seismic stratigraphic interpretation phase. In the following, the main results of the seismic interpretation in these three areas are reported.
The Pelagian Archipelago (Lampedusa, Lampione and Linosa Islands) is located in a complex and wide geodynamic system characterized by the occurrence of two independent tectonic processes acting simultaneously: convergence along the Apennine-Maghrebian accretionary wedge and late Miocene-early Pliocene rifting in the Sicily Channel. Through high resolution single-channel seismic reflection profiles (Sparker
6 System) recently acquired around the Lampedusa Island offshore, the reconstruction of an updated structural setting of this area and its regional correlation has been performed.
The late Miocene-early Pliocene rifting affects directly the structural evolution of the Lampedusa plateau, with the development of a graben and half-graben setting in most of the offshore area, widely filled with the syn-rift deposits. A different distribution of these depositional units in the various sectors (northern, southern and eastern) of the Lampedusa plateau is shown. In the northern sector, the activity of the normal faults associated with the rifting is active up to the early Pliocene, whereas it is quiescent since late Miocene in southern sector. This current fabric of the Lampedusa plateau derives by its involvement in regional extensional regime, lying in a dextral-transtensive zone and marked by pull-apart basins. In particular, two systems of the normal faults in the Lampedusa offshore have been recognized. The Master Extensional Faults oriented WNW-ESE represent the main structural alignment of the Lampedusa offshore and reflect the extensional trending of the Sicily Channel. The Second order of Extensional Faults, oriented NNW-SSE, bounds smaller pull-apart basins and are probably associated with the main dextral-transtensive regional regime.
From the comparison with some preexisting models known in literature, an update stratigraphic-structural model is proposed also to the southeastern continental shelf between the Gela-Catania foredeep and the Hyblean foreland offshore, along the Marina di Ragusa offshore.
The seismo-stratigraphic interpretation shows a NE-SW extensional faults system that involves only the late Miocene formations, probably connected to history of the Scicli Line and to polyphase kinematic evolution of the N50 oriented faults. Furthermore, the late Miocene extensional tectonic activity involves widely affects the offshore portions of the Hyblean foreland and its ramp, but it does not show evidences that this activity has involved the Plio-Pleistocene succession. The deposition of the Gessoso-Solfifera Formation has been widely recognized in the Hyblean foreland ramp, demonstrating that the evaporitic deposition does not is a peculiarity only of the deposits within the semi-isolated and marginal sub-basins or of the thrust top mini-basins of the Appennine-Maghrebides belt, but extends also in areas where the extensional tectonic have been dominant, at least during the pre-Messinian age.
7 Through Multibeam bathymetric data, an update characterization of the geomorphological setting of the north-east Sicily continental shelf, between Milazzo Promontory and the area offshore from the Saponara River, is provided in the Chapter 6. Furthermore, through high-resolution CHIRP seismic profiles interpretation, a reconstruction of the evolution of the last eustatic sea level cycle is performed, on the basis of the morpho-stratrigraphic description of the transgressive and highstand wedges. The lowstand succession, corresponding with the foreset of the prograding clinoforms of the continental margin deposits, determines the accommodation space for the depositional processes that occur during the rise of the sea level. In fact, the evolution of the transgressive and highstand wedges is strongly influenced by the geometry of the underlying lowstand succession. The transgressive wedge is developed in the 80-100 m bathymetric range and consists of the relict geomorphic elements that represent past landscape. These elements tracked the variations in coastline position during the last sea-level rise, formed during an interval of relatively reduced rate of seasea-level rise. With the support of 3D bathymetric maps, a reconstruction of the geomorphological evolution of the past coastal systems during the last transgressive stage is provided. The highstand wedge consists of the Corriolo, Muto, Niceto, Cocuzzaro and Rometta delta deposits that widely develop on the offshore portions of the inner continental shelf.
9
PART I: METHODOLOGY
1.0 INTRODUCTION
Part I of this Thesis represents a detailed methodological study of the geophysical technologies used during the data acquisition in the study areas (Lampedusa island, south-east and north-east Sicily). In particular, a short review of the main physical principles about at the propagation of the sound in water introduces the description of these technologies, the bathymetric and seismic interpretation softwares and the seismic stratigraphy principles.
In particular, the stratigraphic and morpho-structural setting of the Lampedusa Island offshore and the part of the northeastern and southeastern offshore of Sicily, is reconstructed in this Thesis through the accurate analysis ofseismic profiles and bathymetric dataacquired with three SONAR technologies: EM710 Reason SeaBat 7111 Multibeam, Teledyne BENTHOS III CHIRP and Marine Multi-Tip Sparker System, Geo-Source 200 Light Weight model.
In Table 1.1 are reported some information about the oceanographic cruises during which the seismo-bathymetric data have been acquired.
Year Project Institute Ship Data acquired
2009 MAGIC CNR_ISMAR_BO Urania Sub-Bottom CHIRP 2009-2010 MAGIC CNR_ISMAR_BO Maria Grazia Multibeam
2011 MAGIC CNR_ISMAR_BO Urania Multibeam
2014 MARBEEP CNR_ISMAR_BO Urania Sub-Bottom CHIRP 2015 SIMIT UNI_CT Neptune 1 Sparker System Table 1.1 – The oceanographic cruises and the projects with which the geophysical data
10 In the following, the main technical features of the oceanographic ships are described.
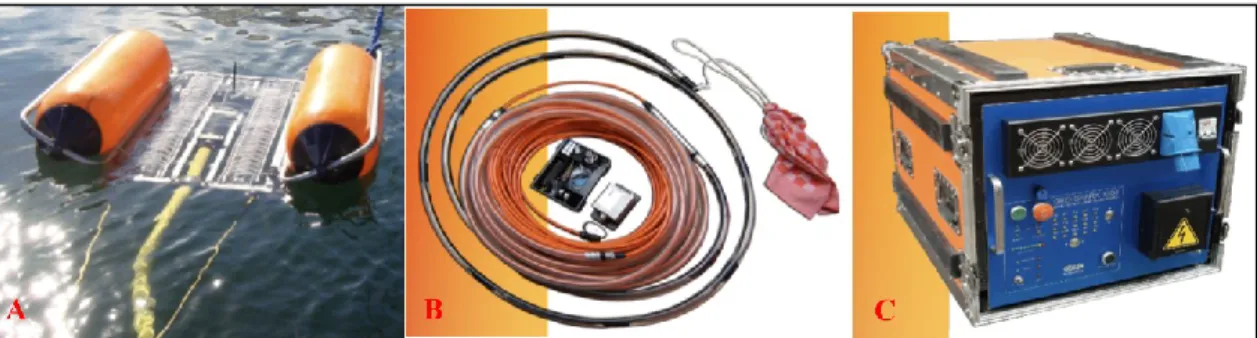
The Urania oceanographic ship (Fig. 1.1A) is managed by the CNR (Consiglio Nazionale delle Ricerche). It has 45 days of self-sufficiency and can accommodate up to 36 persons between scientific staff and crew. The speed range for continuous detection varies between 1.5 and 11 knots. The propulsion system consists of two variable pitch propellers driven by two 1000 KW engines and a 220 kW propeller. The ship is equipped with a Simrad Dynamic Positioning System for precision maneuvers. The ship hosts laboratories for analysis, geological sampling, chemical and radiological laboratories, and allows the elaboration of navigation data, geophysics and data captured using the Remote Operated Vehicle (ROV) and multiparameter probe. Geophysical instruments include a Chirp Datasonic profiler, a Sparker, a 3.5KHz Sub-Bottom Profile, a Uniboom, a 100 - 500KHz side scan sonar and a magnetometer. As for the sampling systems (operating up to the deepest depths of the Mediterranean), gravity and piston samplers, box corers and buckets (Shipek and Van Veen) are available.
Fig. 1.1 – A. The Urania oceanographic ship; B. The Maria Grazia oceanographic ship; C. The Neptune 1 oceanographic boat.
The Maria Grazia oceanographic ship (Fig. 1.1B) is enabled for unlimited Mediterranean navigation and has a maximum operating autonomy of approximately 30 days. It can host up to 8 crew members and 10 scientific/technical staff. It has a length of 42 meters and reaches about 16 knots of maximum speed thanks to two 433 kW motors. The ship can perform: geophysical surveys (Multibeam echo sounder, Singlebeam echo sounder, Sub Bottom Profiler), surface data collection, CTD, continuous water sampling, ADCP, dredges, box corer, bucket; support for geomorphological inspections with Sparker, Uniboom, Side Scan Sonar, Magnetometer, ROV and AUV.
11 The Neptune 1 (Geonautics s.r.l.) (Fig. 1.1C) oceanographic boat is equipped with 100 HP Volkswagen Marine motorization that allows fast moving. Through the trolling valve system, it maintains extremely low speeds for long periods, a key factor for the goodness of a survey. On board there are two pc stations and a TV monitor for ROV analysis. The navigation system allows to connect GPS, magnetometer, USBL, motion sensors. The boat can be equipped with Sub Bottom CHIRP, Sparker and Multibeam system.
1.1 SONAR PRINCIPLES IN THE WATER
Acoustic waves move quite efficiently through water. As an example, the whales use sound to communicate over distances of 10s kilometers. The ability of sound to travel over such great distances is at the basis of the remote sensing technique in the submarine environment. Sound travels in water in a moving series of pressure fronts known as a compressional wave. These pressure fronts move at a specific speed in water, named the local speed of sound. The local speed of sound can change depending on the conditions of the water such as its salinity, pressure, and temperature, but it is independent of the characteristics of the sound itself. In a typical ocean environment, the speed of sound is about 1500 m/s.
The physical distance between pressure fronts in a traveling sound wave is its wavelength. The number of pressure fronts that pass a stationary point in the water per unit time is the frequency of the wave. Wavelength, if measured in meters (m), and frequency, if measured in cycles per second (Hz), are related to each other through the speed of sound, which is measured in meters per second (m/s):
speed of sound = frequency x wavelength
When a sound wave meets a change in the local speed of sound, its wavelength changes, but its frequency remains constant. For this reason, sound waves are generally described in terms of their frequency.
12 A sound wave carries a certain amount of acoustic energy. This energy can be measured by a device called a hydrophone, which measures the oscillations in pressure. The size of these oscillations is the amplitude of the wave (Fig. 1.2).
Fig. 1.2 – Graphic representation of an acoustic wave.
As a sound wave propagates, it loses some of its acoustic energy. This happens because the transfer of pressure differences between molecules of water is not 100% efficient, but some energy is lost as generated heat. The energy lost by propagating waves is called attenuation. As a sound wave is attenuated, its amplitude is reduced. Sound waves are useful for remote sensing in a water environment because some of them can travel for hundreds of kilometers without significant attenuation. The level of attenuation of a sound wave is dependent on its frequency: high frequency sound is attenuated rapidly, while low frequency is attenuated with great distances.
When a moving sound pulse encounters another medium, only a fraction of its energy propagates into the new material. How much of the energy is transmitted is dependent on several factors, including the impedance of the new material (a product of the material’s density and the speed of sound within it), the angle of incidence of the impinging pulse (the angle at which the sound pulse strikes the new medium), and the roughness of the new medium’s surface. The energy that is not transmitted into the new material must go back into the original medium: the water. Some amount of it is reflected off the surface of the material: essentially it rebounds in a direction that depends on the angle of incidence. The remainder is scattered in all directions (Fig. 1.3).
13 Fig. 1.3 - Components of an Echo Event on the Ocean Floor (by Multibeam Sonar, Theory and Operation, 2000)
How much energy goes into reflection and how much goes into scattering depends on the characteristics of the material and the angle of incidence. The energy returned to the water is called an echo. The echo maintains the frequency attributes of the source wave.
1.2 ECHOSOUNDING
The echo sounding is a technique for measuring water depths by transmitting acoustic pulses from the ocean surface and recording for their reflection (or echo) from the sea floor. This technique has been used since the early twentieth century and has allowed the ships to navigate in safety through the world’s oceans. In addition, the information derived from echo sounding has aided in laying trans-oceanic telephone cables, exploring and drilling for off-shore oil and improving our understanding of the Earth’s geological processes.
The echo sounder is a tool that generates acoustic waves through transducers, devices that converts energy from one form to another and analyzes the return signal. Until the early 1960s, most depth sounding used single-beam echo sounders. These devices make a single depth measurement with each acoustic pulse and include both wide and narrow beam systems. Over the years, the scientific progress has reached the
14 best compromise between the acoustic amplitude (greater area coverage) and the acoustic energy (higher resolution), experimenting successfully a new system named multiple narrow beam. This system allows mapping of the sea bottom through a simultaneously emission of a beam of acoustic waves, reducing the navigation times and the costs.
The multiple narrow beam and, in general, the transmission of the acoustic waves through the water column represent the physical concepts at the basis of the instruments for the data acquisition interpreted in this PhD thesis: multibeam, sub-bottom chirp and sparker system.
1.3 MULTIBEAM
The Multibeam system allows to investigate the bathymetry of the seabed. It can operate in shallow and deep waters, properly changing the frequency and the energy of the acoustic wave. The instrument, assembled below the keel of the ship, emits the acoustic pulses that are reflected by the seawater-seafloor interface and back to the surface, where they are recorded by the transducers. The backscatter is the physical feature for which a part of the acoustic energy emitted is reflected and diffused by the seabed roughness. It represents a different parameter, through which it is possible to acquire additional information on the morphological and textural characteristics of the seabed investigated.
For each acoustic pulse, the time it takes for a reflection from a particular boundary to arrive at the geophone is called the travel time. For a simple vertically traveling wave, the travel time from the surface to the reflector and back is called the Two-Way Time (TWT) and is given by the formula:
Time = 2 (depth / wave velocity)
Therefore, the Multibeam is a multiple impulse system: more waves at different angles are generated at the same time. During the emission, a beam of the acoustic pulses (swath) investigates the seabed orthogonally to the axis of the ship. With a
15 constant angular aperture of the acoustic beam, the seabed area investigated (footprint) gradually increases toward deeper bathymetry (Fig. 1.4)
Fig. 1.4 – Schematic functioning of the Multibeam system.
During the survey acquisition, the navigation routes tend to be parallel, with partial overlapping of the swaths in order to allow the full coverage of the study area. The lateral beams travel longer way and with an incidence angle greater than the central ones. Then, they are more susceptible to the dispersion of the original acoustic energy. In fact, if necessary, the beam aperture can be changed until the optimal emission angle is achieved.
16 Fig. 1.5 – Hardware components of the Multibeam system (Multibeam Sonar, Theory and Operation, 2000).
The batimetric data interpreted in this PhD thesis was mainly acquired through the EM3002d and EM710 Reason SeaBat 7111 Multibeam (Fig. 1.6).
17 The EM3002d and EM710 Reason SeaBat 7111 are two 455 kHz Ultra High Resolution Focused Multibeam Echosounder (MBES) systems, which measure the relative water depth across a wideswath perpendicular to the vessel’s track. The SeaBat 7111 uses high frequency focused near-field beam forming to provide a good level of detail. The five standard components of the SeaBat 7111 system are descripted in the following.
- The Sonar Processor can be mounted in the operating space. It is the source of operating power for the Sonar Head and all system I/O connections are made at the processor's rear panel;
- the Processor to Sonar Head Signal and Control cable is a multi-conductor cable of water-blocked construction with a molded waterproof pressure immune connector at the wet end and an MS-type connector at the dry end. The standard cable is 25 meters in length;
- the Sonar Head is compact, with no moving parts. It may be temporarily mounted on a retractable structure or permanently on an extension through the hull in a moon pool, sea-chest configuration, or on a Remotely Operated Vehicle (ROV);
- the Color Video Monitor is a standard PC-type S-VGA monitor.
The maximum selectable range scale is 600 meters. However, maximum swath width typically occurs at a water depth of 400 meters. At depths greater than 400 meters, accurate bottom surveys are still possible, but with a corresponding decrease in swath width. The Seabat 7111 system illuminates a swath on the sea floor that is 120º across track by 1º along track. The swath consists of 240 individual 0.5º by 1.0º beams at the center and 1.0º by 1.0º at the outer ends. The bottom detection range resolution is 2.5 cm. During the acquisition phases, in order to know the sound velocity along the water column and thus to minimize the errors of the depth investigated, a Reson SVP-C probe was used at regular intervals.
The data was acquired with the SIS and PDS2000 softwares and subsequently processed with CARIS HIPS & SIPS softwares by the technologists of the ISMAR (Istituto di Scienze Marine) of the CNR (Consiglio Nazionale delle Ricerche) of Bologna (Italy). The final output is a Digital Terrain Model (DTM) of the submerged sectors of the North-East Sicily, with a spatial resolution of about 1 m within the shelf area and 5 m within continental escarpment. In particular, The Digital Terrain Model (DTM) used for the
18 interpretation of the geomorphology of the study area was compiled from data acquired with different multibeam systems on board several oceanographic vessels. High resolution bathymetric data were acquired during two cruises in the upper slope and shelf area, carried out on board R/V Mariagrazia in 2009 and 2010 using a hull-mounted Kongsberg EM3002D (300 kHz) and a pole-mounted Reson 7111 (100 kHz) multibeam system respectively. In 2011 some sectors of the outer shelf were re-mapped with a hull-mounted Kongsberg EM710 (70–100 kHz) multibeam system on board R/V Urania.
The Multibeam data interpreted in this Thesis cover an area of about 75 Km² of the northwestern Sicily offshore, from a depth of 40 m to 150 m and represent a tool of fundamental importance to define the morphological characteristics of the study area.
1.4 CHIRP SUB-BOTTOM
The Chirp Sub-bottom is a technology used in Marine Geology to acquire high resolution subbottom lines, that represent acoustic sections below the seabed, along the route of the ship during the acquisition phases. The depth of the investigation and the resolution of the seismic data depend on the best compromise between source energy and signal frequency.
Together with the multibeam data acquisition, high resolution CHIRP seismic profiles were acquired on board R/V Mariagrazia and Urania with a hull-mounted Teledyne BENTHOS III CHIRP system having a frequency modulation between 2 and 20 kHz (Gamberi et al., 2014).
Teledyne BENTHOS III CHIRP is an instrument belonging to high-resolution seismic sources. Benthos is a pioneer in Chirp technology and was the first to bring a commercial Chirp sub-bottom profiling system to the market. Teledyne Benthos continues that advancement with the Chirp III sub-bottom profiling system. Its versatile system configuration has been designed to operate with a wide variety of tow-vehicles and sound sources.
The main components (Fig. 1.7) of the Teledyne BENTHOS III CHIRP are:
- Tow-vehicle (TTV-290 Series): it is designed for hydrodynamic stability in most towing applications. The stainless steel midplate construction provides users
19 with a rigid and stable platform to mount additional sensors. TTV-290 tow vehicle includes a 2x2 Low frequency (2-7 kHz), transducer array (AT-471), high frequency (10-20 kHz) transmit projector, receiving hydrophone and all interconnect cables;
- Chirp III transceiver (DSP-6651): it includes a 4KW power amplifier, heave compensation delay key, analog preamplifier gain 0, + 15dB,+30dB and dual analog input channel, DSP hardware which provides the user with matched filter or digital processing for analog sources and multi-task operations;
- Personal Computer with a monitor: it represents the acquisition system and allows the visualization in real time of the data acquired and the processing of the digital signal. The acquisition system performs a digital recording in .SEGY format.
Fig. 1.7 - Main components of the Teledyne BENTHOS III CHIRP.
One or more hydrophones detect the reflected seismic waves that are transformed in an analogic electrical signal, subsequently filtered and transformed in digital signals. Finally, the seismic data are processed and analyzed on paper or monitor for the seismic stratigraphy interpretation.
In order to provide an accurate stratigraphic-structural characterization of the northwestern Sicily offshore, the interpretation of several CHIRP seismic profiles has been
20 performed. In particular, 90 seismic profiles acquired during the MARBEEP survey and 78 seismic profiles acquired during the MAGIC survey were interpreted, covering a surface of about 80 Km² and comparing the results with the batimetric data of the Digital Terrain Model.
1.5 SPARKER SYSTEM
The Sparker System is another high-resolution seismo-acoustic source and differs from Sub-bottom CHIRP mainly for the type of acoustic wave trigger and for the frequency (50-4000 Hz) of the acoustic signal. Following the release of a high-voltage and lower-power electrical discharge between two or more electrodes submerged in water, the Sparker System generates a shock wave, followed by bubble pulses produced by expansion-contraction of further gas bubbles.
Also in this case, the output data are the seismic profiles but that involve a greater depth of the investigation (up to 500 m, as a function of the lithology) and a lower vertical resolution (up to 20 cm) than the Sub-bottom CHIRP (Fig. 1.8).
Fig. 1.8 – Comparison of the different resolutions between CHIRP and Sparker System (named also Boomer).
21 The seismic data of the Lampedusa Island offshore described and interpreted in this Thesis have been acquired with the Marine Multi-Tip Sparker System, Geo-Source 200 Light Weight model. Designed to be towed by small boats, it uses a maximum power of 1000 Joules to cover depths between 2 and 500 m, reaching an average penetration of 200-300 ms and a vertical resolution up to 20-30 cm. The Geo-Source 200 is made up of three main components (Fig. 1.9):
- the Geo-Spark 1000 Pulsed Power Supply consists of dozens of electrodes that develop a negative electric charge with a high-voltage flexible cable of standard length of 25 m;
- the Single Channel Array is a Mini-Streamer (50-100 meters) with 8, 16, 24 or 48 hydrophobes, created to capture a high frequency spectrum;
- the Solid State Pulse Power Supplies generates the acoustic signal; it is designed to avoid electric oscillations and to work at a power of 100 up to 1000 Joules.
Fig. 1.9 – Main components of Marine Multi-Tip Sparker System, Geo-Source 200 Light Weight model. A. Geo-Spark 1000 Pulsed Power Supply; B. Mini-Streamer (16 hydrophones); C. Solid State Pulsed Powe Supplies.
In this work a grid of 21 seismic profiles with the Sparker System was acquired, consisting of both dip and strike lines in the northern, eastern and southern offshore of the Lampedusa Island. The technical features and some characteristics of the acquisition phase are reported in Table 1.2.
22 Table 1.2 - Some technical data of the Geo-Spark 1000 Pulsed Power Supply system, employed during the acquisition phase.
All the seismic profiles were acquired in .SEGY format and interpreted using the Geo-Suite software. The acoustic penetration (about 250-300 ms TWT) allowed a good imaging of the upper part of the sedimentary succession and tectonic fabric of the Lampedusa offshore. The thickness of the deposits and the throw of extensional faults were calculated using an average velocity model of 2000 m/sec.
1.6 BATHYMETRIC AND SEISMIC INTERPRETATION SOFTWARES
1.6.1 GLOBAL MAPPER
Global Mapper is a viewer capable of displaying the most popular GIS raster, elevation and vector datasets, allowing users to easily view, edit and export the bathymetric data in multiple formats (Fig. 1.10).
23 Fig. 1.10 – Screenshot of Global Mapper software, showing a frame of the northeastern Sicily offshore.
The main tools used in the bathymetric interpretation are: - loading and visualization of the Digital Terrain Model; - creation of the elevation profile graphs;
- creation of the contours from the Digital Terrain Model; - creation of the points, lines and areas;
- export of the contours to .DWG or SHP formats. - creation and export of 3D mesh;
- simulation of the variation of the sea level in 3D view.
Developed by Blue Marble Geographics for Windows OS, the main quality of the Global Mapper software is the simple interface that allows an immediate access to advanced analysis tools and a fast processing of the large number of spatial data interpreted along the northeastern Sicily coastline.
1.6.2 SWANPRO™
SwanPro™ (Communication Technology) is innovative software for real time data acquisition of sea floor imaging systems and seismic systems. It digitizes in real time, records and processes true 16 bits/sample signals and combines the imagery with the navigation inputs to geo-reference the data in real-time. This software interfaces with sub
24 bottom profilers CHIRP (Fig. 1.11) and other seismic systems (also the Sparker System). It runs under any 32 and 64 bit Microsoft Windows operating system and is very flexible and user friendly.
Fig. 1.11 - Screenshot of SwanPro™ software, showing a Sparker seismic profile of the Lampedusa island offshore.
SwanPro™ supports several digital formats, including .SEGY format. The main tools used to seismic interpretation are:
- loading and visualization of the seismic profiles;
- variation of the “gain” (LUT function), that is the change in the amplitude of electrical signal from the original input to the amplified output;
- automatic conversion time-space for the determination of the distances between the acoustic reflectors.
All the seismic profiles reported in this Thesis have been described and interpreted also through SwanPro™.
1.6.3 GEOSUITE ALLWORKS
GeoSuite AllWorks (Geo Marine Survey Systems) is a comprehensive environment for the processing and the interpretation of the seismic profiles and related data resources. Through this software, standalone seismic data viewer or project to process different seismic data types can be performed. In particular, a project allows to investigate
25 the survey area with a wide set of dedicated tools for seismic profiles processing and interpretation in a GIS environment (Fig. 1.12).
Fig. 1.12 - Screenshot of GeoSuite AllWorks software, showing the geographic location of the seismic Sparker profiles acquired along the Lampedusa island offshore and the view for their interpretation.
The main tools used to the seismic interpretation are:
- loading and visualization of the seismic profiles (also in 3D view);
- processing sequence (debias-gain-IIR filter-Mute to cut water column-Trace equalization-Swell filter);
- resizing of the seismic traces, through the “traces/cm” and “ms/cm” functions;
- interpolation mode (none, bilinear or bicubic);
- variation of the “gain”, that is the change in the amplitude of electrical signal from the original input to the amplified output;
picking horizons and picking faults.All the seismic profiles reported in this Thesis have been described and interpreted also through GeoSuite AllWorks.
26
1.7 SEISMIC STRATIGRAPHY PRINCIPLES
The seismic reflectors (named here also acoustic horizons) generally correspond to physical surfaces that separate media with different value of acoustic impedance (product of the material’s density and the speed of sound within it). For example, the stratification surfaces within a sedimentary succession (or the reflections generated by fluids with a different density) produce phenomena of reflection-refraction of the acoustic waves. However, the gradual facies lateral variations normally do not produce distinct reflections and, in addition, not all reflectors correspond to well-recognizable physical surfaces.
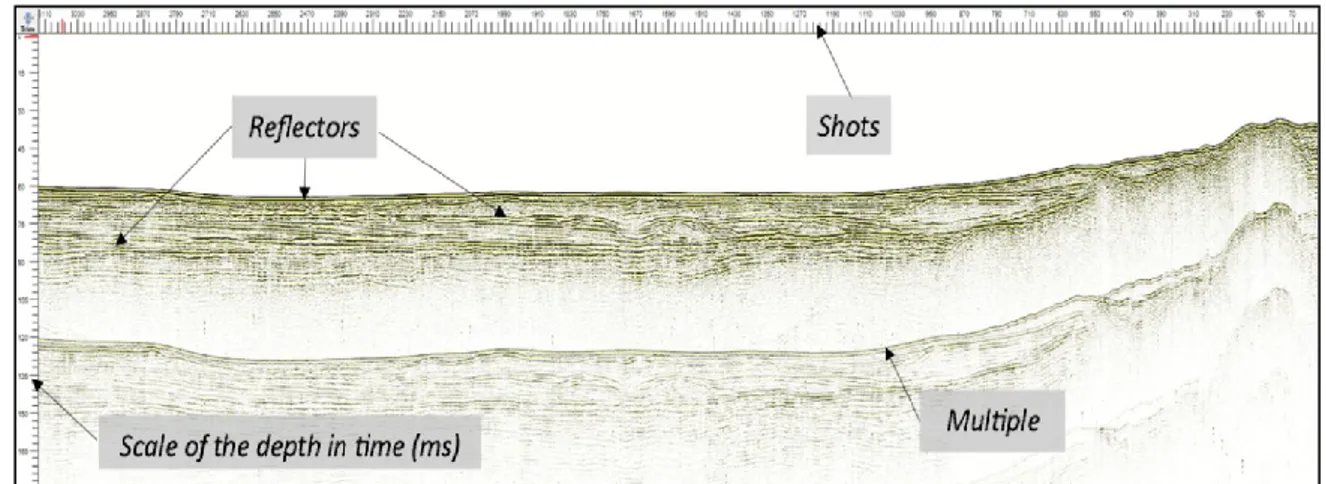
The seismic profiles processed and interpreted in this Thesis have a horizontal scale expressed in Shots, corresponding to times in the acquisition phases and recorded by progressive numeration. Instead, the vertical scale is expressed in time. Specifically, the vertical scale represents the time between the instant in which the acoustic pulse was generated and the instant in which the return energy is recorded by the hydrophone. This value is twice the time that the acoustic wave employs from the surface of the sea to the reflector: for this reason the time scale is commonly expressed in TWTT (Two-Way Travel Time) (Fig. 1.13).
During the interpretation phase, a 6x vertical exaggeration was applied in each Chirp and Sparker seismic profiles. In this way, the vertical and horizontal scale ratios have changed, favoring the visualization of the acoustic reflectors.
Fig. 1.13 – Example of a Sparker System seismic profile and main components within the interpretation window in GeoSuite Allworks software.
27 The seismic profiles often show numerous interferences, defined noises, which are mainly due to the surrounding environment or to the navigation processes.
The multiples are a type of seismic noise due to successive reflections of a same horizon. In a seismic profile the multiple of a reflector appear as its acoustic repetition at a multiple depth and with a greater inclination (Fig. 1.13).
The diffraction hyperbola are another type of seismic noise and are generated when the seismic wave strikes a point of discontinuity of a horizon, such as a tectonic discontinuity. In according with the Huygens-Fresnel principle, this point becomes a source of secondary spherical waves that propagate inside the medium producing a series of false signals (Fig. 1.14).
Fig. 1.14 - Close to the faults, numerous diffraction hyperbola can be generated, overlapping with the real signals.
The ringing effect creates an interference caused by the absorption and resonance of the acoustic pulse emitted by the source. Frequently recognized in seismic profiles, the ringing consists in a series of reflective surfaces that are repeated with a regular spacing (Fig. 1.15).
28 Fig. 1.15 - “Ringing" effect of the bottom of the sea.
In the seismic interpretation of this work, the real reflectors are assembled in seismic facies that have homogeneous and different acoustic features than those of the adjacent units. The seismic facies can provide useful information on the environments and on the sedimentary processes. Furthermore, their variations in amplitude and the lateral continuity of the reflectors provide useful indications about the lithological features of the investigated stratigraphic units.
1.8 THE SEISMIC RESOLUTION
In seismic stratigraphy the vertical resolution is the minimum vertical distance between two interfaces, necessary to achieve a single reflection (Emery and Meyers, 1996).
The seismic acquisition depends by some physical parameters: Pe: energy of the pulse;
Bw: amplitude of the spectrum frequency; PI: pulse duration.
The resolution R (in meter) is:
R: PI x Vs / 2
29 This mathematical relation shows as the wave amplitude and the acoustic energy influences directly the vertical resolution and the penetration depth of the signal: high frequency corresponds usually with increasing in the resolution. For example, the geophysical acquisition systems generate signal with less than 1 kHz of frequency and acquire low-resolution data but with a high penetration rate, such as the systems air/water-guns. Instead, the technologies belonging to the high resolution system class use frequency spectra comprised between 1 and 30 kHz, such as Sub Bottom Chirp.
The lateral resolution is the minimum distance between two points of the same surface and depends on the shot rate and the speed of the ship during the acquisition phases.
31
PART II: CONTINENTAL SHELF ENVIRONMENT:
STRUCTURAL-STRATIGRAPHIC EVOLUTION OF LAMPEDUSA ISLAND
AND SOUTH-EAST SICILY OFFSHORE
2.0 INTRODUCTION
The study areas (Lampedusa Island, Marina di Ragusa and North-East Sicily offshore) lie, from a physiographic point of view, along the continental shelves, that is the submarine areas closest to land and where the fluvial sediment transport to the offshore in combination with the oceanographic processes is the main control for the development of geomorphic elements (Gamberi et al., 2014). In fact, in all study areas, the continental shelf represents the common physiographic and environmental context along which the new seismic and batymetric data have been acquired. The physiographic features of this depositional environment are briefly descripted in this Part, highlighting that the autogenic and allogenic factors directly control the stratigraphic evolution of the depositional units detected. Furthermore, the influence on the depositional systems of the global scale factors (eustatic variations, climatic variations, morpho-structural setting) and local-scale factors (physical erosion and transport processes) are also discussed. In the following sections, the concept of sequence stratigraphy is carefully studied, because an accurate knowledge of the various stratigraphic sequence units (sequences in s.s., parasequences and system tracts) was crucial during the seismic-interpretation phase.
In particular, through the interpretation of high-resolution seismic profiles (Sparker System) are described and discussed two areas in this part of the Thesis:
1 - Lampedusa Island offshore, with the reconstruction of current structural evolution of the area and its regional significance;
2 - Marina di Ragusa offshore, with the proposal of new stratigraphic-structural model that connect the Gela-Catania foredeep and the Hyblean foreland ramp and the description of the Plio-Pleistocene succession and its areal distribution.
32
2.1 PHYSIOGRAPHIC FEATURES OF THE CONTINENTAL SHELF
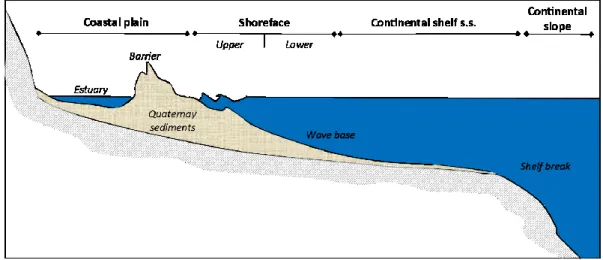
The coastal zone, as described by Inman & Brush (1973), is essentially represented by three sub-environments: coastal plain, shoreface and continental shelf s.s (Fig.2.1).
Fig. 2.1 – Physiographic schematic setting of the continental shelf (modified by Masselink & Hughes, 2003)
The coastal plain is an area of flat, low-lying land adjacent to a seacoast and separated from the interior by other topographic features.
The shoreface is that portion of the shelf that lies above the low-tide, and which is dominated by swash and backswash of breaking waves. It is the narrow zone seaward from the low watermark in which sand and gravel are moved by the waves and the currents. And in particular, lower shoreface refers to the portion of the seafloor that lies below the maximum depth at which a water wave's passage causes significant water motion (wave base). Instead, the upper shoreface refers to the portion of the seafloor that is shallow enough to be agitated by the wave action.
The continental shelf s.s. is a submerged shelf of land that begins at a continental shoreline (lower boundary of the shoreface), slopes downward gradually at an angle of about 0.1° for a variable distance, and ends at the top of a much steeper downward slope (continental slope) at an angle of about 3° to 6° until it reaches the ocean floor. The abrupt slope breaking that limits the two areas is mainly controlled by structural factors and isostasy processes of large scale (Southard & Stanley, 1976).
33 The morphology and stratigraphy of continental shelf areas are controlled by factors, such as global eustatic variations and local morpho-structural and climatic features. Secondly, physical erosion and transportation processes also contribute to modeling superficial sedimentary cover and thus affect the continental shelf physiography.
Although the surface of continental shelf is involved with variable hydraulic conditions, also in short periods of time, it can be considered as an area of dynamic equilibrium.
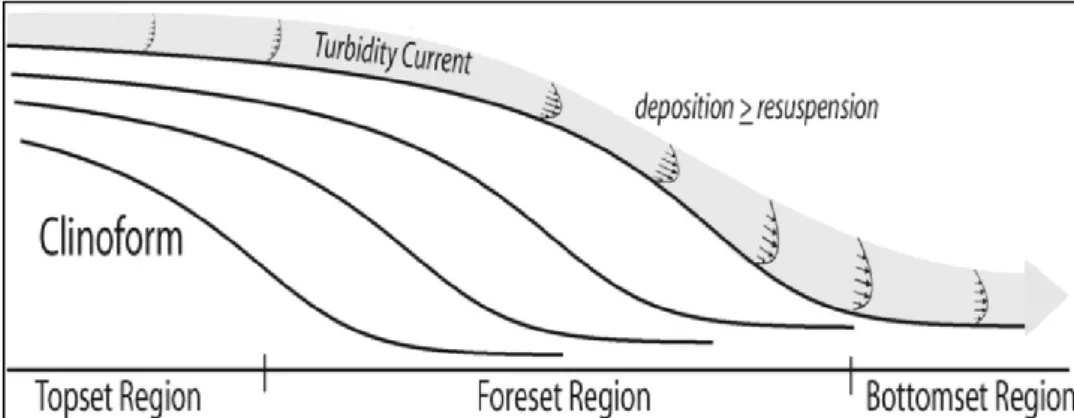
Here, in absence of relevant sea-level changes, during the sedimentation processes, the sedimentary prism aggrades and the ratio of sediment deposited and transported decreases until the achievement of the base wave. An ideal non-deposition surface (topset) tends to form. It is slightly inclined towards the sea, while the depositional area moves towards the deeper areas (continental slope). According to this dynamic process, the time-surfaces assume clinoform morphology, typical of shelf deposits (Fig. 2.2).
Fig. 2.2 - Typical clinoform morphology in the shelf deposits.
The slope breaking, close to the lower limit of influence of the wave motion, is defined offlap break. It separates the topset region from the foreset that is the steepest portion of the clinoform, where dominate the gravitational mechanisms of transport and deposition (foreset region) (Rich, 1951; Mitchum, 1977; Friedman et al., 2001). Towards the sea, the deposition processes consist mainly of the fall-out of fine grain sediments: in this area, the deposits tend to have a sub-horizontal geometry (bottomset region).
34 In function of the physical external conditions, new equilibrium surfaces tend to form. Therefore, the continental shelf consists of several depositional sequences, reflecting the changes triggered by these factors. According to these methods, the continental margins tend to assume a common morphological configuration. The role of the marine geologist is, then, to interpret this configuration, taking into account the different regional structural setting of each continental shelf.
2.2 DEPOSITIONAL ENVIROMENTS: AUTOGENIC AND ALLOGENIC CONTROLS
Siliciclastic sediments accumulate in wide range of setting, from mountainous areas, through low-ling alluvial-plain and coastal environments, to shallow- and deep-marine setting. The nature of depositional environments and the deposits created within them is a function of many variables, which can be divided in two broad groups.
The first of these are those processes that are intrinsic to the environment and are termed autogenic. They are the distinctive physical features of an environment. For example: the fluvial environments are dominated by unidirectional currents and the coasts experience the wave action and tidal current in various combinations. Within each of these settings, the intrinsic processes create a distinctive geomorphology: the currents tend to create channels and the waves produce beaches and shorefaces. Therefore, there is a feedback between the geomorphology, the processes and the available sediment such that particular geomorphic settings are characterized by specific types of deposits.. In particular, the coastal zone and its associated shallow-marine environments are uniquely complex because the interaction of both terrestrial and marine processes. This zone is also especially sensitive to changes in accommodation, as reflected in change in relative sea level (Boyd et al., 1992; Harris et al., 2002). Coastal environments are most commonly subdivided on the basis of the dominant physical process, where the “dominance” is assigned to the process that transports and deposits the greatest volume of sediment because this process is responsible for producing the characteristics of the deposits.
The second group of variables is those that are external to local environment. They include the accommodation space, tectonic setting and climate. These allogenic factors
35 create the broader context in which the environment sits and thereby have an influence on the grain size supplied to the environment, the precise nature of the processes that operate (e.g., the relative influence of wave and tides) and the large-scale evolution of the environment.
- Accomodation: is the space available for the potential sediment accumulation and is the most fundamental control because the accommodation at any location determines whether sediment accumulates or not (Catuneanu, 2006). If the accommodation is zero (the equilibrium profile coincides with the sediment surface), the site is an area of sediment bypass with no deposition or erosion. If the accommodation is negative (the equilibrium profile lies below the sediment surface), net erosion occurs. Accumulation can only take place where there is positive accommodation, with deposition occurring until the sediment surface. Eustatic sea-level change, tectonic activity and change in energy level are all phenomena that determine changes in the accommodation space.
- Tectonic setting: it exerts an important control on the nature of the depositional system. In particular: i) it influences the features of the source area and the steepness of the transport system; ii) it determines the spatial distribution of the subsidence and accommodation, influencing also the grain size of the sediments.
- Climate: it determines the siliciclastic sedimentation, because influences the rate of the erosion and deposition through its control on the temperature (Allen, 1997). The variation in sediment supply produced by climatic changes can cause rivers to incise and can produce an alternation in fluvial style between braided and meandering (Blum and Tornqvist, 2000). The climate, as governed by astronomically determined changes in solar insolation (Milankovitch cyclity), also drives eustatic sea-level change.
2.3 SEQUENCE STRATIGRAPHY
Sequence stratigraphy began almost 70 years ago when Sloss et al, (1949) coined the term sequence for a stratigraphic unit bounded by large-magnitude, regional
36 unconformities which spanned most of North America. Wheeler (1957, 1958) proposed, instead, a model building to provide a theoretical foundation for the development of unconformities and consequent sequences. It was not until the early 1960s that Sloss (1963) fully developed the concept and named six sequences which occurred throughout North America. Sloss (1963) recognized the major unconformities that bounded the sequences through empirical science and he interpreted as tectonic uplift episodes. In summary, by the mid-1960s, sequence stratigraphy was characterized by two separate approaches, one of data-driven empiricism as exemplified by the work of Sloss (1963) and the other of model-driven deduction as used by Wheeler (1957, 1958).
In 1970s, the first seismic data refresh the sequence stratigraphy concept. In fact, the seismic stratigraphy is defined as perhaps best way to study the sequence stratigraphy. Vail et al., (1977) demonstrated, through the use of seismic sections, that the sedimentary record consists of a series of units that are partially bound by unconformities (Vail et al, 1977). These units were termed “depositional sequences”. Shortly after, Mitchum et al., (1977) modified the sequence definition, specifying “bounded by unconformities or their correlative conformities”, where an unconformity is defined as a stratigraphic surface across which there is a significant gap in the stratigraphic record. Salvador (1994) specifies that the unconformity is a change in depositional trend from deposition to non-deposition and back again to deposition, and adds that it can also be created by submarine erosion or by non-deposition alone.
Finally, Catuneanu (2011) defines the actual concept of the sequence stratigraphy, defining it as a methodology that provides a framework for the elements of any depositional setting, facilitating paleogeographic reconstructions and the prediction of facies and lithologies away from control points. The sequence stratigraphic framework also provides the context within which to interpret the evolution of depositional systems through space and time.
37 Fig. 2.3 - Evolution of sequence stratigraphic approaches (from Catuneanu et al. 2010).
Although the stratigraphic-sequential method is of common use in stratigraphic analyzes and despite some concepts are largely recognized in literature, a unique model is not currently accepted and used. This reflects the existence of a variety of alternative approaches (Fig. 2.3). Researchers usually choose the conceptual model that is best adapted to the depositional system they are studying, which naturally has led to a multitude of different definitions of the sequence stratigraphic units and surfaces.
2.3.1 SEQUENCE STRATIGRAPHIC UNITS
In general, a sequence stratigraphic framework may consist of three different types of stratigraphic units:
- sequences s.s.: “a succession of strata deposited during a full cycle of change in accommodation or sediment supply” (Catuneanu et al., 2009);
- parasequences: “an upward-shallowing succession of facies bounded by marine flooding surfaces” (Van Wagoner et al., 1988; 1990);
- systems tracts: “a linkage of contemporaneous depositional systems, forming the subdivision of a sequence” (Brown and Fisher, 1977).
The definition of these units is independent of temporal-spatial scales and each type of unit is defined by specific stratal stacking patterns and bounding surfaces.
38 In particular, the systems tracts are interpreted on the basis of stratal stacking patterns, position within the sequence, and types of bounding surface (Van Wagoner et al. 1987, 1988, 1990; Posamentier et al. 1988; Van Wagoner 1995; Posamentier and Allen 1999). A systems tract consists of a relatively conformable succession of genetically related strata bounded by conformable or unconformable sequence stratigraphic surfaces.
The system tracts are commonly interpreted to form during five specific phases of the relative sea-level cycle (Posamentier et al. 1988; Hunt and Tucker 1992; Posamentier and Allen 1999; Catuneanu 2006; Catuneanu et al. 2009) (Fig. 2.4):
1. Falling-Stage Systems Tract (FSST): includes all the regressional deposits that accumulated after the onset of a relative sea-level fall and before the start of the next relative sea-level rise. The FSST is the product of a forced regression and lies directly on the sequence boundary, capped by the overlying lowstand systems tract sediments.
2. Lowstand Systems Tract (LST): includes deposits that accumulate after the onset of relative a sea-level rise. This systems tract lies directly on the upper surface of the falling stage systems tract and is capped by the transgressive surface formed when the sediments onlap onto the shelf margin;
3. Transgressive systems tract (TST): comprises the deposits that accumulated from the onset of coastal transgression until the time of maximum transgression of the coast, just prior to the renewed regression of the HST. The TST lies directly on the transgressive surface (TS) formed when the sediments onlap the underlying LST and is overlain by the maximum flooding surface (MFS) formed when marine sediments reach their most landward position.
4. Highstand systems tract (HST): Comprises the progradational deposits that form when the sediment accumulation rates exceed the rate of increase in accommodation space. This HST constitutes the upper systems tract of a stratigraphic sequence, and lies directly on the maximum flooding surface (mfs) formed when marine sediments reached
39 their most landward position. This systems tract is capped by the subaerial unconformity (1999).
5. Regressive System Tract (RST): lies above a TST and is overlain by the initial transgressive surface of the overlying TST. The sediments of this systems tract include the HST, FSST and LST systems tracts defined above. The complete sequence is known as a Transgressive-Regressive (T-R) Sequence (Johnson and Murphy 1984; Embry and Johannessen 1992).
Fig. 2.4 - Nomenclature of systems tracts, and timing of sequence boundaries for the
various sequence stratigraphic approaches (modified from Catuneanu et al. 2010). Abbreviations: RSL – relative sea level; T – transgression; R – regression; FR – forced regression; LNR – lowstand normal regression; HNR – highstand normal regression; LST – lowstand systems tract; TST – transgressive systems tract; HST – highstand systems tract; FSST – falling-stage systems tract; RST – regressive
systems tract; T-R – transgressive-regressive; CC* – correlative conformity in the sense of Posamentier and Allen (1999); CC** – correlative conformity in the sense of Hunt and Tucker (1992); MFS – maximum flooding surface; MRS – maximum regressive surface. References for the proponents of the various sequence models are provided in Fig. 3 (Catuneanu et al., 2011).
40
2.3.2 SEQUENCE STRATIGRAPHIC SURFACES
Sequence stratigraphic surfaces mark the changes in stratal stacking pattern. They are surfaces that can serve as systems tract boundaries. Unconformable sequence stratigraphic surfaces typically have a physical expression and the main are: subaerial unconformity, correlative conformity, the maximum flooding surface, maximum regressive surface, transgressive ravinement surfaces and regressive surface of marine erosion.
The subaerial unconformity forms under subaerial conditions as a result of fluvial erosion or bypass, pedogenesis, wind degradation, or dissolution and karstification (Sloss et al., 1949). Subaerial unconformities may form during forced regression, during transgression accompanied by coastal erosion, during periods of negative fluvial accommodation or during relative sea-level fall exposing carbonate platforms and reefs to karstification (Posamentier et al., 1988; Leckie, 1994; Blum, 1994).
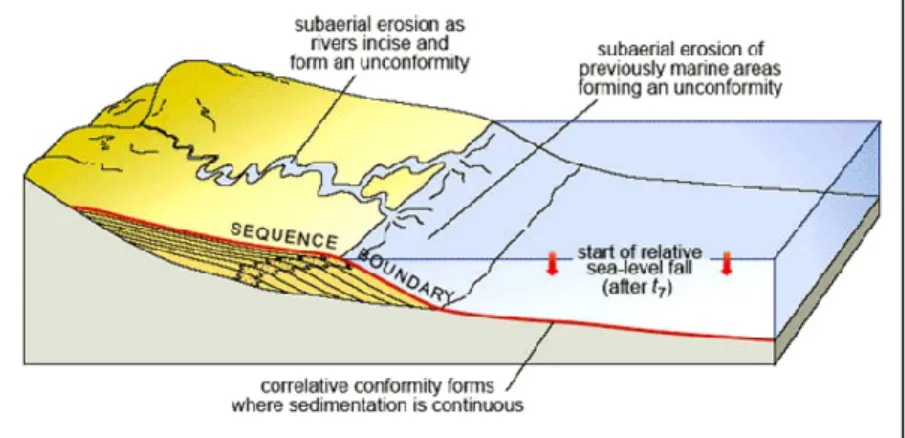
The correlative conformity is a marine stratigraphic surface that marks the change in stratal stacking patterns from highstand normal regression to forced regression. It is the paleo-seafloor at the onset of forced regression. An alternative term is basal surface of forced regression (Hunt and Tucker 1992) (Fig. 2.5).
Fig. 2.5 - Correlative conformity in the depositional context of the continental shelf
(Catuneanu, 2006).
The maximum flooding surface (Frazier 1974; Posamentier et al. 1988; Van Wagoner et al. 1988; Galloway 1989) is a stratigraphic surface that marks a change in stratal stacking patterns from transgression to highstand normal regression. It is the
41 paleo-seafloor at the end of transgression, and its correlative surface within the nonmarine setting (Fig. 2.6).
Fig. 2.6 – The Maximum Flooding Surface (MFS) marks the time of maximum flooding of the shelf and it separates the transgressive and highstand systems tract (Catuneanu, 2006).
The maximum regressive surface (Helland-Hansen and Martinsen, 1996) is a stratigraphic surface that marks a change in stratal stacking patterns from lowstand normal regression to transgression. It is the paleo-seafloor at the end of lowstand normal regression.
The transgressive ravinement surfaces (Nummedal and Swift, 1987) are erosional surfaces that form by means of wave scouring (wave-ravinement surfaces; Swift 1975) or tidal scouring (tidal-ravinement surfaces; Allen and Posamentier 1993) during transgression in coastal to shallow-water environments. An alternative term for either type of transgressive ravinement surface is the transgressive surface of erosion (Posamentier and Vail, 1988).
The regressive surface of marine erosion (Plint, 1988) is an erosional surface that forms typically by means of wave scouring during forced regression in wave dominated shallow-water settings due to the lowering of the wave base relative to the seafloor. The regressive surface of marine erosion is diachronous, younging basinward with the rate of shoreline regression. Alternative terms include: regressive ravinement surface (Galloway, 2001) and regressive wave ravinement (Galloway 2004) (Fig. 2.7).
42 Fig. 2.7 – Regressive surface of marine erosion is a subaqueous surface of marine erosion formed during a relative sea-level fall.
43
2.4 LATE MIOCENE TO QUATERNARY STRUCTURAL EVOLUTION OF THE
LAMPEDUSA ISLAND OFFSHORE
2.4.1 GEOLOGICAL SETTING
With a surface of 20 km2, Lampedusa is the largest island of the Pelagian Archipelago that also comprises the islands of Linosa and Lampione. It is located in the Sicily Channel, within the central Mediterranean Sea, about 210 km south of Sicily (Fig. 2.8). The island stretches for 11 km in E-W direction, with tabular morphology, and it reaches the maximum topographic elevation of 134 m a.s.l. in correspondence of Albero Sole Mt, in the northwestern sector. The island is characterized, in its southern and eastern parts, by low-lying coasts, with numerous bays and inlets coinciding with the mouth of valleys cutting the carbonate plateau. Conversely, the northern coast consists of sub-vertical cliffs, up to about 120 m high (Segre, 1960; Grasso and Pedley, 1985, 1988; Buccheri et al., 1999; Giraudi et al., 2004; Baldassini et al., 2015).
Lampedusa lies on the northern edge of the Tunisian continental shelf and represents a small emerged portion of the Pelagian Block (Grasso et al., 1986; Grasso et al., 1990; Burollet et al., 1978; Winnock, 1981; Giraudi, 2004). This last represents the foreland domain of the Apennine-Maghrebide fold and thrust belt (Colantoni, 1975; Boccaletti et al., 1984; Ben-Avraham & Grasso, 1990; Gardiner et al., 1995; Gamberi and Argnani, 1995; Tavarnelli et al., 2003; Finetti and Del Ben, 2005; Finetti et al. 2005), associated with the Mesozoic collision between African and European plates (Grasso et al., 1999) (Fig. 2.8).
44 Fig. 2.8 - Bathymetric (from NOAA: National Oceanic and Atmospheric Administration) and schematic structural map of the central Sicily Channel, with the front (black line) of the Maghrebian Thrust Belt (Colantoni, 1975; Boccaletti et al., 1984, Lipparini et al., 2009). Note the distribution of the WNW, NW and NS-trending normal faults (in red), bounding the main grabens of the area (Pantelleria, Malta and Linosa) (Boccaletti et al., 1987; Cello, 1987; Dart et al., 1993; Catalano et al., 2009; Civile et al., 2015) and the Tunisian and Lampedusa plateaus (Torelli et al., 1995). PT: Pantelleria trough; MT: Malta trough; LT: Linosa trough.
The Sicily Channel is a complex geodynamic sector, where extensional tectonics interacts with the Africa-Europe convergence (Hollenstein et al., 2003; D’Agostino and Selvaggi, 2004; Serpelloni et al., 2007; Catalano et al., 2008). In the specific, the area has suffered two main rifting phases (Antonelli et al., 1988; Argnani, 1990), the youngest of which, occurring since late Miocene, has controlled the evolution of the sedimentary basin where the deposits characterizing the Lampedusa Island formed. During this rifting event, the extensional activity mainly develops through a set of WNW-ESE and NW-SE trending normal faults, dissecting a shallow-water continental shelf (Malta, Tunisia and Adventure plateaus), giving rise to a zone of stretched lithosphere between Sicily and
45 Tunisia (Reuther and Eisbacher, 1985; Grasso et al., 1990) reported as Sicily Channel Rift Zone (SCRZ) (e.g. Finetti et al., 1984; Boccaletti et al., 1987).
The SCRZ normal faults, associated to a dextral strike-slip regime (Boccaletti et al., 1984, 1987; Cello et al., 1985; Reuther and Eisbacher, 1985; Reuter et al., 1993) and dissected by transverse N-S oriented normal faults, bound three main troughs (Pantelleria, Linosa and Malta) (Cello, 1987; Dart et al., 1993; Boccaletti et al., 1987; Corti et al., 2006; Catalano et al.. 2009; Civile et al., 2010), interpreted as pull-apart basins (Boccaletti et al., 1984, 1987; Cello et al., 1985; Reuther and Eisbacher, 1985; Cavallaro et al., 2016).
As far as the Neogene to Quaternary structural evolution of the Lampedusa offshore concerns, Torelli et al. (1995) show that it was largely affected by extensional tectonics, which produced differential uplifted and subsided areas. The latter authors recognize in the Lampedusa High (Fig. 2.8), bounded by WNW-ESE and NW-SE trending extensional faults, the most prominent structural high of the Sicily Channel. In particular, the Lampedusa High is bounded, on its eastern part, by the NNW-SSE Cala Creta fault (Grasso and Pedley, 1985), which is interpreted as a late Miocene syn-sedimentary transtensional structure, locally connected with an oblique left lateral motion (Jongsma et al. 1985).
From a stratigraphic point of view, the Lampedusa Island shows similar features with respect to the Hyblean Plateau (Patacca et al., 1979; Grasso & Lentini, 1982; Dall’Antonia et al., 2001) and the Maltese islands (Baldassini & Di Stefano, 2015, 2017). In the specific it is made up of the Lampedusa Formation (Grasso and Pedley, 1985), a late Miocene (Tortonian to lower Messinian) neritic carbonate succession (Winnock, 1981) slightly tilted southwards, which is covered by lower Pleistocene calcarenite and upper Pleistocene sand deposits (Grasso & Pedley, 1985, 1988). The Lampedusa Formation includes three distinct members, which have been lithologically described and chronostratigraphically framed by Grasso and Pedley (1985) (Fig. 2.9a): the oldest is the Cala Pisana Member (made up of coarse grained wackstones, packstones and grainstones, Tortonian in age), which crops out in the eastern and southern portions of the island and represents the pre-rift deposits (Grasso and Pedley, 1985, 1988); the intermediate is the Capo Grecale Member (made up of carbonate mudstone and
46 wackstones, late Tortonian in age), which outcrops in eastern, southwestern and in the central portions of Lampedusa, unconformably overlying the Cala Pisana Member, and represents the syn-rift deposits (Fig. 2.9b); the youngest is the Vallone della Forbice Member (made up of grey dolomite packstones to pure dolomite, early Messinian in age), which is the thickest member of the Lampedusa Formation and crops out in the central part of the island, representing the syn-rift succession. The latter formation is incised, during late Miocene, by a widespread erosional surface connected with the onset of the Messinian salinity crisis (Hsü et al., 1973, 1977; Rouchy and Caruso, 2006; Roveri et al., 2008, 2012).
Fig. 2.9a - Schematic geological map of the Lampedusa Island (modified after Grasso & Pedley, 1985); note the two main faults outcropping on-shore in Cala Creta and in Punta Muro Vecchio area. Fig. 2.9b - NE-SW stratigraphic section in the eastern sector of the Lampedusa Island (modified after Grasso and Pedley, 1985), showing the stratigraphic relationship between the late Miocene (pre- and syn-rift deposits) and Pleistocene post-rift deposits, with in evidence the main unconformities.
In this thesis, through the interpretation of high-resolution seismic profiles, recently (July 2015) acquired in the offshore of the Lampedusa Island, we aim at detailing the current structural evolution of the area and its regional significance.
47
2.4.2 DATA DESCRIPTION AND INTERPRETATION
In order to contribute to improving the knowledge concerning the geodynamic scenery of the Sicily Channel we present data from some of the new seismic profiles, which outline the Lampedusa offshore stratigraphic-structural setting. For greater clarity in description, the investigated area has been subdivided into three main sectors: northern, southern and eastern.
In all of the surveyed area, a common feature is represented by a laterally persistent horizon with an erosional character, associated to the Messinian erosional surface (“M-reflector”) and highlighted by an intense contrast of acoustic impedance and often truncating the underlying units. The M-reflector separates the late Miocene syn-rift members of the Lampedusa Formation from the Plio-Quaternary deposits. Only in the northeastern sector of the Lampedusa offshore, the M-reflector is cut by tectonic structures. The continuity and sub-parallel setting of the seismic unit above the M-reflector is the evidence of a regular post-Messinian sedimentation that in general healed previously formed topography of the seabed. The latter recognition emphasizes that the Plio-Quaternary units were affected by an early Pliocene extensional tectonic phase only in the northern sector. The map in Fig. 2.10 shows the reconstruction of the tectonic setting of the Lampedusa Island offshore and the syn-rift depositional basins connected with the late Miocene-early Pliocene rifting phase.
48 Fig. 2.10 - Schematic geological map of the Lampedusa Island with location of the seismic grid of the single-channel Sparker seismic reflection lines interpreted in this study.
2.4.2.1 Northern sector
The North Para 1 (NP1) seismic profile is oriented in a W-E direction, running very close to the coastline (Fig. 2.11A). The western part of the profile (Fig. 2.11b) is dominated by a structural high (H1) bounded to the west by a near-vertical fault dipping westwards, and to the east by a similar structure dipping eastwards. The eastern fault lengthens along the continental shelf for at least 4 km in NW-SE direction, and probably represents the offshore continuation of a normal fault cropping out in the Punta Muro