DIPARTIMENTO DI SCIENZE AGRARIE E FORESTALI
Corso di Dottorato di Ricerca in BIOTECNOLOGIE VEGETALI
XXVIII Ciclo
Pectin methyl-esterases (PMEs) in wheat:
genome-wide characterization and their role in
wheat-Fusarium graminearum interaction
s.s.d. BIO/04
Tesi di dottorato di:
Dott. Alessandra Zega
Coordinatore del corso Tutore
Prof.ssa Stefania Masci Prof. Renato D’Ovidio
Firma ……….. Firma ………
AIMS AND STRUCTURE OF THE THESIS
The present thesis reports the results of the work carried out during my PhD project focused on the identification and characterization of the pectin methyl esterases (PMEs) gene family in wheat and the study of their involvement in wheat resistance against the Fusarium Head Blight (FHB) disease caused by the fungal pathogen Fusarium graminearum. The whole project has been conducted by following three different aims: 1) wheat PMEs in silico identification and structural analysis; 2) wheat PMEs functional characterization by analyzing their gene expression in different bread wheat tissues and following the infection with F. graminearum; 3) investigation of the role of PMEs in wheat-F. graminearum interaction by silencing specific PME genes.
The structure of the thesis is the following: an outline of the complete project (Abstract) and a general introduction (General introduction, pag. 2) about wheat and its genetics, the plant cell wall and enzymes related to its degradation and modification and, finally, a general introduction about PMEs. These parts precede two chapters about the obtained results. Chapter I (pag. 16) is addressed to the first and to the second aim and it includes a short specific introduction, a section regarding the experimental procedures, then the results and finally the discussion. Chapter II (pag. 47) is addressed to the third aim and its structure is as described for the previous chapter.
At the end (pag. 91), general conclusions are reported, highlighting the main results obtained during this work.
Results reported in the first chapter are included in the manuscript titled “Genome-wide characterization of pectin methyl esterase genes reveals members differentially expressed in tolerant and susceptible wheats in response to Fusarium graminearum” submitted to Plant Physiology and Biochemistry (March 25th 2016).
Abstract
Pectin methyl esterase (PME) genes code for enzymes that are involved in structural modifications of the plant cell wall, in plant development and they are also involved in plant-pathogen interaction. PME genes belong to a multigene family in plants, both in dicotyledonous and monocotyledonous species. So far there is a limited knowledge about PMEs in wheat, consequently in this work a genome-wide search was performed on the recently available wheat genome. Forty complete PME sequences and 4 incomplete sequences, 2 of which have been subsequently completed from the bread wheat cv. Bobwhite, were identified. Structural analysis revealed that exon-intron structure is conserved between homoeologous genes sharing a high sequence identity. Expression analysis of PME genes in different bread wheat tissues showed a diverse expression pattern in those tissues and developmental stages analyzed. Most of the members of this gene family underwent a down-regulation following the opening of the florets to perform infection with Fusarium graminearum by using the point inoculation method. Following infection, the expression behavior of specific PME genes was markedly different in the FHB-resistant wheat genotype Sumai3 in comparison to the susceptible cv. Bobwhite, being more strongly induced in the latter than in the former, thus suggesting a possible involvement of
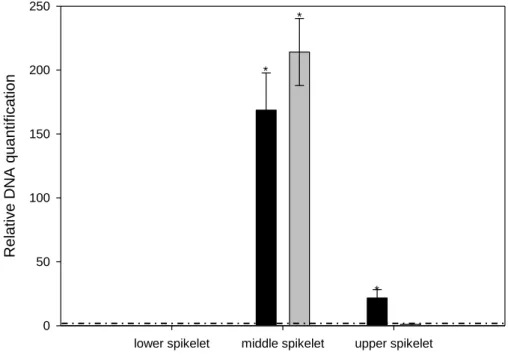
PME genes in FHB susceptibility. TRI6 gene of F. graminearum was used to quantify the
fungal biomass in three different portions of the spike: the central spikelets directly infected and the upper and lower spikelets respect to the central ones. These analysis showed the presence of the pathogens in the central and upper spikelets and its absence in the lower spikelets. The analysis of PME genes expression in the different parts of the spike showed that the presence of the pathogen in the upper spikelets is associated with an increase of the expression of specific
PMEs at 48 hour post infection (hpi). Conversely, in the lower spikelets a down-regulation of PME genes was observed, possibly as result of the stress generated by the opening of the central
spikelets for the infection. These preliminary analysis lead us to the identification of those
PMEs that could be involved in the susceptibility or resistance in wheat. In order to validate our
results and hypothesis, three selected PMEs (PME13, PME21 and PME28) were silenced through RNA interference. Two transgenic lines each silenced for PME13 or PME28 were subjected to a preliminary infection experiment with F. graminearum, but no significant differences were found between the transgenics and the control plants, except between AZ4-11 transgenic line and Svevo plants at 2 days post infection (DPI) .
Silenced PME genes were also searched by a TILLING approach, by screening a durum wheat TILLING population of 4000 plants available at the University of Tuscia. However, the screening of 1920 samples for mutations in the PME13 gene did not identify any silenced genotype. We screened also the recent available TILLING population database developed by the University of California, Davis. We found 28 mutated accessions for 12 different PME genes: STOP codons were found in 18 accessions and splicing sites mutations were found in the remaining 10 accessions.
In conclusion, this genome-wide study of wheat PMEs revealed structural and functional characteristics of this gene family and highlighted the possible involvement of specific PME in wheat-F. graminearum interaction. Silencing of PME13 and PME28 did not modify wheat resistance against F. graminearum in the preliminary infection experiment. However, the selected TILLING mutants for additional PME genes will represent the basis for further study to verify the involvement of PMEs in wheat-pathogen interaction.
Keywords
Triticum aestivum; Triticum durum; Cell wall; Pectin methyl esterase (PME); Wheat- F. graminearum interaction; Gene family; Gene expression; RNAi; TILLING; F. graminearum
Riassunto
Le pectin metil esterasi (PME) codificano enzimi coinvolti in molteplici funzioni, come modificazioni strutturali della parete cellulare, sviluppo della pianta, interazione pianta-patogeno. I geni PME appartengono ad una famiglia multigenica, sia in monocotiledoni che dicotiledoni. Data la mancanza di informazioni riguardo le PME in frumento, lo scopo di questo lavoro è stato quello di studiare e caratterizzare i geni appartenenti a questa famiglia genica utilizzando il recente database di sequenze del genoma di frumento. Sono state identificate 40 sequenze PME complete e 4 incomplete, 2 delle quali sono state sequenziate dalla cv. di frumento tenero Bobwhite. Le analisi strutturali rivelano che la struttura esoni-introni è conservata tra geni omeologhi con elevata identità di sequenza. Le analisi di espressione delle
PME in diversi tessuti di frumento tenero rivelano un differente pattern di espressione nei
tessuti e stadi di sviluppo analizzati. La maggior parte dei membri di questa famiglia genica mostra una repressione a seguito dell’apertura del fiore realizzata per effettuare l’infezione con
F. graminearum impiegando il metodo del “point inoculation”. A seguito dell’infezione, il
comportamento di specifici geni PME è differente tra la cv. resistente Sumai3 e la cv. suscettibile Bobwhite, essendo più fortemente indotti in quest’ultima rispetto alla prima, suggerendo così un possible coinvolgimento degli stessi nella suscettibilità al patogeno. Il gene
TRI6 di F. graminearum è stato impiegato per la quantificazione della biomassa fungina in tre
differenti porzioni della spiga: le spighette centrali direttamente inoculate e le spighette sopra e sotto il sito di infezione. Queste analisi hanno rilevato la presenza del patogeno nelle spighette centrali e superiori e la sua assenza in quelle inferiori. L’analisi di espressione dei geni PME nelle tre diverse porzioni della spiga ha mostrato che la presenza del patogeno nelle spighette superiori è associata a un aumento dei livelli di espressione di specifiche PME 48 ore dopo l’infezione. Al contrario, nelle spighette inferiori è stata osservata una repressione delle PME, probabilmente a causa dello stress dovuto all’apertura dei fiori delle spighette centrali. Queste analisi hanno permesso di identificare le PME potenzialmente coinvolte nella suscettibilità o resistenza. Per validare i risultati e le ipotesi, sono stati silenziati tre geni PME (PME13, PME21 e PME28) mediante “RNA interference”. Due linee transgeniche silenziate nel gene PME13 o
PME28 sono state sottoposte ad un esperimento preliminare di infezione con F. graminearum,
ma non sono state riscontrate differenze significative tra le linee transgeniche e quella controllo, ad eccezione della linea transgenica AZ4-11 e Svevo 2 giorni dopo l’infezione. Geni PME silenziati sono stati ricercati anche tramite approccio TILLING, analizzando una popolazione di 4000 piante disponibile presso l’Università della Tuscia. Tuttavia, l’analisi effettuata su 1920 individui per mutazioni nel gene PME13 non ha identificato nessuna mutazione. Quindi, si è proceduto con lo screening di una popolazione TILLING completamente sequenziata recentemente messa a disposizione dall’Università della California, Davis. In questo caso, sono state identificate 28 accessioni mutate per 12 differenti geni PME: 18 accessioni recanti mutazioni per codoni di STOP e 10 accessioni con mutazioni nei siti di splicing. In conclusione, questo studio di caratterizzazione dei geni PME in frumento ha rivelato caratteristiche strutturali e funzionali della famiglia genica, sottolineando un possibile coinvolgimento di specifiche PME nell’interazione frumento-F. graminearum. La verifica di questo possibile coinvolgimento tramite le piante silenziate nel gene PME13 o PME28 non ha evidenziato alcuna differenza con le piante controllo, almeno nel primo esperimento d’infezione. La selezione dei mutanti TILLING per altri geni PME offre la possibilità di indagare più estesamente il coinvolgimento delle PME nell’interazione del frumento con microrganismi patogeni.
Parole-chiave
Triticum aestivum; Triticum durum; Parete cellulare; Pectin methyl esterase (PME); Interazione
frumento- F. graminearum; Famiglia genica; Espressione genica; RNAi; TILLING; F.
Table of content
Abbreviations ... 1 Figures………...……….1 1. GENERAL INTRODUCTION ... 2 1.1 The wheat ... 2 1.2 Genetics of wheat ... 21.3 Plant cell wall: structure and functions ... 4
1.3.1 Cellulose and hemicelluloses ... 4
1.3.2 Pectins ... 5
1.4 Cell wall as target for plant cell wall degrading enzymes (CWDEs) ... 7
1.4.1 Cellulose and hemicelluloses-degrading enzymes ... 7
1.4.2 Pectin-degrading enzymes... 8
1.4.3 Role of CWDEs in plant pathogenesis ... 9
1.5 Pectin: an important component for plant defence ... 9
1.5.1 Homogalacturonan modifying enzymes (HGMEs) ... 10
1.6 PAEs and PMEs in plant defence ... 12
1.7 Fusarium graminearum ... 13
2. OBJECTIVES ... 15
CHAPTER I: Wheat PMEs in silico identification and structural analysis ... 16
Abstract ... 17
1. Introduction ... 18
2. Materials and methods ... 20
2.1 Plant material and growth conditions ... 20
2.2 Databases searches and sequences analysis ... 20
2.3 Tissue samples and plants infection ... 21
2.4 Real-time quantitative PCR (real-time qPCR) ... 22
3. Results ... 23
3.1 Members of the PME family are dispersed throughout the wheat genome ... 23
3.2 PME genes are differentially expressed in wheat tissues ... 28
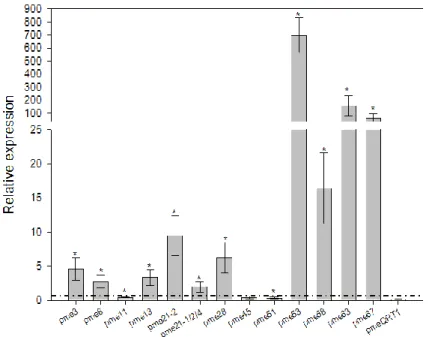
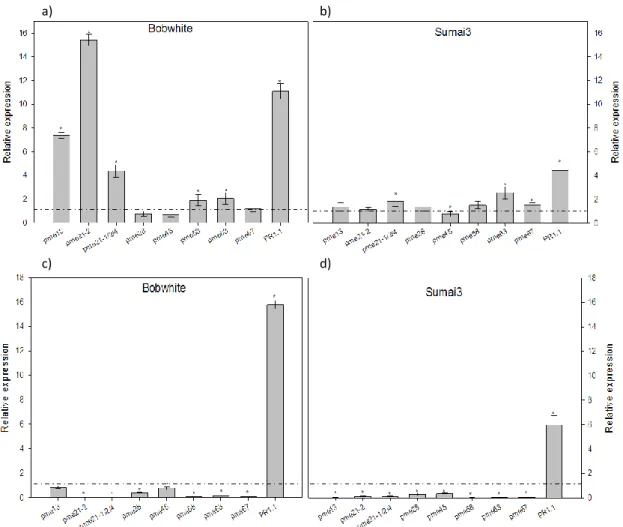
3.3 The susceptible cv. Bobwhite showed a slightly higher expression of TaPMEs as compared to the resistant cv. Sumai3 in flowering spikes ... 30
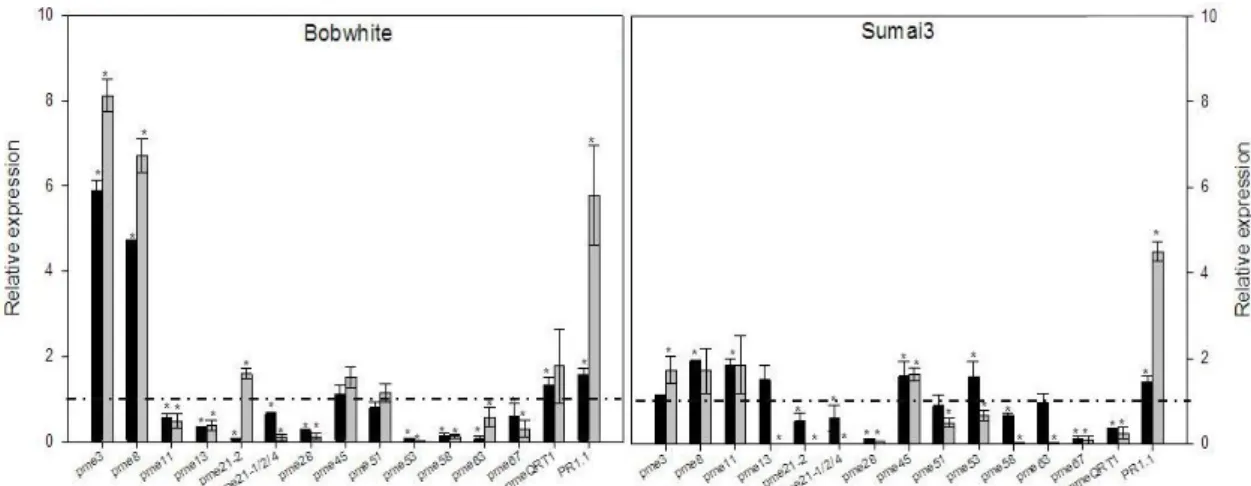
3.4 The opening of florets during point-inoculation of F. graminearum conidia causes changes in TaPME expression ... 30
3.5 Expression of TaPME genes differs in susceptible and resistance plants following F.
graminearum infection ... 31
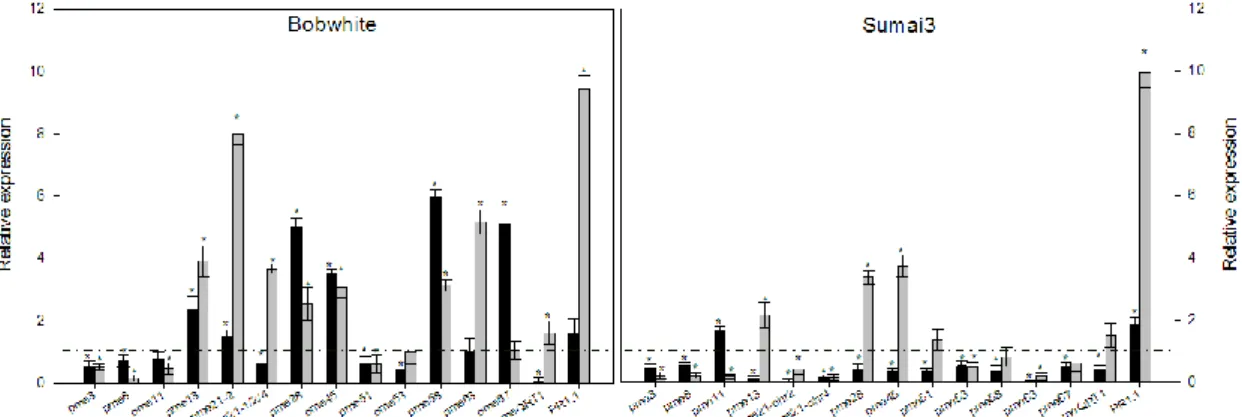
3.6 Some TaPME genes respond promptly to fungal progression ... 32
3.7 Progression of F. graminearum from the point-inoculated central spikelets ... 34
4. Discussion ... 35
5. Supplementary material ... 39
6. Figures and tables ... 45
CHAPTER II: Investigation of the role of PMEs in wheat-F. graminearuminteraction by silencing specific PME genes ... 47
1. Introduction ... 48
2. Material and methods ... 50
2.1 RNAi constructs ... 50
2.2 Preparation of heterologous expression vectors for PME genes ... 56
2.3 Microbiological techniques ... 59
2.3.1 Media and antibiotics ... 59
2.3.3 Transformation protocols ... 61
2.4 Selection of positive transformed colonies ... 61
2.5 Expression of recombinant PME proteins ... 62
2.5.1 SDS-PAGE ... 63
2.6 Transgenic wheat plants production ... 63
2.6.1 Media for wheat plants culture ... 63
2.6.2 Embryo isolation ... 64
2.6.3 Gold nanoparticles DNA coating, bombardment and plant regeneration ... 65
2.7 Screening of regenerated wheat plants ... 67
2.7.1 DNA extraction ... 67
2.7.2 Polymerase Chain Reaction (PCR) ... 67
2.7.4 RT-PCR analysis ... 69
2.7.5 qRT-PCR analysis in transgenic plants ... 69
2.8 Infection of transgenic plants ... 70
2.8.1 Fusarium graminearum culture ... 70
2.8.2 Plant growth ... 70
2.8.3 Point-inoculation infection method and symptoms detection ... 70
2.8.4 Statistical analysis of infection ... 70
2.9 Targeting Induced Local Lesions IN Genomes (TILLING) analysis ... 71
3.1 Production and characterization of transgenic wheat plants ... 74
3.2 Effect of the RNAi silencing of a specific PME gene on the expression of other PME genes ... 78
3.3 Infection of transgenic plants ... 79
3.4 Targeting Induced Local Lesions In Genomes (TILLING) analysis ... 81
3.5 Heterologous expression of PME recombinant proteins ... 82
4. DISCUSSION ... 84
5. Figures and tables ... 89
GENERAL CONCLUSIONS ... 91
1
Abbreviations
4)-α-D-GalpA-(1,2)-α-L-Rhap-(1: 4)-α-D-Galactopyranosyluronic acid-(1,2)-α-L-Rhamnopyranose-(1
β-D-Xylp: β-D-Xylopyranose β-D-Apif : β-D-Apiofuranose
β-D-Apif(1,3’)- β-D-Apif-(1: β-D-Apiofuranose (1,3’)-β-D-Apiofuranose-(1 IWGSC: International Wheat Genome Sequencing Consortium
CWDEs: cell wall degrading enzymes HG: homogalacturonan
GHs: glycoside hydrolases PGs: polygalacturonases PL: pectin lyases
PAEs: pectin acetyl esterase PMEs: pectin methyl esterases SP: signal peptide
TM: transmembrane domain
PMEI: pectin methyl esterase inhibitor DM: degree of methylesterification OGs: oligogalacturonides
CBP: cellulose binding protein FHB: Fusarium Head Blight DON: deoxyvalenol
QTL: quantitative trait loci RNAi: RNA interference PM: processing motif NT: nulli-tetrasomic
CDD: conserved domain database EST: expression sequence tags hpa: hours post anthesis
PR1.1: pathogen related 1.1 TRI6: trichothecene 6
DPI: days post infection
Figures
Figure 1. Production of wheat in 2013 (http://faostat3.fao.org/browse/Q/*/E). Figure 2. Genetic base of wheat.
Figure 3. Structure of the plant cell wall.
Figure 4. General structure of plant cell wall pectins.
Figure 5. The egg-box structure formed between the negative charges of the de-esterified carboxyl groups of galacturonic acids and the positive charged calcium ions. Figure 6. Schematic representation of a plant secondary cell wall, composed by cellulose, hemicelluloses and lignin polymer.
2
1. GENERAL INTRODUCTION 1.1 The wheat
Among crops wheat is the most worldwide cultivated plant (Fig. 1), being the third most produced cereal after maize and rice (FAOSTAT data, 2013). The centre of origin of wheat is supposed to be the Fertile Crescent after about 8000 BCE and then it spreads in other countries, like Turkey, Syria, Egypt and then Greece, India, Cyprus, Germany and Spain and finally wheat reached England and North Europe (Shewry, 2009).
Wheat is one of the most important protein source in human diet, having the higher protein content then other major cereals; besides it is an important source of carbohydrate, minerals and vitamins. This cereal is also commonly used in animal feed and in industrial processes, such as the production of paper additives or to make biodegradable plastics (Sarka et al., 2011).
Figure 1. Production of wheat in 2013 (http://faostat3.fao.org/browse/Q/*/E).
Nowadays wheat cultivars that are mostly cultivated belong to two species, Triticum turgidum (durum wheat) and Triticum aestivum (bread wheat) with the latter one grown on over 95% of the wheat growing area. Moreover, durum wheat is mainly involved in pasta making whereas bread wheat is mainly involved in bread making industry.
1.2 Genetics of wheat
Wheat belong to Graminaceae family, tribe Triticeae, genus Triticum.
From a genomic point of view, Triticum includes several species that can be divided according to the somatic chromosome number in diploid, tetraploid and hexaploid
3
wheats (Fig. 2). An example of diploid wheat is the domesticated wheat Triticum monococcum, with two sets of seven chromosomes (2n= 14) belonging to the so called genome A. Most tetraploid wheats nowadays cultivated (e.g. Triticum durum) are derived from the wild emmer Triticum dicoccoides (genome AABB). The wild emmer is itself the result of a hybridization between two diploid species, Triticum urartu (genome AA) and Aegilops speltoides (genome BB).
Either domesticated emmer or durum wheat (T. turgidum, genome AABB) hybridized with the wild diploid wheat Triticum tauschii (genome DD) to make the hexaploid wheat Triticum aestivum, with the AABBDD genome (Hancock, 2004).
Figure 2. Genetic base of wheat.
Bread wheat with its 21 chromosomes pairs (A, B and D genome) and durum wheat with its 14 chromosomes pairs (A and B genome), are allopolyploid but they behave as diploids because of Ph gene prevents homeologous gene pairing (Martinez-Perez et al., 2001).
In 2005 was established the International Wheat Genome Sequencing Consortium (IWGSC), a collaborative consortium formed by 1100 members from 55 countries with the aim to create an high quality wheat genome sequencing database, accelerating wheat breeding and improving all aspects of wheat science. IWGSC is working on bread wheat 21 chromosomes pairs sequencing and physical maps developing. The first milestone was reached on July 2014 with the publication of the chromosome-based
4
draft sequence in the journal Science (The International Wheat Genome Sequencing Consortium, 2014).
1.3 Plant cell wall: structure and functions
The plant cell wall is a sophisticated and complicated structure that is involved in the determination of cells size and shape, plant growth and development, intercellular communication and interaction with the environment, as it is a barrier between the plant and the “outside world”. Plant cell wall is formed by diverse elements, such as proteins, cellulose, hemicelluloses and pectins organized into a complex network (Fig. 3).
There are two type of cell wall that are called primary and secondary cell wall. The primary cell wall, a complex and dynamic structure, is generally a thin, flexible and extensible layer formed during cell growth and it is composed by structural proteins, enzymes and largely by polysaccharides as cellulose, hemicellulloses and pectins.
Figure 3. Structure of the plant cell wall.
1.3.1 Cellulose and hemicelluloses
Cellulose is an organic compound, a polysaccharide consisting of a linear chain of β (1→4) linked D-glucose units. Cellulose microfibrils are connected to hemicelluloses component via hydrogen bonds and most wall models identify this interaction as one of the main features of cell wall architecture.
Hemicelluloses are branched polysaccharides structurally similar to cellulose because they have a backbone composed of 1,4-linked β-D-hexosyl residues. The predominant hemicellulose in many primary walls is xyloglucan. Other hemicelluloses found in primary and secondary walls include glucuronoxylan, arabinoxylan, glucomannan, and galactomannan.
5
1.3.2 Pectins
The cellulose/hemicellulose network is embedded in a jelly-like matrix of pectins, that are the most complex class of cell wall polysaccharides (Fig. 4). Pectins are mostly found in the primary cell wall and in the middle lamella, being particularly abundant in the non-woody plant tissues. The amount, the structure and the chemical composition of pectins differ from plant to plant and, within the same plant, from tissue to tissue; they occupy about 35% of dicotyledonous cell wall and only about 5% of grasses cell wall (Mohnen, 2008). Pectins are important for plant growth and development, cell adhesion and extension, cellular structure integrity and also for the mediation of defence responses (Caffal and Mohnen, 2009).
Figure 4. General structure of plant cell wall pectins.
Pectins are polysaccharide rich in galacturonic acid units linked together via α (1→4) bounds. So far four classes of pectic components have been characterized:
Rhamnogalacturonans
Rhamnogalacturonans (RGs) are a group of polysaccharides that, depending on the repeated unit of the backbone, could be divided into rhamnogalacturonans type I and type II:
o RGsI contain a backbone of the repeating disaccharide 4)-α-D-GalpA-(1,2)-α- L-Rhap-(1 from which branch off various neutral sugars, mainly D-galactose, L-arabinose or D-xylose, depending on the origin of pectin.
o RGsII are less frequent, but they are a complex and an highly branched polysaccharides, where the backbone is made exclusively of at least 8 D- galacturonic acid units; for this reason are sometimes classified within the
6
group of substituted galacturonan. Xylogalacturonans
Xylogalacturonan have β-D-Xylp residues attached to C-3 of the galacturonan backbone; these polysaccharides are only present in reproductive tissues and they could prevent pathogen degrading enzymes (Jensen et al., 2008).
Apiogalacturonans
Apiogalacturonans are present in the cell wall of some aquatic monocot plants. The backbone is substituted with β-D-Apif and β-D-Apif(1,3’)- β-D-Apif-(1.
Homogalacturonans
Homogalacturonans (HGs) are the most abundant polysaccharides within pectin, representing up to the 65% of the plant cell wall (Mohen, 2008). HGs are composed by 1,4-linked α-D-galacturonic acid residues, in which some of the carboxyl groups are methylesterified or acetylesterified. Together with other cell wall polysaccharides, HGs are involved in plant growth and development. Homogalacturonans are synthesized in an highly methylesterified form in the cis Golgi, exported into the cell wall, and de-methylesterified in muro by the action of enzymes called pectin methylesterase (PME; EC3.1.1.11), releasing acidic pectins and methanol.
Around 80% of carboxyl groups of galacturonic acid are esterified with methanol and, depending on the degree of de-esterification, pectins are classified in high- or low-pectins (HM or LM low-pectins) with more or less than half of all the galacturonic acids esterified, respectively. In LM pectins ionic bridges are formed between calcium ions and the ionised carboxyl groups of the galacturonic acid, forming the so called egg-box structure (Fig. 5) (Grant et al., 1973).
Figure 5. The egg-box structure formed between the negative charges of the de-esterified carboxyl groups of galacturonic acids and the positive charged calcium ions.
7
Unlike the primary cell wall, the secondary cell wall is not present in all type of cells. The secondary cell wall is a layer between the primary cell wall and the plasma membrane and is formed when primary wall is completely assembled and the cell ends to expand, giving it rigidity and an additional protection. As primary cell wall, also the secondary cell wall is formed by cellulose and hemicelluloses but pectins, structural proteins or enzymes are or may be absent; in the secondary plant cell wall is present the lignin, an heterogeneous organic polymer that is included into cellulose microfibrils, conferring an hydrophobic nature to plant tissues (Fig. 6).
Figure 6. Schematic representation of a plant secondary cell wall, composed by cellulose, hemicelluloses and lignin polymer.
1.4 Cell wall as target for plant cell wall degrading enzymes (CWDEs)
The cell wall degrading enzymes (CWDEs; Kubicek et al., 2014) play a significant role in the life cycle of a fungal pathogen as they are used to prove the assimilation of nutrients and to overcome the plant cell wall. In fact, the degradation of the plant cell wall components, as cellulose, hemicelluloses and pectins, is required for fungal pathogens to penetrate and proliferate within host cells. The complexity of the plant cell wall is reflected by the high number of CWDEs secreted by pathogens, generally referred as glycoside hydrolases (GHs; http://www.afmb.cnrs-mrs.fr/CAZY/; Henrissat, 1991), enzymes able to cleave hydrolytically glycosidic bonds in polysaccharides. GHs are distributed among diverse gene families genetically and structurally different.
1.4.1 Cellulose and hemicelluloses-degrading enzymes
The hydrolysis of cellulose generally involve the synergic action of two different enzymes, one of them that acts in a endo-acting way (endoglucanase) and the other one that acts in a exo-acting way (exoglucanase). The activity of these enzymes are followed
8
by the activity of a β-glucosidase that hydrolyze the cellodextrin oligomers to glucose. Cellulases are found in GH5, GH6, GH7, GH12 and GH45 families whereas β-glucosidases belong to GH1 and GH3 families.
Hemicelluloses is a term used to describe the non-cellulosic components of the plant cell wall, as xyloglucans, xylans and galactomannans. In their main chain are present different kind of linkage and sugars, but their side-chain substituents often comprise the same sugar and the same linkage and for this reason the same enzymes could be involved in the depolymerisation. Xyloglucan is breakdown by the activity of endo-β-1,4- glucanases, enzymes belonging to GH5, GH12, GH16 and GH44 families. Xylan are depolymerised by the activity of endo-1,4-β-xylanases (EC 3.2.1.8) that cleave the glycosidic bond in the xylan backbone. Most fungal xylanases are classified into the GH10 and GH11 families. In particular, GH10 xylanases are found in a very high number in plant pathogenic fungi and some fungi have also hydrolytic enzymes belong to GH30 family showing a xylanase activity. Galactomannans are degraded by enzymes comprising β-mannanase (EC 3.2.1.78) and β-mannosidase (EC 3.2.1.25) (Moreira and Filho, 2008). mannanase are found in GH5 and GH26 families, whereas β-mannosidase belong to GH1 and GH2 families.
1.4.2 Pectin-degrading enzymes
The degradation of pectin requires the action of different enzymes that act both in a hydrolytic way (polygalacturonases, PGs, EC 3.2.1.15 and 3.2.1.67) and in a non-hydrolytic way, via a β-elimination (pectin lyases, EC 4.2.2.10 and pectate lyases, EC 4.2.2.2).
PGs have an endo- and an exo-activity and they belong to the GH28 family. They are present in all fungal genomes but in a variable number (Zhao et al., 2013). GH28 family contain also rhamnogalacturonan hydrolases that cleave the α-1,2-glycosidic bond between D-galacturonic acid and L-rhamnose residues within the pectin backbone (van den Brink J. and de Vries, 2011). The polysaccharide lyases (PLs, EC 4.2.2.-) cleave uronic acid–containing polysaccharide chains via a β-elimination mechanism to generate an unsaturated hexenuronic acid residue and a new reducing end. PLs are classified into 21 families (Lombard et al., 2010).
The homogalacturonan backbone of pectin varies in its degree of methylation from a highly methyl esterified form to a fully demethylated form, which are consequently called pectine and pectate, respectively. Enzymes attacking these structures are termed pectin lyase and pectate lyase, respectively, with this latter having a calcium ion
9
dependent activity. Up to now, all the characterized pectin lyases are found in PL1 family, whereas fungal pectate lyases are found in PL1 and PL3 families.
1.4.3 Role of CWDEs in plant pathogenesis
CWDEs and enzymes that destroy physical barrier as cutin, are the first components that pathogens use to overcome the obstacle represented by the cell wall. CWDEs are key factors for several pathogens: for instance, the CUT2 cutinase produced by the rice and barley fungal pathogen Magnaporthe grisea, plays its role by sensing the leaf surface area and by leading to the correct differentiation, penetration and virulence (Skamnioti et al., 2007); in pea, the disruption of a cutinase coding gene in Fusarium solani f. sp. pisi decreases its virulence (Rogers et al., 1994). Xylan and pectin degradation is required as well, as demonstrated by Wu et al. (2006) for M. grisea. Polygalacturonanases are characterized to be crucial virulence factors in Botrytis cinerea, Claviceps purpurea and Aspergillus niger (ten Have et al., 1998; Oeser et al., 2002; Shieh et al., 1997).
Depending on their lifestyle, pathogens are traditionally divided into three classes: biotrophs, necrotrophs and hemibiotrophs, secreting a diverse range of CWDEs. Biotrophic pathogens need to maintain plant cells alive, in order to take advantage from them. Because of this, this class of plant pathogens generally secretes a relatively little amount of lysis enzymes (Mendgen and Hahn, 2002). Contrarily, necrotrophic organisms produce a large variety and amount of CWDEs targeting multiple sites on plant cell wall and causing extensive damages. In most cases a redundancy in degrading enzymes was found in necrotrophs (Idnurm and Howlett, 2001). For example, B. cinerea has at least six PGs that hydrolize the partially de-methylesterified homogalacturonan of pectin (Wubben et al., 1999). Hemibiotrophs behave as biotrophs in the early stage of their lifecycle and as necrotrophs in the later part of their growth, consequently the production of CWDEs is related to their developmental stage (Zhao et al., 2013).
1.5 Pectin: an important component for plant defence
The plant cell wall represent an effective physical barrier against pathogens entry and several studies indicated that its composition is of great importance to play this crucial
10
defensive role. For example, several works report that the degree and pattern of methylesterification is an important feature for host defence (Lionetti et al., 2012).
1.5.1 Homogalacturonan modifying enzymes (HGMEs)
Homogalacturonan is one of the main component of pectin. It is a linear homopolymer of galacturonic acid residues and it can carry either acetyl groups at O2 or O3 (Gou et al., 2012) or be methyl esterified at the C6 carboxyl (Wolf et al., 2009). Acetylation and methylation are modifications carried out from enzymes named pectin acetylesterases (PAE; EC 3.1.1.6, CAZy class 12 of carbohydrate esterase) and pectin methylesterases (PME; EC 3.1.1.11, CAZy class 8 of carbohydrate esterase), respectively.
Pectin acetylesterases
Pectin acetylesterases belong to a gene family that counts a similar number of members both in dicotyledonous and in monocotyledonous plants, despite the different amount of pectins found between them. For example, 12, 10, 7 and 11 ORFs were annotated as putative PAEs in Arabidopsis thaliana, Populus trichocarpa, Brachypodium distachyon and Oryza sativa, japonica group, respectively (Cao, 2012; Geisler-Lee et al., 2006; Tyler et al., 2010; Davidson et al., 2012). The degree of acetylation vary between 0.25 and 10% (Gou et al., 2012) depending on the species. In addition to homogalacturonan other plant cell components could be O-acetylated, as rhamnogalacturonans, xylogalacturonans and glucoronoarabinoxylans, being present in a large amount in the grass cell wall and representing possible targets for PAEs activity (Vogel, 2008). The presence of acetyl groups could affect plant cell wall viscosity (Orfila et al., 2012) and impairs the formation of Ca2+ bonds between homogalacturonan chains (Turquois et al., 1999). Acetylation can also affect the degradation of homogalacturonan by some endo- or exo-polygalacturonases (Bonnin et al., 2003). PAEs enzymes have been found in plants (Williamson, 1991; Christensen et al., 1996), bacteria (Shevchik and Hugouvieux-Cotte-Pattat, 1997) and fungi (Kauppinen et al., 1995; Bonnin et al., 2008). Generally they act specifically on homogalacturonan and rhamnogalacrutonan-I and seem to be inactive against other classes of pectins. Moreover, PAEs activity is increased when the substrate has previously been demethylesterified (Williamson, 1991; Bordenave et al., 1995; Oosterveld et al., 2000), suggesting a synergistic effect between PAEs and PMEs in the formation or degradation of the egg-box within the cell wall. The 3D crystallographic structure of PAEs has not yet been resolved.
11
Pectin methylesterases
Pectin methylesterases belong to a gene family that counts a high number of members in dicotyledonous species such as A. thaliana and poplar (P. trichocarpa), with 66 and 88 sequences annotated as PMEs, respectively (Pelloux et al., 2007; Geisler-Lee et al., 2006). Conversely, grass species count a lower number of PME sequences: for example, B. distachyon has 35 sequences annotated as PMEs and rice (O. sativa japonica group) has 41 sequences annotated as PMEs (Pelloux et al., 2007; Wang et al., 2013). The lower number of PMEs in grasses is generally explained with the lower amount of pectin present in monocotyledonous in comparison to dicotyledonous. PMEs are synthesized in the endoplasmic reticulum and they act in muro; for this reason they must be secreted into to cell wall and to do that, enzymes should possess a signal peptide (SP) and/or a transmembrane domain (TM). Analysis of PMEs sequences in A. thaliana and O. sativa japonica group (Senechal et al., 2014) reveals that most sequences (53% and 46%, respectively) possess a signal peptide. Many sequences possess also a transmembrane domain (38% and 37%, respectively); only a minor part possess both a SP and a TM (3% and 7%, respectively). The 6% of Arabidopsis PMEs and the 10% of Oryza PMEs are classified as soluble isoforms as they possess neither a SP nor a TM domain. The functional role of the soluble isoforms is to be determined, even if a biochemical characterization of them suggest that they could act in defence mechanism against pathogens (Dedeurwaerder et al., 2009). Up to now, a 3D crystallographic structure for plant PMEs has been resolved only for carrot (Johansson et al., 2002) and tomato (D’Avino et al., 2003; Di Matteo et al., 2005), whereas the purification and the characterization of the activity was performed for tomato (Lee and McMillan, 1968), papaya (Fayyaz et al., 1994), apple (Castaldo et al., 2005), kiwi (Giovane et al., 1996), grapefruit and mandarin orange (Rillo et al., 1994).
PMEs activity is dependent on different factors, such as changes in pH (Catoire et al., 1998; Jolie et al., 2009; Dixit et al., 2013), cations concentration (Jolie et al., 2010), or the presence of free carboxyl groups near the active site. In fact, seems that PMEs are more active on a partially demethylesterified pectin (Fries et al., 2007). Another important factor is the presence of the pectin methylesterase inhibitors (PMEI; pfam04043), proteinaceous inhibitors that forms a 1:1 stoichiometric complex with PMEs (Di Matteo et al., 2005), implying the inhibition of PME activity by a non-covalent binding.
12
The mode of action of PMEs could be different. Three mechanisms have been described:
1- single-chain mechanism, where PMEs act by removing contiguous methylesters within a single homogalacturonan chain;
2- multiple-attack mechanism, where PMEs act by removing few methylesters within different homogalacturonan chains;
3- multiple-chain mechanism, where PMEs catalyses a number of reactions before dissociate from the substrate.
A linear PMEs activity lead to the formation of the egg-box structure that confers to the cell wall an increase strengthening, whereas a random PMEs activity lead to a cell wall loosening.
1.6 PAEs and PMEs in plant defence
Acetylation of the cell wall polysaccharides is involved in plant–pathogen interaction. In fact, it was demonstrated that in Arabidopsis and Brachypodium a lower acetylation degree is associated with an increased resistance against B. cinerea and Bipolaris sorokiniana (Pogorelko et al., 2013).
Methyl esterification (DM) is another important determinant in plant-pathogen interaction, as a higher DM has been associated with an increased resistance against different pathogenetic organisms in different plant species. In fact, it was demonstrated that a higher DM increased resistance to the bacteria Pectobacterium carotovorum in wild potato plants (McMillan et al., 1993) and in pme3 mutants of A. thaliana (Raiola et al., 2011). Arabidopsis pme mutants (ppme1, pme17, pme31, pme39, and pme44) with an increased DM are more resistant to Pseudomonas syringae pv. maculicola ES4326 (Pma ES4326) (Bethke et al., 2014). The over-expression of PMEI genes enhanced plant resistance both in dicotyledonous plants against B. cinerea (Lionetti et al., 2007) and in monocotyledonous plants against B. sorokiniana, Fusarium graminearum and C. purpurea (Volpi et al., 2011; 2013).
Conversely, it was demonstrated that an over-expression of a PME gene in strawberry plants (Fragaria vesca) increased the resistance against the fungal pathogen B. cinerea (Osorio et al., 2008). This result has been explained with the formation of specific oligogalacturonides (OGs) able to induce the plant defence response.
13
A PME also participate to Arabidopsis-nematode (Heterodera schachtii) interaction, by facilitating the parasitic organism through a direct contact with the cellulose binding protein (CBP) synthesized from Heterodera (Hewezi et al., 2008).
Not only the different DM, but also a random distribution rather than a blockwise distribution of methyl groups was associated with an increased resistance against Puccinia graminis in wheat plants (Whietölter et al., 2003). Also Bonnin et al. (2002) found that a blockwise distribution of methyl groups favoured PGs activity of Fusarium moniliforme.
Microarray data for PME genes expression in Arabidopsis are available at www.genevestigator.com (Lionetti et al., 2012) and they were collected from infection experiments performed with pathogens having different lifestyles. Results showed that each pathogens alter the expression profile of different PMEs, with a higher number of genes induced by hemibiotrophic and necrotrophic organisms than by biotrophs. Finally, PMEs could be correlated to an increased resistance both with a direct reinforcement of the cell wall and with an indirect role through the formation of eliciting OGs. In any case, PMEs are valid candidates as resistance factors.
1.7 Fusarium graminearum
One of the principal fungal disease in wheat is the Fusarium Head Blight (FHB) disease, caused by different Fusarium species, with F. graminearum being one of the most widespread causal agent of FHB (Parry et al., 1995). The first symptoms of FHB occur shortly after flowering, leading to the bleaching of spikelets around the infection site; in a short time bleached spikelets are visible throughout the whole spike. Later in the fungal progression, within the infected spikes black spherical structures became visible, being the sexual reproductive elements of the pathogen. Grains became rough and turn in colour from pink to brown. F. graminearum infection lead to a decreasing grains yield and quality (McMullen et al., 1997) mainly due to the production of mycotoxins, fungal molecules harmful for human and animal health. The major mycotoxin produced by F. graminearum is the deoxynivalenol (DON), also called vomitoxin because of its effects on the digestive apparatus.
Generally two different types of FHB resistance are indicated: type I resistance, that is the resistance against the initial entry of the pathogen and type II resistance, that is the resistance against the spread of the pathogen within plant tissues (Schroeder and
14
Christensen, 1963). Type II resistance is better studied and employed because is controlled by resistance genes. Molecular mapping of quantitative trait loci (QTL) conferring partial resistance has been largely reported and allowed to identify a high numbers of QTLs (Buerstmayr et al., 2009). Between all of them, the two most effective QTLs are Fusarium head blight 1 (Fhb1) and Qfhs.ifa, located on 3BS and 5A chromosomes, respectively (Anderson et al., 2001; Buerstmayr et al., 2002; 2003). For the first time these QTLs were identified in Chinese Spring cv. Sumai3, becoming the most used source of FHB resistance. Fhb1 confers type II resistance, whereas Qfhs.ifa confers both type I and type II resistance, albeit a less extent.
The genetic determinants are still unknown, even if significant efforts were conducted in order to isolate Fhb1 and Qfhs.ifa genes (Liu et al., 2006; 2008). Several studies have been conducted, trying to reveal the relationship existing between the presence of Fhb1 QTL and F. graminearum resistance. For instance, Zhuang et al. (2013) identified one gene named WFhb1_c1 that was both functionally associated with and physically located within Fhb1 and it was found to be weakly similar to an Arabidopsis gene encoding a PMEI. Expression analysis conducted on WFhb1_c1 gene revealed that a lower expression level of this gene was associated with more severe disease. They also found the down-regulation of the expression of the pectin methylesterase inhibitor gene in Sumai3 plants lacking Fhb1 and they associated this evidence with the QTL. Lionetti et al. (2015) concentrated their studies on PME genes localized on the short arm of chromosome group 2 in the same bin position of the major FHB QTLs, thus suggesting a possible involvement of these PMEs in F. graminearum resistance. They found a down-regulation of PMEs in resistant cultivar compare to the up-regulation observed in the susceptible one.
15
2. OBJECTIVES
The aim of this present work was to identify and characterize the wheat (Triticum aestivum) PME gene family and to evaluate their involvement in wheat resistance against F. graminearum.
We have pursed this objectives by searching the wheat genome and by evaluating the expression behaviour of PME genes in different bread wheat tissues and following F. graminearum infection in a susceptible and a tolerant bread wheat cultivar.
We attempted also to verify in planta by RNAi and TILLING the role of specific PMEs in wheat resistance against F. graminearum.
16
CHAPTER I
Wheat PMEs in silico identification and structural analysisThe results presented in this chapter has been submitted to Plant Physiology and Biochemistry.
17
Abstract
Pectin methyl esterase (PME) genes code for enzymes that are involved in structural modifications of the plant cell wall during plant growth and development. They are also involved in plant-pathogen interaction. PME genes belong to a multigene family and in this study we report the first comprehensive analysis of the PME gene family in bread wheat (Triticum aestivum L.). Like in other species, the members of the TaPME family are dispersed throughout the genome and their encoded products retain the typical structural features of PMEs. qRT-PCR analysis showed variation in the expression pattern of TaPME genes in different tissues and revealed that these genes are mainly expressed in flowering spikes. In our attempt to identify putative TaPME genes involved in wheat defense, we revealed a strong variation in the expression of the TaPME following Fusarium graminearum infection, the causal agent of Fusarium head blight (FHB). Particularly interesting was the finding that the expression profile of some PME genes was markedly different between the FHB-resistant wheat cultivar Sumai3 and the FHB-susceptible cultivar Bobwhite, suggesting a possible involvement of these PME genes in FHB resistance. Moreover, the expression analysis of the TaPME genes during F. graminearum progression within the spike revealed those genes that responded more promptly to pathogen invasion.
Keywords: Triticum aestivum; Cell wall; Pectin methyl esterase (PME); Wheat-pathogen interactions; Gene family; Gene expression
18
1. Introduction
The plant cell wall represents a main barrier to the entry of the pathogens and its reinforcement can limit the colonization of host tissue (Cantu et al., 2008). The primary plant cell wall is a complex and dynamic structure composed mainly by the polysaccharides cellulose, hemicelluloses and pectins. Pectins are complex polysaccharides (Mohnen, 2008) represented mainly by homogalacturonan (HG), synthesized in a highly methyl esterified form in the Golgi apparatus and de-methylesterified in muro by pectin methyl esterases (PME; EC3.1.1.11). PME belong to the class 8 of the carbohydrate esterase (CAZY: http://www.afmb.cnrs-mrs.fr/CAZY/; Coutinho et al., 2003) and catalyse the de-methylesterification of the C6 linked methyl ester group of HG. As result of PME activity the distribution of free carboxyl groups on HG can be contiguous (or blockwise) or non-contiguous (or random) (Willats et al., 2001). The presence of consecutive negative charges on carboxyl groups can favor the interaction with Ca2+ ions forming the so called egg-box (Grant et al., 1973) that contribute to cell wall strengthening.
PME can be divided into two groups: group 1 (or type II) and group 2 (or type I) sharing a catalytic PME domain (pfam01095) at the C-terminus and in most cases a signal peptide (SP) and/or a transmembrane domain (TM) at the N-terminus that allows their secretion. PME belonging to group 2 possess also a domain (pro-region) at the N-terminal region that share a high similarity with pectin methyl esterase inhibitor (PMEI domain; pfam04043). The pro-region is removed by a subtilisin-like protease before secretion into the cell wall by acting on a processing motif (PM) that in most cases has the sequence RRLL or RKLL (Pelloux et al., 2007).
PME are encoded by gene families whose members are involved in various physiological processes, including hypocotyls elongation, fruit ripening and maturation, cellular adhesion and seed germination. PME activity and pectin methylesterification have been also related to plant defense (Pelloux et al., 2007).
Despite the limited amount of pectin in cereal cell wall (Vogel, 2008), PME activity and pectin methylesterification affects wheat resistance. In particular, wheat resistance to stem rust (Puccinia graminis f. sp. tritici) has been associated with a more random distribution of methyl ester in the homogalacturonans, whereas a more blockwise distribution of the methyl esters was associated with susceptibility (Wiethölter et al., 2003). A more direct evidence has been reported by analysing transgenic wheats expressing a kiwi pectin methyl esterase inhibitor (AcPMEI). These plants that
19
contained a reduced PME activity and an higher level of pectin methylesterification compared to non transgenic plants, were more resistant to the fungal pathogen Bipolaris sorokiniana and Fusarium graminearum (Volpi et al., 2003).
To further define the contribution of PME activity and pectin methylesterification in the wheat defence response, the aim of the present work was the characterization of the wheat (Triticum aestivum L.) PME gene family. In particular, we focus our attention on the expression profiles of the TaPME members in different wheat tissues and following F. graminearum infection, the causal agent of the worldwide devastating disease Fusarium Head Blight (FHB). For this latter aspect, we compared the expression pattern between a tolerant and a susceptible bread wheat cultivar at the inoculation point and during fungal progression within the spike.
20
2. Materials and methods
2.1 Plant material and growth conditions
Bread wheat cultivars Bobwhite and Sumai3, susceptible and resistant to FHB caused by Fusarium graminearum, respectively, were grown in a growth chamber at 18-23°C, 16-8h photoperiod and at a light intensity of 300 mE m-2 s-1.
2.2 Databases searches and sequences analysis
Brachypodium distachyon PME sequences were used as query sequences to perform blast searches against the International Wheat Genome Sequencing Consortium (IWGSC) database (https://urgi.versailles.inra.fr/blast/blast.php; The International Wheat Genome Sequencing Consortium, 2014).
The complete nucleotide sequence of TaPME13-5A or TaPME45-5A were obtained by PCR amplification from nulli-tetrasomic lines (NT) of T. aestivum cv. Chinese Spring. Primers were developed from the completed coding region of the homoeologous TaPME13-5D or TaPME45-5D and have the following sequences: (TaPME13-5A forward) 5′-CTTGTTGCAGCAGCAACAACAACAG-3′ and (TaPME13-5A reverse)
5′-ACCCGGCCGCTGCCCCCTCCCAT-3′; (TaPME45-5A forward)
5′-GCCGCGCATCGTTTGATTCGTTTCT-3′ and (TaPME45-5A reverse)
5′-GGCCATGGTGTCGATGATTATA-3′. PCR reactions were performed in a reaction volume of 50 l with 10 ng of genomic DNA, 2.5 U of FastStart High Fidelity PCR system (Roche Diagnostics, Monza, Italy), 1× Taq PCR buffer, 50 ng of each of the two primers, and 100 M each deoxyribonucleotide. Amplification conditions were: 1 cycle at 95°C for 2 min; 30 cycles at 95°C for 45 sec, 60°C for 45 sec, and 72°C for 2 min; 1 cycle at 72°C for 5 min.
Chromosomal assignment of TaPME genes were obtained from the International Wheat Genome Sequencing Consortium database.
Exonic and intronic regions were identified into wheat PME gene sequences using both GENSCAN tool (http://genes.mit.edu/GENSCAN.html; Burge and Karlin, 1997; Burge, 1998) and B. distachyon sequences as reference. The genomic sequences and the coding regions were used as inputs in the Gene Structure Display Server (GSDS) software (http://gsds.cbi.pku.edu.cn/; Hu et al., 2015) in order to generate the intron-exon structure of wheat PMEs.
21
Sequence analyses were performed using the DNAMAN software (Lynnon Biosoft, Quebec, Canada) that uses ClustalW algorithm for multiple sequence alignment (Thompson et al., 1994). The parameters for sequence alignment were a protein gap open penalty of 10 and a protein gap extension penalty of 5.
Deduced protein sequences were used to perform a blast research against the Conserved
Domain Database (CDD) of the NCBI database
(http://www.ncbi.nlm.nih.gov/Structure/cdd/wrpsb.cgi; Marchler-Bauer et al., 2015). SignalP (http://www.cbs.dtu.dk/services/SignalP/; Petersen et al., 2011) was used to search for signal peptides whereas WoLF PSORT (http://wolfpsort.org/; Horton et al., 2007) and Plant-mPLoc (http://www.csbio.sjtu.edu.cn/bioinf/plant-multi/; Chou and Shen, 2010) were employed in order to predicted the subcellular localizations of PME proteins.
In silico expression of TaPME genes was performed in the EST database at NCBI (http://www.ncbi.nlm.nih.gov/nucest/; Boquski et al., 1993).
2.3 Tissue samples and plants infection
Roots (Zadoks Z7), second leaf (Zadoks Z13) and flag leaf (Zadoks Z47) were collected from bread wheat cv. Bobwhite. Three samples for each tissues were collected, frozen in liquid nitrogen and stored at -80°C until use.
The infection experiments were performed by using the point inoculation method. Twenty µL of a suspension of F. graminearum conidia (25 conidia/µL) were injected into the two central opposite wheat flowering spikelets. Mock samples were inoculated with water. Infected and control spikelets were collected at 24 and 48 hours after inoculation (hpi). Two opposite spikelets below and upper the inoculation site (central opposite spikelets) were collected at 48 hpi.
After sampling, plant material was immediately frozen in liquid nitrogen and stored at -80°C until use. For each biological replicate, two inoculated spikelets per time point were collected and for each biological replicate, three technical replicates were conducted.
22
2.4 Real-time quantitative PCR (real-time qPCR)
Total RNA was extracted from plant material using RNeasy plant mini kit (Qiagen, Milan, Italy) and the first strand cDNA was obtained using QuantiTect Reverse Transcription kit (Qiagen). Specific primer pairs were developed for group of TaPME sequences sharing high sequence identity (at least 95%) (Table S1) and primer pairs specificity was verified both in silico with BLAST tool and by nucleotide sequence of PCR amplicons. qRT-PCR reactions were carried out in a reaction volume of 15 µL and included 7.5 µL of a 2x master mix (iQ SYBR Green Supermix, Bio-Rad Laboratories, Monza, Italy), 100 ng of cDNA, 0.5 µL (10 µM) of each forward and reverse primers and volume was adjusted with water. The Bio-Rad iCycler iQ instrument was employed. The PCR reaction conditions were: 1 cycle at 55°C for 2 min; 1 cycle at 95°C for 15 min; 40 cycles at 95°C for 30 sec, 60°C for 30 sec and 72°C for 30 sec; 1 cycle at 77°C for 2 min.
A primer pair specific for the homologs TaPr-1-1, TaPr-1-2 and TaPr-1-3 (herein named PR1.1) was included in the analysis as control of gene induction, whereas the actin gene was used as housekeeping gene (Moscetti et al., 2013). The Ct values of target genes and reference gene were used for further relative expression analysis by using the 2-∆∆Ct method (Livak and Schmittgen, 2001; Yuan et al., 2006). In each experiment two biological replicates and three technical replicates were performed. Quantification of F. graminearum biomass was performed by a qPCR analysis for the TRI6 gene by using the primer pair Tri6_10F and Tri6_4R (Horevaj et al., 2011). Infected spikelets at 48 hpi from both cultivars Bobwhite and Sumai3 were collected and used for total DNA extraction employing DNeasy plant mini kit (Qiagen) following the manufacturer’s instructions. qPCR was carried out by following the same conditions as previously described, using the actin gene as housekeeping gene. Relative DNA quantification was performed with the 2-∆∆Ct method (Livak and Schmittgen, 2001; Yuan et al., 2006) taking as reference sample the one with the lowest amount of fungal biomass. In each experiment two biological replicates and three technical replicates were conducted.
Student’s t-test and the analysis of variance (ANOVA) were used to obtain the statistical significance of the difference between samples and the reference sample.
23
3. Results
3.1 Members of the PME family are dispersed throughout the wheat genome Predicted wheat PME sequences were identified by searching the bread wheat genome at the IWGSC database, using B. distachyon PME sequences as queries. In total 40 complete and 4 partial wheat PME sequences were identified. These PME genes were named on the basis of the corresponding B. distachyon gene used for their identification. Moreover, to distinguish the homoeologous genes on the A, B and D genomes of bread wheat, the specific chromosomal assignment was included at the end of each name (e.g. TaPME53-4DS or TaPME53-4AL, where 4 specify the chromosome, D or A specify the genome and S or L specify the assignment to Short or Long chromosome arm, when available).
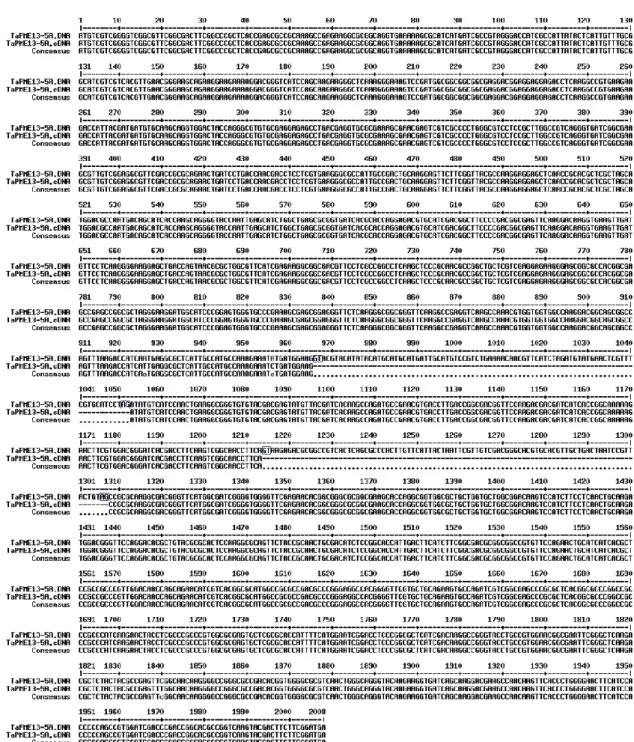
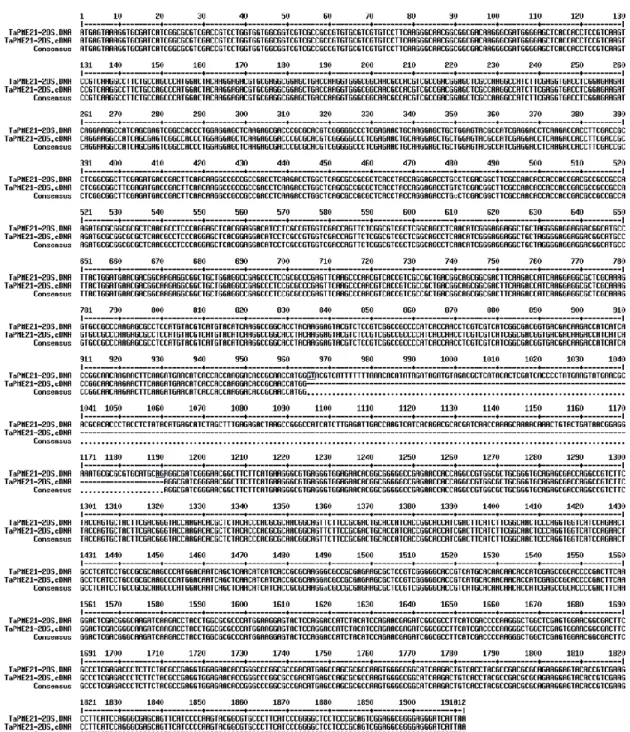
Two of the four partial sequences, that is TaPME13-5A and TaPME45-5A localized on chromosome 5A, were completed by using a strategy based on PCR amplification of genomic DNA of nulli-tetrasomic (NT) lines of T. aestivum cv. Chinese Spring. On the basis of the high sequence conservation between the A and D wheat genomes, we developed primer pairs from the completed coding region of the homoeologous TaPME13-5D or TaPME45-5D and we use them to amplify the genomic DNA of N5DT5B line of homoeologous group 5. We obtained a single amplicon from each PCR reaction and their nucleotide sequencing confirmed the identity with the two partial sequences deposited on the database, thus providing the complete sequence of TaPME13-5A and TaPME45-5A. The remaining two partial genes were TaPME58-2AL (1758 bp) and TaPME58-2DL (604 bp) homoeologous of TaPME58-2BL that was present as a complete gene in the database.
The 42 complete PME sequences were subjected to GENSCAN analysis to identify exons and introns composition. In general, group I PMEs showed an higher number of introns than PMEs of group II. In fact, most PMEs belonging to group I have three or four introns, whereas most PMEs belonging to group II have a single intron. However, five genes do not contain introns. Specifically, TaPME51-2AL, TaPME51-2BL and TaPME51-2DL of group I and TaPME21-1BS, TaPME21-4DL, TaPME21-4AS and TaPME21-2DL of group II. In general, coding regions sharing an high sequence identity shared also a similar exon-intron structure (Fig. 1).
The intron-exon distribution was confirmed experimentally for three PME genes, TaPME13-5A, TaPME21-2DS and TaPME28-2BL, by comparing their genomic and
24
corresponding cDNA full length sequences of the bread wheat cv. Sumai3 (Fig. S1, Fig. S2 and Fig. S3).
Among the predicted TaPMEs, 20 belong to group I, encoding only a PME domain and 24 to group II (including also the two incomplete PME genes), encoding both PMEI and PME domains. The length of the PMEI domains were in the range of 100-150 residues, whereas that of the PME domains were in the range of 200-460 residues. Only TaPME2.2-3B and TaPME21-1BS have a shorter PME domain of 50 and 80 residues, respectively (Table 1).
Further, we analyzed the structural features of the 42 complete TaPMEs deduced proteins (Tab. 1).
The pre-region or signal peptide was present in 28 TaPMEs, while in the remaining 14 PME sequences, indifferently whether belonging to PME group I or PME group II, no signal peptide was predicted (Tab. 1). Similarly, the transmembrane region was present only in 32 TaPMEs (Tab. 1).
Concerning the subcellular localization, PSORT predicted that the PME proteins are mainly localized outside the cell or in the plasma membrane. However, all PMEs were predicted in the cell wall by using Plant-mPLoc (Tab. 1).
Sequence analysis of all TaPMEs showed that the five conserved functional motifs of the PME domain (Markovic and Janecek, 2004) were present in 33 genes, whereas in the remaining 9 were missing between one and three motifs. Also the number of cysteine residues in the PMEI domain showed variation. Only 10 PMEs contained the four conserved cysteines, the remaining ones contained between 1 and 6 cysteines. These analysis showed also that most of the PMEs of group II contained the two basic motifs, BM1 and BM2, for the processing and the release of the PME domain from the pro-region. BM1 and BM2 showed the consensus RRLL and RKLL, respectively (Tab. 1).
25
Figure 1. Dendrogram (right) showing the amino acid sequence identity (%) between the wheat PME proteins. The exon-intron structure (left) was obtained using both GENSCAN and GSDS tools. The distinction between PMEs of group I or group II is also indicated.
group II
group I
group II
26 Table 1. Main features of TaPME protein.
TaPME Group Mature protein Subcellular localization
Binding motifs for cleveage Conserved motifs Protein (aa) PMEI (aa) PME (aa) sp tm PSort Plant mPLoc BM1 BM2 Position BM1-BM2 PMEI cys PME TaPME8-4AS I 420 327 - + pl, pe cw 5 TaPME8-4BL I 417 324 - + pl, er, pe, g cw 5 TaPME8-4DL I 354 260 - + ex, pe pl, cw 4 TaPME11-3AL I 339 291 + + ex, pe cw 3 TaPME11-3B I 335 257 + + ex, pe cw 3
TaPME31-1AL I 214 212 - - pe, cy,
ch cw 5
TaPME51-2AL I 461 311 + + ex, pe cw 4
TaPME51-2BL I 461 311 + + ex, pe cw 5
TaPME51-2DL I 447 303 + + ex, pe cw 5
TaPME53-2BS I 388 343 + + er, pe,
pl cw 5 TaPME53-4AL I 464 303 + + ex, v, pe cw 5 TaPME53-4BS I 476 298 + - ex, pe cw 4 TaPME53-4BL I 476 298 + - ex, v cw 4 TaPME53-4DS I 462 303 + - ex, v, pe cw 5 TaPME63-5BS I 413 309 + + ex, pe cw 5 TaPME63-5DS I 413 309 + + ex, pe cw 5 TaPME67-3AL I 368 344 + - ex, pe cw 2 TaPME67-3B I 343 318 + - ex, pe cw 3 TaPMEQRT1-2AS I 389 361 + + ex, pe cw 5 TaPMEQRT1-2BS I 364 335 + + ex, pe cw 5 TaPME2.2-3B II 442 51 298 - - n, pe cw RDVL RALL 98-118 1 5 TaPME3-2BS II 731 151 477 + + ex, n, pe cw RRLL 261 5 5 TaPME3-5BS II 734 152 461 + + ex, n cw RRLL 246 6 5 TaPME3-5DS II 643 109 464 - - cy, pe,
m cw RRLL 153 3 5 TaPME13-5A§,$ II 608 146 296 - + pl, ch, g, pe cw RRLL RRVL 247-279 5 5 TaPME13-5BL II 608 146 296 - + pl, ch, g, pe cw RRLL RRVL 247-279 5 5 TaPME13-5DL II 608 145 296 - + pl, ch, cw RRLL RRVL 247-279 5 5
27
SP: Signal peptide. TM: Transmembrane domain. Subcellular localization: ch: chloroplast; cw: cell wall; cy: cytosol; er: endoplasmic reticulum; ex: extracellular/cell wall; g: Golgi apparatus; m: mitochondria; n: nuclear; pl: plasma membrane; v: vacuolar membrane; pe: peroxisome. BM1-BM2: binding motif 1-binding motif 2 (RRLL-RKLL) for the pro-region removal and for releasing of the active protein. PMEI:cys: number of the conserved cysteins found in the PMEI domain. PME: number of the conserved motifs (GxYxE, QAVAL, QDTL, DFIFG, LGRPW) found in the PME domain. * indicates partial TaPME sequences. § indicates TaPME genes sequenced in this work. $, indicates TaPME genes whose intron-exon distribution was confirmed experimentally in this work.
g, pe TaPME21-1BS II 449 81 267 - - cy, pe cw RRLL RRLL 95-112 1 5 TaPME21-2AS II 562 152 298 + + pl, er, g cw RRLL RRLL 208-226 4 5 TaPME21-2BS II 560 152 298 + + pl, er, g cw RRLL RRLL 206-224 4 5 TaPME21-2DL$ II 560 145 298 + + pl, er, g cw RRLL 224 4 5 TaPME21-2DS II 561 152 298 + + pl, er, g cw RRLL RRLL 207-225 4 5 TaPME21-4AS II 567 150 300 + + pl, er, g cw RRLL RRLL 210-227 4 5 TaPME21-4DL II 588 150 319 + + pl, er, g, pe cw RRLL RRLL 210-227 4 5 TaPME28-2AL II 563 148 296 + + ex, v, pe, n cw RRLL RKLL 220-239 4 5 TaPME28-2BL$ II 563 148 296 + + ex, v, pe, n cw RRLL RKLL 220-239 4 5 TaPME28-2DL II 563 150 296 + + ex, v, pe, n cw RRLL RKLL 220-239 4 5 TaPME41-1AL II 556 106 297 + - ex cw RRMAL 224 3 5 TaPME45-5A§ II 606 152 296 - + pl, ch, g, er cw RRIL 277 5 4 TaPME45-5BL II 609 150 290 - + pl, ch, g, er cw RRIL 280 5 5 TaPME45-5DL II 601 153 295 - + pl, ch, g, er cw RRIL 272 5 5 TaPME58-2AL* II nd nd nd nd nd n cw RRKL RRLL nd nd 5 TaPME58-2BL II 1077 141 297 - + ex cw RRKL RRLL 734-752 4 5 TaPME58-2DL* II nd nd nd nd pe, cy cw nd nd nd nd 3
28
Amino acid sequence identity showed that the TaPME family clustered in two main groups, one containing only PMEs of group I and the other is composed of all PMEs of group II plus the homoeologous genes of TaPME51 belonging to group I (Fig. 1). Analysis of the sub-clusters clearly highlighted that the PME gene family underwent rearrangement into the hexaploid wheat genome. Indeed, except TaPME13, TaPME21-2, TaPME28, TaPME45, TaPME51 and TaPME58 having each homoeologous gene on corresponding chromosomal arm on the A, B and D genomes, all the other homoeologous genes of the family showed only a partial conservation of their chromosomal localization (Fig. 1). This resulted in the spreading of all PME sequences over the wheat genome except on homoeologous group 6 and 7 chromosomes.
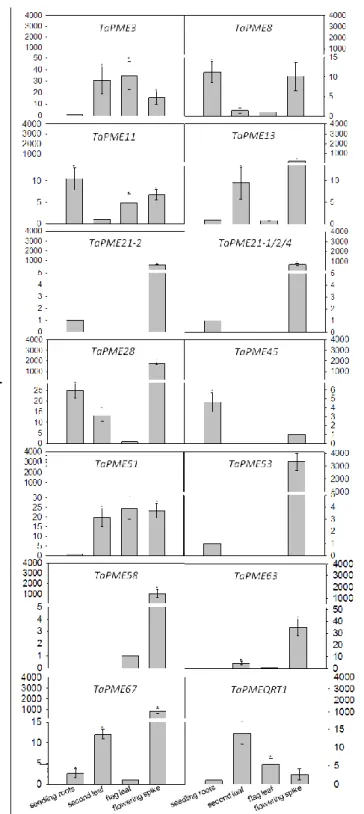
3.2 PME genes are differentially expressed in wheat tissues
In order to verify the expression level of the TaPME genes, we performed in silico searches of Expressed Sequence Tags (ESTs) at NCBI database. Only a limited number of ESTs corresponding to some PME genes were present and most of them were from the spike (Tab. S2). To obtain a more complete representation of PME gene expression, we performed a real-time quantitative retro-transcription PCR (qRT-PCR) on different tissues of the bread wheat cv. Bobwhite.
To simplify the qRT-PCR analysis, we developed primers pairs at conserved positions of TaPME genes sharing a nucleotide sequence identity higher than 95% in the coding region. In total, we developed 14 different primer pairs each amplifying a group of genes typically corresponding to the homoeologous genes (Tab. S1). We analysed the expression level in seedling roots, second leaf fully expanded, flag leaf and flowering spikes (Fig. 2). For each PME gene we identified the tissue where it was less expressed (i.e. higher Ct value) and we compared to it the expression level in the other tissues. In seedling roots all PME genes were expressed except TaPME58 and TaPME63. The lowest expression level in seedling roots was found for TaPME3, TaPME13, TaPME21-2, TaPME21-1/2/4, TaPME51, TaPME53 and TaPMEQRT1, whereas the remaining PME genes showed between 2 and 25 fold higher expression (Fig. 2). In the second leaf and in the flag leaf all genes were expressed except TaPME21, TaPME45, TaPME53 and TaPME58. In the second leaf, TaPME8 and TaPME11 showed the lowest level of expression, whereas the other PMEs were between 5 and 30 fold more expressed. In the flag leaf, TaPME8, TaPME13, TaPME28, TaPME58, TaPME63 and TaPME67 showed the lowest level of expression, whereas TaPME3, TaPME11 and TaPME51 were 35, 5