A
LMAM
ATERS
TUDIORUMU
NIVERSITÀ DEGLI STUDI DIB
OLOGNADEPARTMENT OF ELECTRICAL,ELECTRONIC AND INFORMATION ENGINEERING “GUGLIELMO MARCONI”-DEI
SCUOLA DI DOTTORATO IN BIOINGEGNERIA -CICLO XXV SETTORE CONCORSUALE:09/G2
SETTORE SCIENTIFICO DISCIPLINARE DI AFFERENZA: ING-INF/06
METHODS FOR THE
QUANTIFICATION OF MOTOR
STABILITY FOR THE
ASSESSMENT OF FALL RISK
Federico Riva
Supervisor Reviewers
Rita Stagni, Ph.D. Aurelio Cappozzo, Ph.D.
Co-Supervisor Harinderjit Gill, D.Phil. Luca Cristofolini, Ph.D.
Ph.D. Coordinator
Angelo Cappello, Ph.D.
iii
v
There are these two young fish swimming along, and they happen to meet an older fish swimming the other way, who nods at them and says, ‘Morning, boys, how's the water?’ And the two young fish swim on for a bit, and then eventually one of them looks over at the other and goes, ‘What the hell is water?’
[…]
The real value of a real education […] has almost nothing to do with knowledge, and everything to do with simple awareness. Awareness of what is so real and essential, so hidden in plain sight all around us, all the time, that we have to keep reminding ourselves over and over: ‘This is water. This is water.’
David Foster Wallace, commencement speech to a graduating class at Kenyon College, Ohio, May 21 2005.
vii
We are at the very beginning of time for the human race. It is not unreasonable that we grapple with problems. But there are tens of thousands of years in the future.
Our responsibility is to do what we can, learn what we can, improve the solutions, and pass them on.
ix
ABSTRACT
The research field of the Thesis is the evaluation of motor variability and the analysis of motor stability for the assessment of fall risk. Since many falls occur during walking, a better understanding of motor stability could lead to the definition of a reliable fall risk index aiming at measuring and assessing the risk of fall in the elderly, in the attempt to prevent traumatic events. Several motor variability and stability measures are proposed in the literature, but still a proper methodological characterization is lacking. Moreover, the relationship between many of these measures and fall history or fall risk is still unknown, or not completely clear.
The aim of this thesis is hence to: i) analyze the influence of experimental implementation parameters on variability/stability measures and understand how variations in these parameters affect the outputs; ii) assess the relationship between variability/stability measures and long- short-term fall history.
Several implementation issues have been addressed. Following the need for a methodological standardization of gait variability/stability measures, highlighted in particular for orbital stability analysis through a systematic review, general indications about implementation of orbital stability analysis have been showed, together with an analysis of the number of strides and the test-retest reliability of several variability/stability numbers. Indications about the influence of directional changes on measures have also been provided. Association between measures and long/short-term fall history has also been assessed. Of all the analyzed variability/stability measures, Multiscale entropy and Recurrence quantification analysis demonstrated particularly good results in terms of reliability, applicability and association with fall history. Therefore, these measures should be taken in consideration for the definition of a fall risk index.
xi
SUMMARY
I. Introduction ... 13
II. Orbital stability analysis in biomechanics: a systematic review of a nonlinear technique to detect instability of motor tasks ... 20
III. Influence of input parameters on dynamic orbital stability of walking: in-silico and experimental evaluation ... 39
IV. Reliability of stability and variability measures ... 51
V. Estimating fall risk with inertial sensors using gait stability measures that do not require step detection ... 57
VI. Are gait variability/stability measures influenced by directional changes? ... 65
VII. Stability of walking and long-short term fall-history ... 69
VIII. Conclusions ... 73
IX. Appendix ... 75
X. References ... 81
13
I. INTRODUCTION
I.1. FALLS IN THE ELDERLY
“A fall […] is an event which results in a person coming to rest unintentionally on the ground or lower level, not as a result of a major intrinsic event (such as a stroke) or
overwhelming hazard.” [1]
Considered to be one of the so-called geriatric giants, falls place a heavy economic burden on society, and are also responsible for a considerable loss of life quality. In 2009 alone, falls led to costs ranging between 0.85 and 1.5 per cent of the total healthcare expenses within the USA, Australia, EU and the UK [2]. Falls also have a critical influence on health status, with approximately 81-98% of hip fractures caused by falls [3,4], and are the leading cause of injury-related visits to emergency departments in the USA [5].
Risk of a falling increases with age [6,7]; falls are and the primary etiology of accidental deaths in persons over the age of 65 years. The mortality rate for falls increases dramatically with age, with falls accounting for 70 percent of accidental deaths in persons 75 years of age and older [5]. The main associated costs therefore tend to occur in higher age groups and in the wake of fractures, a problem that is further exacerbated by the increasing proportion of elderly among the population [8].
There are currently over 400 known risk factors for falls [9], classified into extrinsic (or environmental), intrinsic (or personal) and task-related factors [10,11]. Extrinsic factors comprise all external influences and might include factors such as poor lighting, surface elevation, surface roughness, obstacles, clothing/footwear, lack of equipment or aids, or external perturbations. Task-related factors include task complexity and speed, fatigue, load handling. Intrinsic factors reflect individual differences in, among others, age and gender, muscular strength, reaction time, visual impairment (e.g. glaucoma, macular degeneration, retinopathy), ethnicity, use of drugs and medications (e.g. polypharmacy, sedatives, cardiovascular medications), living alone, sedentary behavior, psychological status, impaired cognition (e.g. dementia), cardiovascular issues and foot problems. In addition, history of falls as well as impaired stability and mobility (e.g. as a result of stroke, parkinsonism, arthritic changes, neuropathy, neuromuscular disease or vestibular disease) can be considered as higher level factors owing to their interdependency with both intrinsic and extrinsic factors. While knowledge of the environment is known to play
14
a role in minimizing the effect of intrinsic and task-related factors on instability, extrinsic factors cannot generally be controlled, tested or accounted for in clinical assessment. Intrinsic factors have also been identified as major risk factors for falling. In particular, gait instability is considered to be a major fall risk factor, particularly in geriatric patients [12–14]; however, the quantification of gait stability is still an issue [8].
Several interventions to prevent falling (and associate injuries) have been proposed [15], but in order to correctly select individuals to which prescribe appropriate interventions, a reliable identification of individuals at risk of falling is needed [16]. Since many falls in the elderly occur during walking [17,18], assessment of gait stability represents a fundamental aspect.
I.2. ASSESSMENT OF GAIT STABILITY
The most established techniques to quantify fall risk are (i) motor function tests, (ii) questionnaires, and (iii) biomechanical laboratory-based measurements. However, since motor function tests and questionnaires are generally not capable of providing a quantitative predictive assessment of gait stability or fall risk [19,20], biomechanical laboratory-based measurements can help defining subject-specific methods with high sensitivity and specificity for gait stability assessment [8].
As said above, assessment of gait stability can allow the identification of subjects at risk of falling, being an important and necessary precondition for walking without falling. However, while stability is a well-defined concept in mechanics, there still is no complete consensus on how to measure stability of gait. Several methods are currently available, each one having advantages and disadvantages.
The term gait stability is comprehensive of both indirect as well as direct biomechanical aspects of stability during gait. These aspects can be measured and quantified, and hence could contribute to the definition of a subject-specific fall risk index. Indirect assessment of gait stability is represented by kinematic variability measures; when error corrections during a motor task become less effective, variability increases. It can therefore be assumed that variability is related to fall risk, because increased variability may bring the dynamic state of the person closer to the limit of stability [8]. On the other hand, direct stability measures not only provide information regarding the disturbances in the motor task performance, but also explicitly quantify the performance of the dynamic error correction. In addition, other stability-related measures have been recently associated with gait stability.
Mathematical details about indirect, direct and stability-related measures can be found in Chapter IX (Appendix).
I.2.1. Indirect assessment of gait stability
Kinematic variability measures represent the magnitude of variability of a certain kinematic parameter over strides during gait. One of the most established variability
15
measure is stride time variability, expressed in terms of Standard deviation (SD) or Coefficient of variation (CV) [17].
Somehow complementary measures of stride-to-stride variability are the Inconsistency of the variance of the stride time (IV) and the Nonstationary index (NI) [21], which measure the fluctuation dynamics of the stride time.
The Poincaré plot is a widely accepted method for the analysis of 2-D dynamic systems [22]; it has been extensively applied in the study of heart rate variability as a qualitative visualization tool, but can also be applied to other physiological signals (for example stride time). Stride time data plots between successive gait cycles show variability of stride time. Plots are used to extract indices, such as length (PSD2) and width (PSD1) of the long and the short axes describing the elliptical nature of the plots.
Whereas variability measures have been shown to be positively correlated with the probability of falling in the elderly [17,23], decreased variability has also been reported for mobility-impaired subjects, suggesting that these subjects are less stable due to a less flexible system [24,25]. Moreover, analyzing the effects of walking speed on stability and variability, no relationship between variability and the time needed to recover from a perturbation has been found, leading to the conclusion that locomotion variability measures may not be dependable indicators of locomotion stability [26] and are not able to quantify how the locomotor system responds to perturbations [27]. Hence, the relationship between gait variability and stability is not as straightforward as it may seem.
I.2.2. Direct assessment of gait stability
Human locomotion is, in all respects, a dynamical system. To test the stability of a dynamical system, several tools have been developed, since dynamical systems are often nonlinear and complex, and human locomotion definitely is. For this reason, some authors applied methods coming from stability analysis of nonlinear dynamic systems to biomechanics [8].
In theoretical mechanics, stability is defined by how the system state responds to perturbations [28]; similarly, an appropriate definition for the stability of a motor task should be based on the quantification of the tendency of a subject to recover from small (natural or artificial) perturbations occurring during the execution of a structurally cyclic task (e.g. gait [29]). However, in mechanics and robotics a state variable is deterministic and can predict the future state of the mechanical system: while the behaviour of walking robots under perturbation conditions can quite easily be predicted [30], dealing with biomechanical time series of human locomotion variables is not as straightforward as in robotics. In fact, when dealing with human locomotion the equations of the system are not known, and such nonlinear techniques have to be applied in a numerical (rather than analytical) fashion.
A motor task can hence be treated as a nonlinear dynamic system: biomechanical variables (e.g. joint angles, angular velocities or accelerations, marker positions, muscle
16
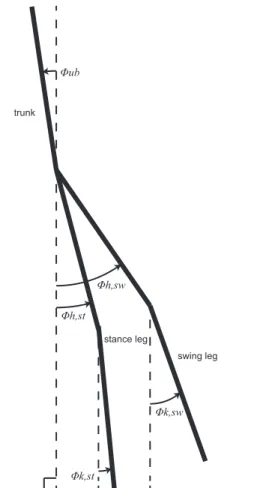
activations and others) vary during the temporal evolution of the task, defining a system that continuously changes over time. In a repetitive task, like walking, biomechanical variables have a cyclic behavior and recur iteratively with almost the same pattern; this pseudo-periodic behavior can be exploited for nonlinear analysis. For example, plotting the temporal evolution of knee angle against hip angle will design an orbit, which will vary dynamically in time but will maintain almost the same trend. In mechanical dynamics, the set of the variables that describe this orbit (two or more) is called state space, which can be defined as a vector space where the dynamical system can be defined at any point [31]. The number of task cycles (e.g. strides, commonly defined as the interval of time that starts at the heel strike of one foot and ends at the following heel strike of the same foot [32,33]) will determine how many times the variables will travel around the orbit. The locomotor pattern will force those variables to roughly travel around a fixed orbit, in a sort of limit cycle behavior. If a perturbation occurs during the motor task, the orbit will instantaneously move away from the limit cycle; in case of stability, the orbit will then tend back to the limit orbit, otherwise will diverge from it. For example, if a significant variation in knee angle occurs during walking (because of an obstacle), a coherent variation in hip angle will take place: simply observing the trend of one of these variables during the task could bring to misleading conclusions regarding stability, whereas embedding the two in the state space gives a more complete characterization of the system behavior. If a measure of only one of these time series is available, a proper way to obtain a characterization of the system is to embed in the state space the variable (e.g. knee angle) and its time-delayed copies; again, if an obstacle causes a sudden variation of knee angle, the orbits will reveal if the subject recovered stability after getting ahead of the obstacle, getting back to the limit cycle orbit after the destabilizing time event. Techniques of nonlinear stability analysis consist then in the quantification of the tendency of an orbit to diverge from or converge to the previous one or to an attracting limit cycle. Two main approaches for nonlinear stability analysis are present in literature: local and orbital stability analysis. These measures of orbital and local dynamic stability quantify different properties of system dynamics [34].
Local stability is used for systems that do not necessarily exhibit a discernable periodic structure, and therefore does not exploit the previously described pseudo-periodicity of some motor tasks. It is defined using short-term (sLE) and long-term (lLE) local divergence exponents (Lyapunov exponents). These indicators quantify how the system state responds to very small (local) perturbations continuously in real time [34]; many studies using this approach are present in literature [14,24,27,35–38]. Recently, an association between local stability and fall history have been found [39].
Orbital stability is defined for periodic systems with a limit cycle behavior, and can then be applied to cyclic motor tasks. This approach is extensively used in the study of passive dynamic walking robots [30], and in the last years it has been applied also to biomechanics [40]. Orbital stability analysis can be applied under the hypothesis of periodicity and assuming that motor dynamics (e.g. walking dynamics) are governed by central pattern generator processes yielding repetitive limit cycle behavior [41].
17
Fundamental indicators of orbital stability are Floquet multipliers (FM) which quantify, discretely from one cycle to the next, the tendency of the system state to return to the periodic limit cycle orbit after small perturbations [34]. If maximum Floquet Multipliers (maxFM) have magnitude < 1, perturbations tend to shrink by the next repetition, and the system remains stable. Every point on the orbit represents an instant of the task cycle. To calculate FM, a section must be defined in some point along the orbit (Poincaré section). In theory, the orbital stability of a deterministic limit cycle process should be the same, regardless of where along the trajectory the Poincaré section is made; however, human walking is not strictly periodic and people respond to perturbations differently during different phases of the gait cycle [34]. Hence, many authors put the Poincaré section in the most significant phases of the motor task (e.g., for gait, maximum sagittal knee flexion, toe off etc.) along the orbit, in order to obtain information about stability in the task phases that are more likely affected by perturbations. According to the literature, orbital stability analysis seems a promising approach for the definition of a reliable motor stability index; it can represent a novel way to predict risk of fall and to identify the most unstable phases of a motor task, in order to plan appropriate rehabilitation therapies. The most interesting feature of this method is the possibility to account for the whole task cycle dynamics, including more variables in the state space characterising the system. With a proper choice of Poincaré section, that is a proper choice of interesting instants during the task, the stability of every phase of the task cycle can be calculated. However, still the use of maxFM as a fall risk index is deemed to be controversial [8].
I.2.3. Stability-related measures
Other measures are present in literature that, whereas not representing a direct assessment of gait stability per se, are considered to be related with gait stability as they quantify strictly gait-correlated characteristics (such as smoothness, complexity, recurrence). Some measures, such as the Index of Harmonicity (IH) and Harmonic Ratio (HR), involve decomposing signals into harmonics by means of Discrete Fourier Transform and then analyze their spectral components [42,43], in order to obtain a measure of smoothness and rhythm of the gait pattern.
HR, derived from trunk acceleration signals and based on amplitudes in frequency spectra, is an indication of smoothness of acceleration patterns and provides information on how smoothly subjects control their trunk during walking and gives an indication of whole body balance and coordination [42,44].
Similarly to HR, IH assesses the contribution of the oscillating components to the observed coordination patterns by means of spectral analysis [43]. It quantifies the contribution of the stride frequency to the signal power relative to higher harmonics. Other methods that have been associated with gait stability are Multiscale Entropy (MSE) [45,46] and Recurrence Quantification Analysis (RQA) [47,48].
18
MSE quantifies the complexity or irregularity of a time series. Time series derived from complex systems, like biological systems, are likely to present structures on multiple spatio-temporal scales [45], and MSE has been introduced to this aim.
RQA is a nonlinear technique that has been applied recently to various biological time series, including walking [47]. Based on local recurrence of data points in the reconstructed phase space, it provides a characterization of a variety of features of a given time series, including a quantification of deterministic structure and non-stationarity [48].
I.3. AIM OF THE THESIS
In the last paragraph, several measures of gait variability and stability proposed in the literature have been illustrated; the aim of such measures is quantifying subject specific gait characteristics such as gait impairment, degree of neuromotor control and balance disorders, in both pathologic and healthy subjects.
However, still there is no methodological standardization on how to properly implement variability/stability analysis measures. These measures often come from the analysis of dynamical systems, and depend on many input parameters. The implementation in movement analysis is hence not straightforward, and a methodological standardization is needed in order to obtain reliable, repeatable and easily interpretable outcomes for a fall risk index definition.
Moreover, the relationship between many of these measures and fall history or fall risk is still unknown, or not completely clear. Loss of dynamic stability during gait may be caused by structural changes in gait patterns or by temporary modifications in balance control that could not be displayed while the subject is being tested. An assessment of the association between these measures and the two aforementioned conditions is hence needed, in order to define the capability of the measures to detect long- and short-term stability modification in relation to fall risk.
The aim of this thesis is hence to:
i) analyze the influence of experimental implementation parameters on variability/stability measures and understand how variations in these parameters affect the outputs;
ii) assess the relationship between variability/stability measures and long/short-term fall history.
19
OUTLINE OF THE THESIS
In Chapter II, a systematic review of orbital stability analysis in biomechanics [49] is presented, to provide an overview of the state of the art and of the questions raised by this relatively new approach. In Chapter III a model- and experimental-based study on the influence of the experimental input of orbital stability analysis is presented, with the aim to analyze the influence of experimental noise and of several implementation parameters on the outputs of orbital stability applied to human gait. Chapter IV is dedicated to the assessment of the number of required strides and the test-retest reliability of variability/stability measures proposed in the literature. In Chapter V an assessment of the association between fall history and several step detection independent nonlinear measures is presented. Chapter VI is dedicated to the influence of directional changes during gait on variability/stability measures. Chapter VII are dedicated to and the association between such measures with long/short-term fall risk. Finally, in Chapter VIII a general conclusion is drawn, and directions for future research are explored.
20
II. ORBITAL STABILITY ANALYSIS IN
BIOMECHANICS: A SYSTEMATIC REVIEW
OF A NONLINEAR TECHNIQUE TO DETECT
INSTABILITY OF MOTOR TASKS
1II.1. INTRODUCTION
The use of maxFM in the assessment of fall risk has been deemed controversial [8], because of some discrepancy and incoherence in the results found in the literature. A possible cause of this controversy could lie in the lack of a “standard” implementation of this technique, being the technique relatively novel in biomechanics. Considering the motor task as a dynamic nonlinear system, orbital stability analysis implies the definition of a state space characterising the system. No unique way of defining the state space of a given motor task (e.g. gait) has been shown in the literature; the most crucial point seems to be the choice of which and how many biomechanical variables (e.g. joint angles, trunk accelerations) have to be inserted into the space. Even the choice of the position of the Poincaré section represents a critical issue when trying to obtain reliable information about orbital stability of a motor task. Another criticality is represented by the minimum and optimum number of task cycles that should be included in the analysis to obtain reliable stability results.
With the aim to summarize the various applications of this approach in biomechanics and to analyse the solution proposed in the literature about the methodological issues stated above, in this paper a systematic review and a critical evaluation of the literature on the application of orbital stability analysis in biomechanics are provided, with particular focus to its application in gait analysis.
II.2. METHODS
II.2.1. Search strategy
In October 2011 an electronic search was performed by one reviewer to find all articles on the topic of orbital stability analysis in biomechanics. The databases included MEDLINE (1966 - October 2011), ISI Web of Knowledge (1986 - October 2011), and Scopus (2004 - October 2011). Keywords used in the search strategy included "orbital stability", "floquet", "biomechanics" and "movement". "And" and "Or" conjunction were
1 Published. Riva F, Bisi MC, Stagni R. Orbital stability analysis in biomechanics: A systematic review of a nonlinear technique to detect instability of motor tasks. Gait & Posture 2013; 37: 1–11.
21
used. Only English language article were considered. Some articles investigated other forms of stability in addition to orbital stability; only details from orbital stability analysis were considered. A manual, targeted search of reference lists of relevant studies and other publications from the authors of the electronically found articles was also performed.
II.2.2. Inclusion and exclusion criteria
A single reviewer assessed the titles and abstract of the articles. The articles included in the study satisfied the following criteria: i) investigation of gait, locomotor or functional tasks, ii) clear and documented purpose of the application of orbital stability analysis and iii) full scientific papers. Since this study focused on the application of orbital stability analysis to biomechanics, reports related to robotics were excluded. Studies published only as conference proceedings were excluded from the review.
II.2.3. Data extraction
A customised data extraction form was developed, based on previous systematic reviews on associated areas [50–53]. The data extraction themes were selected to give an exhaustive overview of each article for analysis and assessment of the quality of the scientific literature. Data extraction themes included the description of the sample, details of the experimental and analytical protocol and the key results of the study (Table II.1). Data were obtained independently by three reviewers. In order to compare results from different articles, 95% confidence intervals for each maxFM calculation in preferred/normal gait condition were extracted (when available).
22
Table II.1 – Data extraction results
Mo to r ta sk Tr ea dm il l w al ki ng Tr ea dm il l w al ki ng Tr ea dm il l w al ki ng Tr ea dm il l w al ki ng Ov er gr ou nd wa lk in g, tr ea dm ill w alk in g Ov er gr ou nd wa lk in g, tr ea dm ill w alk in g St at e sp ace defi ni ti on An gu la r po si ti on s an d ve lo ci ti es o n th e sag it tal p lan e of th e ri gh t an kl e, k nee an d hi p An gu la r po si ti on s an d ve lo ci ti es o n th e sag it tal p lan e of th e ri gh t an kl e, k nee an d hi p Fi rs t d er iv at iv es o f an te ri or p os te ri or , me di o la te ra l a nd v er ti ca l p os itio n tim e-ser ies of th e av er ag e m ov em en ts of th e th or ax m ar ke rs ( de la y r ec on str uc tio n o f in div id ua l s ta te s) Ti m e-nor m al iz ed 3D a cc el er at ion and 3D ro ta ti on al v el oc it ie s ti m e se ri es , e ac h w it h th eir s am ple d ela ye d c op ie s, c om in g f ro m th e in er tia l s en sor a nd the 3d st er eo ph ot og ram m et ry sy st em Tr un k ac ce le ra ti on d at a (A P, M L, V T) an d ri gh t l eg sag it tal p lan e jo in t an gl es (d el ay re co ns tru ct io n of in di vi du al s ta te s) 1: s agi tt al joi nt a ngl es of hi p, kne e and an kl e jo in ts of th e ri gh t l eg ; 2 : T 1 m ar ker mo ti ons in the A P , M L a nd V T di re ct ions (d el ay re co ns tru ct io n of in di vi du al s ta te s) Mo ti on a na ly si s 3d st er eophot ogr am m et ry 3d st er eophot ogr am m et ry 3d st er eophot ogr am m et ry 3d st er eophot ogr am m et ry, tr i-ax ial accel er om et er El ec tr og on io m et er s, tr i-ax ial accel er om et er El ec tr og on io m et er s, 3 d st er eo ph ot og ram m et ry Bo dy M as s In de x (B M I) 22. 1 22. 1 23 _ 22 30. 3 ± 4. 4 (N P ), 29. 4 ± 2. 2 (C O ), 23. 4±3. 5 (y ou ng ) Ag e 23. 8 ± 4. 5 23. 8 ± 4. 5 25. 5 ± 3. 6 _ 27. 1 ± 3. 2 61 ± 6. 6 (N P ), 57. 6 ± 7. 7 (C O ), 27. 9 ± 5. 1 (y ou ng ) Su bj ec ts 23 23 9 9 10 37 Ar ti cl e Ar el la no e t a l. Ar el la no e t a l. Br ui jn e t a l. Br ui jn e t a l. Di ng we ll a nd Ka ng Di ng we ll e t a l. Re f [5 4] [5 5] [5 6] [5 7] [3 4] [5 8]
23
Table II.1 – (Continued)
Mo to r ta sk Tr ea dm il l w al ki ng S aw task , l ift task Sa w in g-lik e ta sk Tr ea dm il l w al ki ng Cl on us in it ia te d in th e pl ant ar f le xor mu sc le s Ov er gr ou nd wa lk in g Ov er gr ou nd wa lk in g St at e sp ac e de fi ni ti on An te ri or -pos te ri or , m edi o-la te ra l a nd v er tic al ve loc it y of a m ar ke r at ta che d to the s ki n ove r C5 /T 1 (d el ay r ec on st ru ct io n of in di vi du al s ta te s) Th re e ro ta ti on al a ng le s an d an gu la r ve lo ci ti es f or each jo in t ( sh ou ld er , el bo w , w ri st ) Th re e ro ta ti on al a ng le s an d an gu la r ve lo ci ti es f or each jo in t ( sh ou ld er , el bo w , w ri st ) 3d pos it ion and ve loc it y of a p oi nt m id -wa y be tw ee n the A S IS a nd the loc at ion of the he el -ma rk er s (s ur ro ga te C oP r el at iv e to C oM ) An kl e po si ti on a nd a nk le v el oc it y Jo in t an gl es of an kl e, k nee an d hi p of th e dom ina nt s ide , a nd the ir ti m e-de ri va ti ve s Bi la te ra l r ot at io ns a nd v el oc it ie s at th e h ip , k ne e an d an kl e Mo ti on a na ly si s 3d st er eophot ogr am m et ry 3d st er eophot ogr am m et ry 3d st er eophot ogr am m et ry 3d st er eophot ogr am m et ry Pr ec is io n po te nt io m et er an d tach om et er El ec tr og on io m et er s El ec tr og on io m et er s Bo dy M as s In de x (B M I) 25 24 24 23 (young) , 2 6 (e ld erl y), 3 0 (f al l-pr one el der ly ) _ _ 25 (he al thy) , 24 (pol io su rv iv or s) Ag e 24. 5 ± 3. 4 25. 5 ± 2. 2 27. 9 ± 2. 2 26. 3 ± 2. 1 (young) , 71. 3 ± 6. 5 (e lde rl y) ; 71. 0 ± 3. 0 (f al l-pr one e lde rl y) 26 ± 4 28 (19 -49) 26 ± 4 (he al thy) , 52 ±10 (p ol io s urv iv ors ) Su bj ec ts 13 20 10 12 4 20 26 Ar ti cl e Di ng we ll e t a l. Ga te s & Di ng we ll Ga te s & Di ng we ll Gr an at a et a l. Hi dl er a nd Ry m er Hu rmu zl u an d Ba sd og an Hu rmu zl u et a l. Re f [5 9] [6 0] [6 1] [1 3] [6 2] [4 0] [6 3]
24
Table II.1 – (Continued)
Mo to r ta sk Tr ea dm il l w al ki ng Tr ea dm il l w al ki ng Tr ea dm il l w al ki ng Ov er gr ou nd wa lk in g Ov er gr ou nd wa lk in g Wa lk in g in a C A R E N sy st em St at e sp ac e de fi ni ti on SEM G s ig na ls f ro m 4 m us cl es o f th e le ft le g, an d th ei r ti m e-de ri va ti ve s Li ne ar v el oc it ie s an d ac ce le ra ti on s of th e th re e c oo rd in ate s o f a v ir tu al c en te r m ar ke r re pre se nt in g th e tru nk ; a ng ul ar ve lo ci ti es a nd accel er at io ns of th ree di m en si on al tr un k ro ta ti on s Li ne ar a nd a ng ul ar v el oc it ie s of a v ir tu al cen ter m ar ker , d efi ned as th e av er ag e lo cat io n of the m ar ke rs on ea ch se gm ent ( de la y re co ns tru ct io n of in di vi du al s ta te s) Ro ta ti on s of th e hi p jo in t, th e kn ee jo in t, th e an kl e jo in t an d th ei r co rr esp on di ng an gu lar ve loc it ie s on the s agi tt al pl ane Jo in t an gu lar d isp lacem en ts (co xo fem or al an gl e, fem or ot ib ial an gl e, tar sal an gl e) an d ve loc it ie s De la y emb ed di ng o f th e AP , M L a nd v er ti ca l ve loc it ie s of a C 7 ve rt ebr al m ar ker Mo ti on a na ly si s SEM G 3d st er eophot ogr am m et ry 3d st er eophot ogr am m et ry Vi de o-ba se d 2d m ot ion an al ysi s sy st em Vi de o-ba se d 2d m ot ion an al ysi s sy st em 3d st er eophot ogr am m et ry Bo dy M as s In de x (B M I) 23. 8 (young) , 25. 3 (e ld erl y) 23. 8 (young) , 25. 3 (e ld erl y) 23. 8 (young) , 25. 3 (e ld erl y) _ _ 24 Ag e 23. 3 ± 2. 6 (young) , 72. 1 ± 6. 0 (e lde rl y) 23. 3 ± 2. 6 (young) , 72. 1 ± 6. 0 (e lde rl y) 23. 3 ± 2. 6 (young) , 72. 1 ± 6. 0 (e lde rl y) 41464 _ 29 ± 7. 5 Su bj ec ts 35 35 35 6 5 12 Ar ti cl e Ka ng a nd Di ng we ll Ka ng a nd Di ng we ll Ka ng and Di ng we ll Ma rg hi tu a nd Ho ba th o Ma rg hi tu e t a l. Mc A nd re w e t a l. Re f [6 4] [6 5] [6 6] [6 7] [6 8] [6 9]
25
Table II.1 – (Continued)
Mo to r ta sk Tr ea dm il l w al ki ng Tr ea dm il l w al ki ng Tr ea dm il l w al ki ng Tr ea dm il l w al ki ng St at e sp ac e de fi ni ti on Jo in t an gl es an d vel oci ti es (an kl e, k nee, h ip ) An gu la r po si ti on s an d ve lo ci ti es o f th e ri gh t a nk le , kne e and hi p An gu la r po si ti on s an d ve lo ci ti es o f th e ri gh t a nk le , kne e and hi p Li ne ar a cc el er at io n an d an gu lar v el oci ti es of th e tr un k in a ll th re e d ir ec tio ns a nd th eir tim e-de la ye d copi es Mo ti on a na ly si s 3d st er eophot ogr am m et ry 3d st er eophot ogr am m et ry 3d st er eophot ogr am m et ry In ert ia l s en so rs Bo dy M as s In de x (B M I) _ 23 24 23 Ag e _ 22. 4 ± 2. 2 24. 6 ± 6. 5 23. 7 ± 2. 4 Su bj ec ts 10 10 10 12 Ar ti cl e Sc ha bl ow sk i a nd Ge rn er Sc ot t-Pa nd or f et al . Sc ot t-Pa nd or f et al . va n S choot en et al . Re f [7 0] [7 1] [7 2] [7 3]
26
II.2.4. Quality
Quality assessment was performed to limit bias, minimise errors and improve reliability of findings [74]. The quality of a study relates to aspects of the study's design, methods of sample recruitment, the execution of the tests, and the completeness of the study report. It is essential that the quality of the studies included in the review is assessed and reported, so that appropriately cautious inferences can be drawn [75]. Quality can be described as "the extent to which all aspects of a study’s design and conduct can be shown to protect against systematic bias, non-systematic bias, and inferential error" [76]. Some checklists which assist in the assessment of the quality of studies are present in literature [75,77], but no quality assessment tool existed for the evaluation of articles in this field. Therefore, a customised quality assessment tool was developed (Table II.2), based upon general systematic reviews principles and guidelines from other systematic reviews [50,51,77,78]. The tool consisted of 16 questions that concerned the major research purposes. A scoring system was developed to perform an overall evaluation of each article. Each question coming from the questionnaire was scored as follows: 2 = Yes; 1 = Limited detail; 0 = No. Three reviewers (FR, MCB and RS) scored each paper independently.
Table II.2 – Quality analysis form
Question
1. Is the aim of the study clearly described? 2. Is the design of the study clearly described? 3. Are participant characteristics adequately described? 4. Is sampling methodology appropriately described? 5. Is sample size used justified?
6. Are state space definitions accurately described? 7. Is the choice of the variables set justified? 8. Are equipment and setup clearly described? 9. Are motor tasks clearly defined?
10. Is the analytical technique clearly described? 11. Are appropriate statistical analysis methods used? 12. Are the main findings of the study clearly described? 13. Are key findings supported by the results?
14. Are limitations of the study clearly described? 15. Are key findings supported by other literature?
27
II.3. RESULTS
II.3.1. Search yield
The initial search of the databases, containing all the keywords, yielded 46 results. Eight more articles [13,54,60,63,64,67,71,72] were identified from the manual targeted search. After the application of the inclusion and exclusion criteria, 23 articles related to orbital stability analysis in biomechanics were selected for review. Details of reviewed articles are summarized in Table II.1 and Table II.5.
II.3.2. Quality
Table II.3 summarizes the quality of the reviewed articles. The overall quality of the articles was high, particularly in the areas of aim and design of the study, equipment and setup description, motor task description, reporting of main findings and the drawn conclusions. Participant characteristics were generally well reported, but in many cases information about body mass index (BMI) were not available. Methods for participant sampling were rarely reported. Many articles had limited details about the choice of the variable set and the analytical technique. Also, many articles had limited statistical analysis. Meta-analysis was not performed in this review.
Table II.3 – Quality analysis results. Each question coming from the questionnaire (Table II.2) was scored as follows: 2 = Yes; 1 = Limited detail; 0 = No. Three reviewers (FR, MCB and RS) scored each paper independently.
Ref Article Question number 1 2 3 4 5 6 7 8 9 10 11 12 13 14 15 16 [54] Arellano et al. 2 2 1,3 3 0,3 3 0,3 3 2 1,3 3 2 2 1,3 3 2 1,3 3 2 1,3 3 2 1,6 7 [55] Arellano et al. 2 2 2 1 0,6 7 2 1,3 3 2 2 1,3 3 2 1,6 7 2 2 1,3 3 1,3 3 [56] Bruijn et al. 1,3 3 2 1,3 3 1 0,6 7 2 1 2 2 1,3 3 1,3 3 2 1,3 3 2 1,6 7 2 [57] Bruijn et al. 2 1,3 3 1,3 3 0,3 3 0,3 3 1,6 7 1 2 2 1,6 7 2 2 2 1,3 3 1,3 3 1,3 3 [34] Dingwell and Kang 2 2 1,6
7 0,6 7 0,3 3 1,3 3 1,3 3 2 2 1,6 7 1,6 7 2 2 2 1,6 7 2 [58] Dingwell et al. 2 2 1 0,3 3 0,6 7 1,3 3 1,6 7 1,3 3 2 1,3 3 2 1,6 7 2 1,3 3 2 1,3 3 [59] Dingwell et al. 2 2 1,3 3 1,3 3 0,6 7 2 1,6 7 2 2 1,3 3 2 2 2 1,6 7 1,3 3 1,3 3 [60] Gates & Dingwell 2 2 2 1,6
7 0,3 3 2 1,3 3 2 2 1,6 7 2 2 2 2 1,3 3 2 [61] Gates & Dingwell 2 1,3
3 1,3 3 1,3 3 0,6 7 2 1,3 3 2 2 1,6 7 2 2 2 2 1,6 7 2 [13] Granata et al. 2 2 2 1 0,6 7 1,3 3 1,6 7 2 2 1,6 7 2 2 2 2 2 2 [62] Hidler and Rymer 2 2 2 1,6
7 0,3 3 1,6 7 1 1,3 3 2 1,3 3 0,3 3 2 2 1 1 1,6 7 [40] Hurmuzlu and Basdogan 2 2 1 0,3
3 0,3 3 2 1,3 3 2 1,3 3 1,3 3 2 1,3 3 2 2 0,6 7 1,3 3 [63] Hurmuzlu et al. 2 2 2 1,3 3 0,3 3 2 1,3 3 2 2 1,3 3 1,6 7 2 2 0,6 7 1 1,6 7 [64] Kang and Dingwell 2 2 1,3
3 1,6 7 0,6 7 2 1,3 3 2 2 1,6 7 2 2 2 1 2 2 [65] Kang and Dingwell 2 2 2 1,3
3 0,6 7 2 1 2 2 1,3 3 1,3 3 2 2 0,6 7 1,6 7 2 [66] Kang and Dingwell 2 2 1,3
3 1 0,6 7 2 1 1,6 7 1,3 3 1,3 3 1,3 3 2 2 2 2 2 [67] Marghitu and Hobatho 1 1 1 0,3
3 0,6 7 2 1,3 3 1 1 1,6 7 0 1 1,3 3 0,3 3 0,3 3 1 [68] Marghitu et al. 1,3 3 1,3 3 1 1 0,3 3 1,6 7 1,3 3 2 0,6 7 1,3 3 0 1 1,3 3 1,3 3 0 1,3 3 [69] McAndrew et al. 2 2 1,3 3 0 0,3 3 2 1,3 3 1,3 3 1,3 3 1,6 7 2 2 2 1 2 1,6 7 [70] Schablowski and Gerner 1,3
3 1 0,3 3 0 0,6 7 1 1,3 3 1 1,6 7 1,3 3 0,6 7 1,6 7 2 0,6 7 1 1,6 7 [71] Scott-Pandorf et al. 2 2 2 1,3 3 1,3 3 2 1,6 7 2 2 1,3 3 2 2 2 1,3 3 1,3 3 2 [72] Scott-Pandorf et al. 2 2 2 1,6 7 1,3 3 2 1,6 7 2 2 1,3 3 2 2 2 2 2 2 [73] van Schooten et al. 2 2 1,6
7 1,3 3 0,6 7 1,3 3 1 2 2 1 2 2 2 1,6 7 1 2
28
II.3.3. Participants
The reviewed articles tested participants with different ages and physical characteristics. Some articles provided insufficient data regarding the physical characteristics of tested participants. The reviewed articles tested different sized groups of participants; the largest group consisted of 37 [58] participants, the smallest group of four participants [62]. Ten articles tested ten subjects or less. Age was mostly restricted to young (mean age 25.4 years) or old adults (mean age 71.7). One article involved children (aged 7-9, [67]), another one dogs [68]. Some articles involved pathologic subjects [58,62]. BMI was used to estimate the body composition of participants. The majority of participants had a BMI value lower than 25, indicating that they had a healthy weight in respect to their height. Where not explicitly reported, mean BMI of the participants was calculated.
II.3.4. Orbital stability analysis
All the subjects analyzed in the articles showed orbitally stable motor patterns (maxFM < 1). Hurmuzlu & Basdogan [40] found that normal individuals possess stability measures that are substantially less than unity, confirming the theory regarding the stability of normal gait. Hurmuzlu et al. analyzed gait of post-polio patients [63]; their gait resulted significantly less stable than the gait of normal individuals. Pathologic subjects were involved also in a study by Hidler & Rymer [62]: they examined ankle clonus in spastic subjects, concluding that the periodic motion exhibited during clonus is in fact a stable limit cycle. In two studies orbital dynamic stability was found to be unaffected by small changes in walking velocity, and the authors stated that slowing down does not lead to a higher orbital stability [13,58]. Conversely, a study [64] reported that both younger and older adults exhibited decreased instability by walking slower, in spite of increased variability. Schablowski & Gerner [70] reported a not very strong, yet nevertheless significant, dependence of orbital stability on walking speed, with a weak local minimum at intermediate speeds. One of these studies [13] indicated also that fall-prone elderly show poorer stability of dynamic walking than young adults and healthy old adults. Of the four articles that confronted orbital stability of walking in young and old adults, three concluded that healthy active older adults exhibit significantly increased orbital dynamic instability (kinematic and muscular), independent of walking speed [64–66]. The other one found no significant difference between the healthy old and young adult groups in terms of maxFM [13]. One study [59] showed that performing an attention demanding task while walking on a treadmill does not affect dynamic stability. One study [66] analyzed muscle activation during walking, and found that maxFM measures were only slightly correlated between electromyography (EMG) and kinematics. However, older adults exhibited greater inter-stride dynamic instability of muscle activation patterns. Two studies analyzed sawing task [60,61], concluding that muscle fatigue does not lead to instability of movement. Some works analyzed the orbital stability of walking with an added mass, with contradictory results: one article concluded that walking with an external load of 30% body weight does not influence the stability of the gait pattern in the sagittal plane [54], while the other one stated that increasing body mass alone would lead to a decrease in the stability of the sagittal plane leg kinematics during steady-state
29
walking [55]. Scott-Pandorf et al. [71,72] concluded that added load have little effect on the sagittal dynamic stability while in simulated Martian gravity, but the gait pattern is more dynamically stable with loads (e.g. Portable Life Support Systems) at the side of the torso and low on the body.
Trunk motion dynamics appeared to provide a more sensitive marker of the decline in gait function in healthy older adults compared to other body segments [65]. Trunk segment is known to play a critical role in regulating gait-related oscillations in all directions [79], hence it might also be responsible for major compensation mechanisms aimed to maintain stability of gait.
One study [69] had the purpose to determine if exposing subjects to different types of continuous perturbations would evoke changes in orbital stability; subjects exhibited direction-specific responses perturbations. A study [73] tested whether (combinations of) measures of variability, and local and orbital dynamic stability were sensitive to experimentally induced impaired gait stability, during treadmill walking at several different speeds, concluding that FM cannot be used to assess balance control in gait. In the opinion of the authors this may be due to compensatory changes, and this claim would require additional research. Orbital stability results for young subjects walking at normal or preferred speed are reported in a forest plot (Figure II.1).
Different methods and instruments of movement analysis lead to the acquisition of different locomotor variables; hence, the composition of the state space strongly depends from the chosen method of movement analysis. Different movement analysis techniques were used in the manuscripts. For kinematic measures, 15 articles used 3d stereophotogrammetry [13,54–59,64,65,70–72], two articles used 2d video motion analysis [67,68], four used electrogoniometer systems [34,40,59,63], three articles used tri-axial accelerometers [34,57,73], one article used surface electromyography [66], one used potentiometers and tachometers [62]. Some articles used two or more techniques. Orbital stability analysis in literature has been applied to different kinds of cyclic motor tasks. Almost every reviewed article involved overground or treadmill walking, at different speeds with/without carrying loads. One article analyzed subjects walking in a Computer Assisted Rehabilitation ENvironment (CAREN) system (Motek, Amsterdam, Netherlands) and exposed to continuous, pseudo-random oscillations of the support surface or visual field [69]. Two articles analyzed sewing task [60,61], one analyzed lifting task [60]. One article was about dogs trotting [68], another one analyzed a subject who was seating while clonus was stimulated [62]. Although the conclusions drawn by these study are hardly exploitable outside their specific research field, we decided to include them in the review as an application example, as some author might want to apply the technique to different biomechanical-related research areas.
30
Figure II.1 - maxFM for young healthy subjects walking at preferred (or normal) walking speed. Error bars represent 95% of confidence interval.
All the reviewed articles used the same numerical method for maxFM calculation from time series, referring to the established method by Hurmuzlu et al. [63]. Some articles calculated the dependence on speed of maxFM.
maxFM
Trunk accelerations Lower extremity sagittal planes joint angles
0.8 0.75 0.7 0.65 0.6 0.55 0.5 0.45 0.4 0.35 0.3 Arellano et al., 2008 Arellano et al., 2009 Bruijn et al., 2009 Bruijn et al., 2010 Dingwell & Kang, 2007 Dingwell & Kang, 2007 Dingwell et al., 2008 Dingwell et al., 2007 Granata et al., 2007 Hurmuzlu & Basdogan, 1994
Hurmuzlu et al., 1996 Kang and Dingwell, 2009 Kang and Dingwell, 2008 Kang and Dingwell, 2009 Schablowski & Gerner, 2006 Scott-Pandorf et al., 2009 van Schooten et al., 2011
31
Different state spaces were used in reviewed articles. Many articles included in the state space different combinations of joint angles and their derivatives, including or not their time-delayed copies. Some articles used virtual marker positions, velocities and/or accelerations instead of physical markers [13,64,65]. One article included EMG signals in the state space, and their time derivatives [66]. Articles involving tri-axial accelerometers included in the state space linear acceleration data [34,57,73]. Some articles included in the state space variables coming from both sides, some others just from the dominant side.
Different choices of Poincaré sections were made in the studies. Four articles [63,67,71,72] used maximum sagittal knee flexion to mark the first return data. Two articles [13,40] put Poincaré section at the instant of different foot strike events (left-step, right-step, stride [13] and heel strike, foot flat, heel off, toe off [40]). Two articles [34,58] analyzed the values of maxFM all over the gait cycles, while one [70] took the average values of the maxFM over all the points of the gait cycle. Three articles calculated multipliers at different percentage of the gait cycle [59,64,66]. Five articles calculated all the multipliers in the task cycle; four [56,57,61,69] considered for statistical analysis only the largest FM across all different phases in the cycle, two [69,73] considered the average maxFM value across the cycle. Two articles [54,55] computed maxFM in the instances of heel strike and maximum knee flexion. One article involving spasticity [62] choose the point in the clonus cycle where the ankle acceleration is zero. One article involving dogs trotting [68] put Poincaré maps at the instant of paw strike. Some authors [40] stated that the stability measures are fairly insensitive to the choice of Poincaré section, while other authors stated that the magnitudes of maxFM vary across the gait cycle [34].
Just a few articles [56,63,67,69] stated explicitly the number of cycles upon which the analysis was conducted (Table II.4). The number of cycles analyzed in the articles varied from 4 [63] to 300 [56]. The majority of the articles only indicated the time duration of the trials. One article about precision and sensitivity of orbital stability measures [56] stated that an acceptable value of maxFM for human walking can be estimated within 300 strides; viewing the multiplier as a measure of convergence towards an attractor, using less data could lead to less accurate estimates of the true attractor.
32
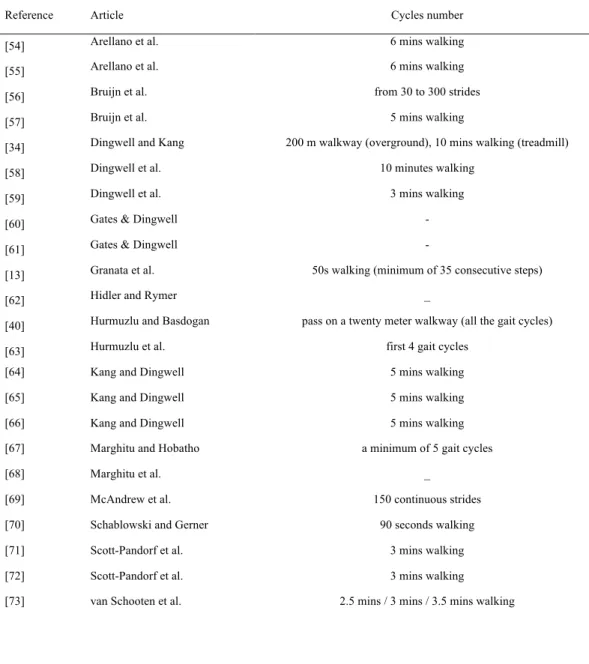
Table II.4 – Number of analyzed cycles
Reference Article Cycles number [54] Arellano et al. 6 mins walking [55] Arellano et al. 6 mins walking [56] Bruijn et al. from 30 to 300 strides [57] Bruijn et al. 5 mins walking
[34] Dingwell and Kang 200 m walkway (overground), 10 mins walking (treadmill) [58] Dingwell et al. 10 minutes walking
[59] Dingwell et al. 3 mins walking [60] Gates & Dingwell - [61] Gates & Dingwell -
[13] Granata et al. 50s walking (minimum of 35 consecutive steps)
[62] Hidler and Rymer _
[40] Hurmuzlu and Basdogan pass on a twenty meter walkway (all the gait cycles) [63] Hurmuzlu et al. first 4 gait cycles
[64] Kang and Dingwell 5 mins walking [65] Kang and Dingwell 5 mins walking [66] Kang and Dingwell 5 mins walking [67] Marghitu and Hobatho a minimum of 5 gait cycles
[68] Marghitu et al. _
[69] McAndrew et al. 150 continuous strides [70] Schablowski and Gerner 90 seconds walking [71] Scott-Pandorf et al. 3 mins walking [72] Scott-Pandorf et al. 3 mins walking [73] van Schooten et al. 2.5 mins / 3 mins / 3.5 mins walking
33
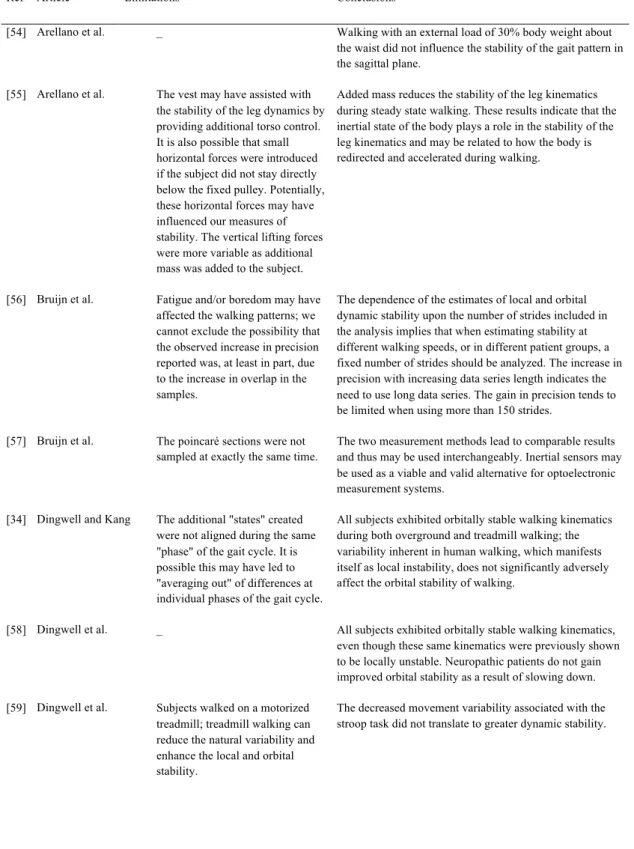
Table II.5 – Limitations and conclusions reported by the authors
Ref Article Limitations Conclusions
[54] Arellano et al. _ Walking with an external load of 30% body weight about the waist did not influence the stability of the gait pattern in the sagittal plane.
[55] Arellano et al. The vest may have assisted with the stability of the leg dynamics by providing additional torso control. It is also possible that small horizontal forces were introduced if the subject did not stay directly below the fixed pulley. Potentially, these horizontal forces may have influenced our measures of stability. The vertical lifting forces were more variable as additional mass was added to the subject.
Added mass reduces the stability of the leg kinematics during steady state walking. These results indicate that the inertial state of the body plays a role in the stability of the leg kinematics and may be related to how the body is redirected and accelerated during walking.
[56] Bruijn et al. Fatigue and/or boredom may have affected the walking patterns; we cannot exclude the possibility that the observed increase in precision reported was, at least in part, due to the increase in overlap in the samples.
The dependence of the estimates of local and orbital dynamic stability upon the number of strides included in the analysis implies that when estimating stability at different walking speeds, or in different patient groups, a fixed number of strides should be analyzed. The increase in precision with increasing data series length indicates the need to use long data series. The gain in precision tends to be limited when using more than 150 strides.
[57] Bruijn et al. The poincaré sections were not sampled at exactly the same time.
The two measurement methods lead to comparable results and thus may be used interchangeably. Inertial sensors may be used as a viable and valid alternative for optoelectronic measurement systems.
[34] Dingwell and Kang The additional "states" created were not aligned during the same "phase" of the gait cycle. It is possible this may have led to "averaging out" of differences at individual phases of the gait cycle.
All subjects exhibited orbitally stable walking kinematics during both overground and treadmill walking; the variability inherent in human walking, which manifests itself as local instability, does not significantly adversely affect the orbital stability of walking.
[58] Dingwell et al. _ All subjects exhibited orbitally stable walking kinematics, even though these same kinematics were previously shown to be locally unstable. Neuropathic patients do not gain improved orbital stability as a result of slowing down. [59] Dingwell et al. Subjects walked on a motorized
treadmill; treadmill walking can reduce the natural variability and enhance the local and orbital stability.
The decreased movement variability associated with the stroop task did not translate to greater dynamic stability.
34
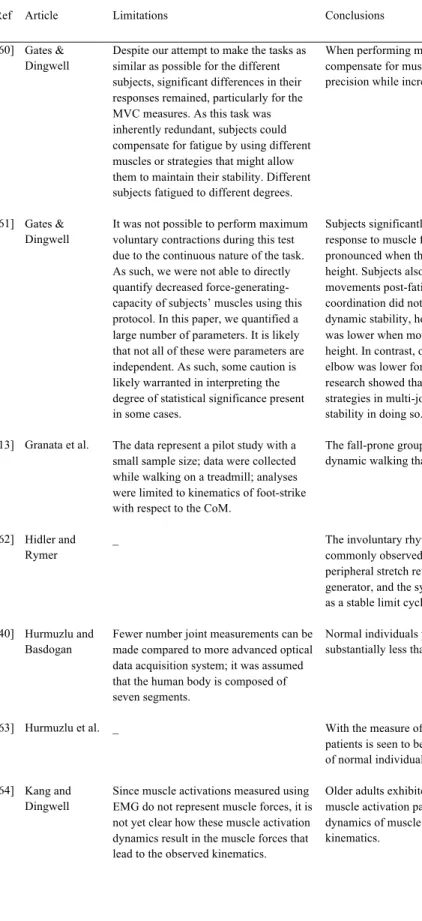
Table II.5 – (Continued)
Ref Article Limitations Conclusions [60] Gates &
Dingwell
Despite our attempt to make the tasks as similar as possible for the different subjects, significant differences in their responses remained, particularly for the MVC measures. As this task was inherently redundant, subjects could compensate for fatigue by using different muscles or strategies that might allow them to maintain their stability. Different subjects fatigued to different degrees.
When performing multijoint redundant tasks, humans can compensate for muscle fatigue in ways that maintain task precision while increasing movement stability.
[61] Gates & Dingwell
It was not possible to perform maximum voluntary contractions during this test due to the continuous nature of the task. As such, we were not able to directly quantify decreased force-generating-capacity of subjects’ muscles using this protocol. In this paper, we quantified a large number of parameters. It is likely that not all of these were parameters are independent. As such, some caution is likely warranted in interpreting the degree of statistical significance present in some cases.
Subjects significantly altered their kinematic patterns in response to muscle fatigue. These changes were more pronounced when the task was performed at a higher height. Subjects also exhibited increased variability of their movements post-fatigue. Increases in variability and altered coordination did not lead to changes in local or orbital dynamic stability, however. Local stability of the shoulder was lower when movements were performed at a lower height. In contrast, orbital stability of the shoulder and elbow was lower for movements at the higher height. This research showed that people continuously adapt their strategies in multi-joint redundant tasks and maintain stability in doing so.
[13] Granata et al. The data represent a pilot study with a small sample size; data were collected while walking on a treadmill; analyses were limited to kinematics of foot-strike with respect to the CoM.
The fall-prone group demonstrated poorer stability of dynamic walking than the other groups.
[62] Hidler and Rymer
_ The involuntary rhythmic oscillatory movements commonly observed in spastic subjects are driven by peripheral stretch reflexes rather than by a central pattern generator, and the system under these conditions is acting as a stable limit cycle.
[40] Hurmuzlu and Basdogan
Fewer number joint measurements can be made compared to more advanced optical data acquisition system; it was assumed that the human body is composed of seven segments.
Normal individuals possess stability measures that are substantially less than unity.
[63] Hurmuzlu et al. _ With the measure of dynamic stability the gait of post-polio patients is seen to be significantly less stable than the gait of normal individuals.
[64] Kang and Dingwell
Since muscle activations measured using EMG do not represent muscle forces, it is not yet clear how these muscle activation dynamics result in the muscle forces that lead to the observed kinematics.
Older adults exhibited greater inter-stride variability of muscle activation patterns during gait; multi-dimensional dynamics of muscle activations are reflected in that of kinematics.
35
Table II.5 – (Continued)
Ref Article Limitations Conclusions [65] Kang and
Dingwell
This study only quantified responses to local perturbations. These results may or may not extend to global stability, where responses to large perturbations, like tripping or slipping would be assessed. The motorized treadmill may not properly reflect overground walking.
Even active older adults who walk at the same preferred speeds as younger adults still exhibit significantly increased orbital dynamic stability, independent of walking speed.
[66] Kang and Dingwell
_ Superior segments exhibited less local instability but greater orbital instability compared to inferior segments. The superior segments are less sensitive to very small initial perturbations and thus its motion is initially less affected by these small perturbations, compared to inferior segments. Trunk motion dynamics appears to provide a more sensitive marker of the decline in gait function in healthy older adults compared to other body segments. [67] Marghitu and
Hobatho
_ The techniques of nonlinear dynamics used in this study provide an analytical tool that is easy to use in the clinical diagnosis of human gait abnormalities.
[68] Marghitu et al. The 3-angle model for the animal body is a highly simplified model.
The stability index and the measures used will help to clarify and localize the source of the instability and serve to document changes in severity of the condition.
[69] McAndrew et al.
- Subjects experienced decreased orbital and short- term local dynamic stability in a direction-specific manner when walking during the continuous pseudo-random
perturbations applied in the present study [70] Schablowski
and Gerner
_ Two different mechanisms regarding dynamic stability of locomotion seem to exist. The increasing instability ad higher speeds may be one reason for the transition from walking to running.
[71] Scott-Pandorf et al.
True martian gravity cannot be created on the earth's surface; offloading the center of mass of an individual is not likely to be the same as true reduced gravity. Additionally, the body weight suspension system may supply some stabilizing forces.
Adding weight to the walking system while walking in simulated Martian gravity had no effect on the sagittal dynamic stability of the walking pattern.
[72] Scott-Pandorf et al.
It is possible that the body weight support system may have provided additional stabilizing forces in the frontal plane.
Portable life support system loads at the side of the torso and low on the body improve dynamic stability of the gait pattern in simulated martian gravity.
[73] van Schooten et al.
The time-normalization that was used was different between the walking speeds. A treadmill was used to control walking speed.
Variability and FM of trunk kinematics cannot be used to assess balance control in gait.
36
II.4. DISCUSSION
Although the problem of falls in the elderly is gaining increasing clinical and economical attention, assessment methods designed to identify fall-prone individuals remain controversial; biomechanical approaches for assessing gait stability seem to be able to quantify the dynamic stability of locomotion, but they have not been taken up as routine procedures in clinical settings [8]. In particular, orbital stability analysis via FM revealed effective identification of fall-related and age-related differences, but its use in the assessment of fall risk remains controversial [8]. A possible cause of this controversy could be the lack of a “standard” procedure for implementing this kind of analysis in experimental trials; different implementations could in fact lead to different results, and introduce difficulties in their interpretation.
This paper provides a systematic review of the literature in the field of orbital stability analysis application in biomechanics, with particular focus to methodological aspects. 15 articles out of 23 were of very high quality, proving the excellent level of the literature in the field.
MaxFM resulted < 1 for all the analyzed motor tasks (human gait, sewing, dog trotting); hence, those tasks were demonstrated to be orbitally stable. These results showed that the analyzed periodic motor tasks reached a stable condition when equilibrium was attained. MaxFM resulting for young subjects walking at preferred or normal speed, showed in Figure 1, confirm this aspect. Gait of pathologic subjects like post-polio patients, fall-prone elderly, or children with torsional anomalies of the lower limb joints have also been demonstrated to be orbitally stable, even if less stable than gait of healthy young subjects [13,63,67]. On the contrary, subjects with diabetic peripheral neuropathy did not experience any loss of orbital stability as a result of their sensory loss [58]. The increase in risk of falling of these patients may be due to their inability to develop and execute appropriate avoidance and/or response strategies when subjected to large-scale perturbations while walking [58]. Several studies showed how slowing down while walking does not improve orbital stability [13,58] but can eventually worsen it [70]. Only one study reported that older adults exhibited decreased instability by walking slower, in spite of increased variability [64]. These results suggest that the reduction of walking velocity, commonly observed in the elderly, may not be caused by the need to enhance orbital stability [13]. Comparison between orbital stability of gait in young and elderly subjects seems to confirm that old adults tend to be less stable while walking, partially explaining the tendency to fall. The incoherence in the results about walking with added mass does not allow drawing clear conclusions.
In general, a lack of uniformity in the methodological approaches used by the authors was found; this could also explain the different results reported by different authors for basically the same task (Figure 1). Methodological quality of the studies included in this review was in general sufficient, but articles included in the review implemented orbital stability analysis in different manners. Three main factors suffered a general lack of
37
homogeneity between the analyzed studies: state space definition, Poincaré section location and number of cycles analyzed (Tables 3, 4).
Whereas state space composition have been satisfactorily described by most of the manuscripts, the choice of the variables for the state space definition often lacked justification. All the state space defined in the articles seemed appropriate to adequately describe the analyzed dynamical systems; however, an "optimal" set of variables for the definition of state space for orbital stability analysis purposes have not emerged from the analyzed literature. A standardization of the variable set to be used for orbital stability analysis purposes would contribute to the interpretation of stability results and would allow to better compare stability results under different motor conditions.
As stated in the introduction, the orbital stability of a deterministic limit cycle process should be theoretically the same, regardless of the position of Poincaré section along the trajectory. This is not verified when dealing with human cyclic tasks: human cyclic movements are not strictly periodic, and consequently the response to perturbations during different phases of the task is different [34]. This aspect was confirmed by experimental results: different choices for Poincaré section position led to different values of maxFM. All the authors seem to agree that positioning the section in different instants over the task cycle allows to obtain information about orbital stability of the different phases of the task, and that mean value of maxFM across the task cycle give global information about the stability of the task.
One of the most critical issues regarding orbital stability analysis of human locomotion was found to be the number of task cycles necessary to obtain reliable orbital stability results. One article [56] stated that the "true" value of maxFM for human walking could be estimated within 300 strides; most of the articles did not report the number of cycles analyzed, or performed the analysis on a number of task cycles inferior to 300 (Table 4). When dealing with human locomotion (e.g. gait) in a movement analysis laboratory, it is possible to reach a similar number of cycles only by treadmill walking; however, whereas the use of motorized treadmill is generally justified, treadmill walking differs significantly from overground walking [80] and it is also known to enhance orbital stability [58]. Hence, conclusions obtained from treadmill walking, whereas they can be significant and useful in some context, cannot directly be transferred to overground walking.
One of the main goals of research about stability of motor tasks is to understand the mechanisms that underlie motion, particularly in case of falls. Studies included in this review showed the state-of-art in the application of orbital stability analysis via FM calculations in biomechanics.
In summary, the main explanation to the incoherence between some of the results and to the differences in the implementation of the method is believed to be the absence of a generalized methodological procedure to perform orbital stability analysis on biomechanical time series data. This kind of analysis could have a major impact in the
38
prevention of falls. Future research should look for a standardized methodological procedure to implement this kind of analysis, identifying the best experimental setup and analytical procedure to obtain maxFM. In order to obtain more insights on the magnitude of maxFM during human gait, analytical orbital stability analysis of the equations of a full human rigid body model can also represent a promising approach. Another fundamental issue will be the evaluation of the capability of maxFM to predict falls in the elderly.