UNIVERSITÀ DEGLI STUDI DI ROMA “TOR VERGATA”
DOTTORATO DI RICERCA IN SCIENZE CHIMICHE XVII CICLO
“
M
M
e
e
c
c
h
h
a
a
n
n
i
i
s
s
m
m
o
o
f
f
m
m
e
e
m
m
b
b
r
r
a
a
n
n
e
e
p
p
e
e
r
r
t
t
u
u
r
r
b
b
a
a
t
t
i
i
o
o
n
n
b
b
y
y
t
t
h
h
e
e
a
a
n
n
t
t
i
i
b
b
i
i
o
o
t
t
i
i
c
c
p
p
e
e
p
p
t
t
i
i
d
d
e
e
t
t
r
r
i
i
c
c
h
h
o
o
g
g
i
i
n
n
G
G
A
A
I
I
V
V
:
:
a
a
p
p
h
h
y
y
s
s
i
i
c
c
o
o
-
-
c
c
h
h
e
e
m
m
i
i
c
c
a
a
l
l
s
s
t
t
u
u
d
d
y
y
o
o
n
n
f
f
l
l
u
u
o
o
r
r
e
e
s
s
c
c
e
e
n
n
t
t
a
a
n
n
a
a
l
l
o
o
g
g
s
s
”
”
Presented by Claudia Mazzuca
Supervisor: dr. Lorenzo Stella
Ph.D. School coordinator: prof. Bruno Crociani
1
“It’s 106 miles to Chicago, we’ve got a tank full of gashalf a pack of cigarettes, it’s dark and we’re wearing sunglasses.” “Hit it!” Dan Aykroyd and John Belushi – The Blues Brothers
1.1 Antimicrobial resistance
Since their discovery, antimicrobial agents (antibiotics and related medicinal drugs) have substantially reduced the threat posed by infectious diseases. By helping to bring many serious infectious diseases under control, these drugs have also contributed to the major extension in life expectancy experienced during the final part of last century.
These advantages are now seriously jeopardized by the recent emergence and spread of microbes that are resistant to these drugs. Some important examples include penicillin-resistant Streptococcus pneumoniae, vancomycin-resistant enterococci, methicillin-resistant Staphylococcus aureus, multi-resistant salmonellae, and multi-resistant Mycobacterium tubercolosys. The development of resistance to drugs commonly used to treat malaria is of particular concern, as is the emerging resistance to anti-HIV drugs.
Resistance to antimicrobials is a natural biological phenomenon that can be amplified or accelerated by a variety of factors, including human practices. The use of an antimicrobial for any infection, real or feared, in any dose or over any time period, is a selective pressure which forces microbes to either adapt or die.
Bacteria are particularly efficient at enhancing the effects of resistance, not only because of their ability to multiply very rapidly, but also because they can pass on their resistance genes to other related bacteria through “conjugation”, whereby plasmids carrying the genes jump from one organism to another, leading to the emergence of “multidrug resistant strain” (W.H.O., 2002)
An example, regarding the spread of the multi-drug resistant strains of
1.2 Antimicrobial peptides
The antibiotic resistance problem has spurred an active research for new antimicrobial compounds. One of the possibilities presently pursued are antimicrobial peptides. These compounds are produced by all living organism as part of the innate immunity system, a non specific defense system that complements the highly specific cell-mediated immune response. Antimicrobial peptides are evolutionary ancient weapons, as suggested by their widespread distribution throughout all phylogenetic kingdoms (Zasloff, 2002). In higher organisms, including humans, they are produced at low metabolic cost on epithelial surfaces and in phagocytic cells, where they are easily stored in large amounts, and readily available after an infection to rapidly neutralize a broad range of microbes, including bacteria, fungi and protozoa (Bulet et al., 2004).
Their potential to overcome bacterial resistance is based on the fact that their mechanism of action is different from that of traditional antibiotics. These act by penetrating into the microorganisms and by interacting with specific targets, leading to inhibition to cell wall, DNA or protein biosynthesis in growing cells. Most antimicrobial peptides, on the other hand, simply bind aspecifically to phospholipid bilayers. Their insertion into the cell membranes alters their permeability, leading to cell death by collapse of transmembrane electrochemical gradients and osmolysis (Sitaram and Nagaraj, 1999). The lack of any specific association in the mechanism of action of antimicrobial peptides is supported by studies showing that enantiomers of lytic peptides, composed solely of D-amino acids, possess a biological activity which is indistinguishable from that of the parent molecules (Blondelle et al., 1999; Juvvadi et al., 1996 Papo and Shai, 2003).
Although this mode of action does not involve any specific binding, some antimicrobial peptides are able to selectively target the membranes of microbes instead of those of mammals. This selectivity is probably due to the different lipid composition of the membranes involved. While the outer leaflet of mammalian cell walls are mainly constituted of neutral and zwitterionic phospholipids, that of bacterial cells contains phosphatidylglycerol or in general
anionic lipids. Furthermore, these membranes differ also in their cholesterol content (Zasloff, 2002; Epand and Vogel 1999a; Matsuzaki, 1998).
Due to their mechanism of action, the emergence of resistance to antimicrobial peptides is less probable than for conventional antibiotics. This has led several research groups to develop antimicrobial peptides, both natural and synthetic, into therapeutically useful agents (Zasloff, 2002) as well as to initiate many studies aimed to understand their mode of action.
In recent years hundreds of antimicrobial peptides have been isolated and several have been de novo designed and synthetically produced (see Table 1.1) (Andrès and Dimarq, 2004).
Table 1.1 Update of clinical development of cationic antimicrobial peptides Compound Structural characteristics Species Topical or parenteral use Indications – phase of clinical trials Pexiganan (MSI-78) α-helices
Skin of xenop Cream Impetigo and diabetic foot ulcer infections – phase III trial Iseganan
(IB-367) contain disulfide Peptides that bridges
Leucocytes of pig Oral solution Aerosol
Anticancer therapies, induced oral mucosistis – phase III trial Long infections in cystic fibrosis patients and ventilator-associated pneumonia – phase I trial Peptides MBI
(MBI-226) α-helices Not communicated Cream Catheter-related bloodstream infections – phase III trial; acute acne and nasal carriage of S. aureus – phase I trial
Histatine
variants α-helices Human Oral solution Gengivitis and mouth infections – phase II trial; oral candidiasis and Pseudomonas aeruginosa long infections – phase I trial Heliomocin variants (ETD151) Peptides that contain disulfide bridges Insect: lepidopteran
Heliothis virescens Parenteral use Systemic deep and invasive fungal infections. Immunocompromised patients – preclinical development Insect
defensins variants
Systemic multiresistant Gram-positive bacterial infections – preclinical development Neuprex
(RBPI 21) α-helices Human Parenteral use Pediatrics meningococcæmia – phase III trial (Orphan drug status from FDA)
Mycoprex
(XMP366) α-helices
This large repertoire of antimicrobial peptides displays a wide diversity in chain length (with sizes between 9 and 100 amino acids), secondary and tertiary structures (α-helices, β-sheets or cyclic), and number of disulfide bonds. Nevertheless, most of them share common properties: although they can be differently charged, they have at least 50% hydrophobic aminoacid residues (Hanckock and Chapple, 1999). Most importantly, they share an amphipathic structure with a polar face and a hydrophobic face. As it will be explained later, amphipathicity seems to be a fundamental prerequisite for their activity.
The spectrum of activity of antimicrobial peptides varies significantly: some of them are toxic only against Gram-positive bacteria (e. g. cecropins), others against both Gram-positive and Gram-negative bacteria (e.g. magainins and dermaseptins); some peptides can be active solely on fungi or toward both bacteria and fungi (e. g. cathelicidins). Finally, some peptides are toxic both to microorganisms and mammalian cells, like mellitin and pardaxin (Shai, 2002).
The mechanism by which antimicrobial peptides act is still debated, and the details of the actual membrane permeation process are still not clear (Shai, 2002; Epand and Vogel 1999a). However, the understanding of how the peptides act is of fundamental importance to fully exploit the use of these peptides as antimicrobial agents.
In recent years, several models has been proposed to tentatively explain the mode of action of these peptides (Shai, 2002; Matsuzaki, 2001; Yang et al.,
2001; Huang, 2000; Pouny and Shai,1992). They are graphically summarized in Figure 1.2.
Figure 1.2 Possible mechanisms of action for antimicrobial peptides
The “barrel stave” mechanism describes the formation of transmembrane pores/channels by bundles of amphipatic α-helices, which aggregate like the staves of a barrel, so that their hydrophobic surfaces interact with the lipid core of the membrane and their hydrophilic surfaces point towards the interior of the pore, which is filled with water. Since this model requires peptide insertion into the hydrophobic core of the lipid bilayer, it is reasonable to assume that in this case peptide association with the target membrane is driven predominantly by hydrophobic interactions. The best studied peptide for which this model seems to hold is alamethicin, a peptide belonging to the peptaibol family (Chugh J. K., and Wallace, 2001; Ludtke and Huang, 1996; Spach et al., 1989; Schwarz et al., 1987).
In the “carpet-like” model, peptides are in contact with the phospholipid head groups throughout the entire process of membrane permeation and do not penetrate into the lipid hydrophobic core neither do aggregate, in contrast to the barrel-stave mechanism. Peptides lay parallel to the membrane surface (with the hydrophobic face pointing towards the lipid core, and the hydrophilic face to water). Membrane permeation occurs only if there is a high local concentration of membrane-bound peptides (so that they form a “carpet”). In this case, the surface tension caused by peptide insertion in the headgroup region is released by the formation of transient membrane spanning pores, made up of dynamic peptide-lipid supramolecular complexes (Gazit et al., 1995; Matsuzaki, 2001). In these holes, the lipid bilayer bends back onto itself
forming a toroidal structure (“toroidal model”). As a consequence, a fraction of peptide molecules translocates into the inner leaflet of the membrane, significantly reducing the peptide density in the outer layer, and leading to the closing of the pore. Furthermore, at higher concentrations, the peptide causes the disintegration of the membrane and the formation of micelles (micellization). In this mechanism, as the peptide interacts strongly with the phospholipid head groups, electrostatic interactions presumably play a crucial role. Magainin 2 is one of the most studied peptides thought to act according to this mode of action (Matsuzaki, 1998; Matsuzaki et al., 1997).
In the third model, the so-called “ion carrier” mechanism, peptides bind the ions or the molecules to be transferred across the membrane. This complex can have a 1:1 stoichiometry, or the molecules can be included inside a supramolecular peptide aggregate. In these complexes the peptides expose their hydrophobic face to the outside, facilitating the translocation of hydrophilic molecules across the lipid bilayer. One example of an ion-carrier peptide is valynomicin (Roeske and Kennedy, 1983; Boheim et al., 1980).
Despite extensive studies on the mechanism of action of antibiotic peptides, it is not clear which of these models better describes the real situation in each specific case. A detailed understanding of the activity and selectivity of these peptides is a necessary starting point for the design of novel antimicrobial agents with improved properties.
1.3 The Peptaibols
Peptaibols are a unique group of antibiotic peptides isolated from soil fungi, mainly of the genus Trichoderma. They are 11-20 aminoacids in length, and their name derives from their chemical composition: “Pept” is the abbreviation of peptide, “Aib” indicates a high content of the unusual Cα,α-disubstituted
aminoacid Aib (aminoisobutiryc acid), and “ol” is due to the presence of a C-terminal 1,2-amino alcohol; they also contain an N-C-terminal acetyl group. (Chugh J. K., et al., 2001).
Aib is a well-known helix-inducing amino acid, since the presence of the second methyl group on the Cα atom imposes strong stereochemical restrictions
on the peptide backbone (Karle and Balaram, 1990; Pispisa et al., 2000a and 2000b), that is constrained to adopt a 310 or a α-helical conformation. Indeed
all peptaibol structures determined so far are helical (Rebuffat et al., 1999). A schematic representation of the two kinds of helices is reported in Figure 1.3.
These peptides can contain also other kinds of Cα,α-disubstituted amino
acids like Iva (isovaline or Cα-methyl-Cα-ethylglycine), or Etn (α-ethylnorvaline
or Cα-ethyl-Cα-n –propylglycine), and many have a number of imino acids
(either proline or hydroxyproline), that tend to promote bends or kinks in the structures. The presence of modified aminoacids in the sequence is due to the fact that peptaboils are not biosynthesized through the classical ribosomial pathway, but by means of the multienzymatic complex “peptide synthetases”. This leads to microheterogeneus mixtures of closely related analogs (Kleinkauf and von Dören 1990), which, in most cases, differ for just a single aminoacid. The principal member of this family is alamethicin, a 20 amino acids long peptide, which, as reported in Section 1.2, is thought to act according to the barrel stave model (Rebuffat et al., 1999; Ludtke and Huang,1996).
Lipopetaibols are a novel sub-class of peptaibols, which at present consists of six members. They are characterized by a N-terminal fatty acyl moiety (from 8 to 15 carbon atoms long) and a very short sequence (7-11 aminoacid) (Rebuffat et al., 1999; Toniolo et al., 2001).
Interest in this peptide family arises from the fact that they exhibit a strong antibiotic activity (Toniolo et al., 2001), making them suitable candidates for pharmaceutical applications (see Table 1.2); however their mechanism of action is still unsettled.
Table 1.2 Survey of the biological activity of lipopeptaibols
Lipopeptaibols Description of biological activities
Trichopolyns Immunosuppressants, with a mode of action different from that of cyclosporin A (in particular, they do not affect the production of interleukin 4). IC50 (nM) for proliferation of lymphocytes in mouse allogeneic MLR:
trichopolyn I 5.2, trichopolyn II 10.7 (for comparison cyclosporin A 7.5). Trichogin GA IV Antibacterial activity against Staphylococcus aureus; inhibition diameter: 13
mm at 3 µg/pit, 9 mm at 1.5 µg/pit.
Trikoningins Antibacterial activity against Staphylococcus aureus (strain 209P); inhibition diameter: 11 mm at 6 µg/pit. Inactive against Escherichia coli.
LP 237s Cytotoxicity (antitumor activity) against mouse leukemia cells (IC50 ≈ 0.5
µg/mL) and a number of carcinoma cell lines (lung, ovarian, colon, breast) (IC50 =0.2-0.5 µg/mL).
Helioferins Hemolysis at >100 µg/mL. Cytostatic activity (IC50 =0.01-0.04 µg/mL)
against leukemia and mouse fibroblast cell lines. Protonophoric activity (moderate) causing uncoupling of oxidative phosphorylation in mitochondria. Strong antibacterial activity against Gram-positive bacteria and mycobacteria, and strong antifungal activity.
1.4 Trichogin GA IV
Trichogin GA IV is the main component of the lipopeptaibol family and was first isolated in 1992, by Bodo and coworkers (Auvin-Guette et al., 1992) from the soil fungus Trichoderma longibrachiatum. It has the following sequence:
Oct-Aib1-Gly2-Leu3-Aib4-Gly5-Gly6-Leu7-Aib8-Gly9-Ile10-Lol
where Oct is n-octanoyl, and Lol is leucinol.
The great interest towards this peptide is due to the fact that it is very active against Gram-positive bacteria even if it is it only 11 aminoacids long, and therefore too short to span the membrane (Toniolo et al., 1994; 2001). The presence of a long fatty acyl chain at the N-terminus is thought to play an essential role in its activity (Toniolo et al., 1996; 2001; Locardi et al.,1998) as trichogin analogs acetylated with a chain shorter than four carbon atoms, or with an Aib residue replacing the fatty acyl moiety at the N-terminus, are not active.
Trichogin aminoacid composition displays two contrasting features, from a structural standpoint: it contains both a high proportion of the helix inducing residue Aib, and four glycines, that favor flexibility. Furthermore two glycines are adjacent and in the middle of the sequence: this feature can lead to a certain degree of flexibility and probably to the formation of a bend in the structure (Gatto et al., unpublished results).
The structure of trichogin was analyzed in methanol solution using CD, EPR and NMR data (NOE temperature coefficient of NH and CO groups and 13C
relaxation measurements), while the crystal structure of the peptide was determined using a centrosymmetric space group obtained by co-crystallization of racemic crystals (Auvin-Guette et al., 1992; Locardi et al., 1998; Monaco et al., 1998; Toniolo et al., 1994, 1996, 2001).
All of these studies suggest that the peptide adopts a flexible, right-handed, mixed 310/α helical structure, about 2 nm long. More in detail, at the N-terminus
longer segment of α–helix. The Gly5-Gly6- stretch forms a hinge point between
the two helical regions. More importantly, the crystallographic data, suggest the structure of trichogin to be amphiphilic, with all of the hydrophobic groups (n -octanoyl and Leu, Ile and Lol aliphatic side chains) on one helix face and the four glycine residues comprising the hydrophilic face. Aligned on the border between these two helical faces are the Aib methyl groups (Figure 1.4).
Figure 1.4 3D representation of the secondary structure of GA IV. Light grey, dark grey and
black residues are Aib, Gly and Leu amino acids, respectively.
Studies in different solvents like CDCl3 (FTIR), DMSO (NMR), TFE (CD), and
SDS (CD, NMR, FTIR) show that the main structural features found in methanol for this peptide are preserved in all other solvents. Furthermore, an increase in ordered secondary structure is found in a membrane mimicking environment like SDS (Toniolo et al., 2001, Monaco et al., 1998; Locardi et al., 1998).
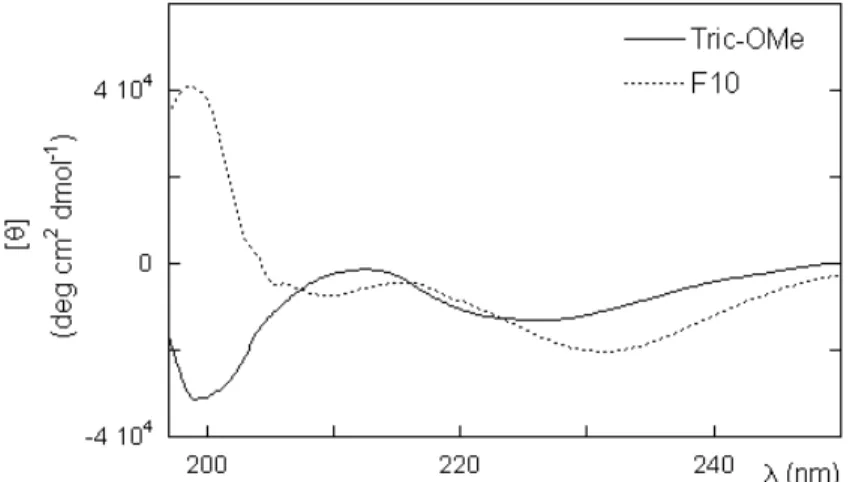
Synthetic analogs, like [Leu11-OMe] trichogin (called Tric-OMe), with a leucine
methyl ester at the C-terminus replacing Lol, or [TOAC4,8 Leu11-OMe], with a
TOAC residue replacing Aib in position 4 or 8, display the same structural features and activity of trichogin GA IV. (Toniolo et al.,1996, 2001; Monaco V. et al., 1999; Anderson et al., 1999).
Trichogin was found to be very active against Gram positive bacteria, like
et al., 2001). Several experiments have been performed in order to relate the structural features of this peptide to its activity (Toniolo et al., 1996, Peggion et al., 2003).
A preliminary investigation of membrane activities of the two trichogin enantiomers suggested that their interaction with the lipid environment is comparable (Peggion et al., 2003). Furthermore, the loss of amphipaticity obtained substituting the Leu(3) and Leu(7) residues with the less hydrophobic valines, led to a significant decrease in activity. An increase in peptide-induced membrane perturbation is gained introducing more polar residues as serines instead of glycines. Finally, it has been shown that a significant modulation of trichogin ability to make membranes permeable can be reached by varying the number of carbon atoms of the aliphatic N-terminal chain.
The molecular details of the mode of action of this peptide are still unsettled. Several different mechanism have been proposed including bilayer destabilization (Epand et al, 1999b; Monaco et al., 1999), ion carrier (Milov et al., 2003) or channel formation (Scrimin et al., 2002). In particular, Epand and collaborators and Monaco and coworkers have employed modified analogs in which one Aib residue at a time was substituted with a TOAC amino acid to perform fluorescence quenching experiments using liposomes containing fluorescent labeled lipids and ESR measurements. Both approaches led them to suggest that the long helix axis of trichogin is oriented in the plane of the bilayer with the hydrophobic face oriented toward the membrane, and the polar face facing water. Milov and coworkers, using pulsed electron-electron double resonance (PELDOR) technique on similar nitroxide labeled trichogin analogs have found significant evidences in favor of peptide self-assembly, suggesting an ion-carrier mechanism. Finally, experiments performed with a tripodal peptide composed of trichogin units, indicated channel formation as the principal mechanism of action (Scrimin et al., 2002).
1.5 Aim of the work.
All the observations reported in the previous Section concur to determine the importance of a detailed study of the mode of action of this peptide.
To this end, the interaction of trichogin GA IV with model membranes has been investigated using several spectroscopic techniques (like steady-state and time-resolved fluorescence, circular dichroism, UV-Vis and Infrared absorption). Our purpose was to analyze at the molecular level all the phenomena involved in the membrane perturbing activity, such as water-membrane partition, aggregation, trichogin orientation with respect to the bilayer, etc.
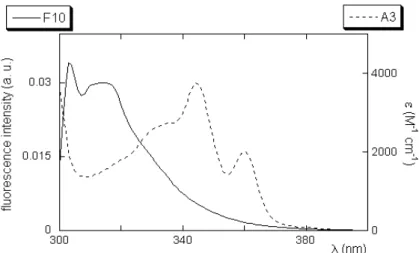
To this end, two fluorescent analogs of Tric-OMe (henceforth called A3 and F10), were designed for our spectroscopic studies and synthesized in the laboratory of Prof. Toniolo at the University of Padua (Didonè, 2001).
The fluorescent labels azulene and fluorene have been introduced in position 3 and 10, respectively:
Oct-Aib-Gly-Aal-Aib-Gly-Gly-Leu-Aib-Gly-Ile-Leu-OMe (A3) Oct-Aib-Gly-Leu-Aib-Gly-Gly-Leu-Aib-Gly-Dab(Fmc)-Leu-OMe (F10)
Here azulene was inserted in the peptide chain as β-(1-azulenyl)-L-alanine (Aal or azulenylalanine), kindly provided by prof. L. Moroder (Max-Planck-Institut für Biochemie, Martinsrield, Germany), who recently synthesized it for the first time (Loidl et al., 2000). Fmc is fluorenyl-9-methylcarbonyl, linked to the side chain of 2,4-diaminobutyric acid (Dab) (Figure 1.5).
Labeling occurred by substitution of the two hydrophobic leucine residues, in order to minimize perturbation to the peptide structure. The two fluorescent probes were located at the two end of the peptide chain, so that information on the two different peptide domains could be obtained. Finally, these two fluorophores were chosen because they can act as a Förster resonance energy transfer donor-acceptor pair, as already reported by our laboratory (Venanzi et al., 2004; Pispisa et al., 2000c).
This research was carried out in three successive steps, each analyzing a different fundamental aspect of the interaction between trichogin and the lipid membranes:
1) characterization of the different peptide equilibria in a water-membrane system;
2) investigation of the peptide topology in the membrane; 3) study of peptide activity and definition of its mode of action.
2
“Though this be madness, yet there’s method in ‘t”William Shakespeare – Hamlet, act II, scene 2
Materials,
methods &
techniques
2.1 Liposomes
2.1.1 IntroductionLiposomes are the model membranes most commonly used in studies of peptide interaction with lipid bilayers (Epand and Epand, 2000). They are closed membranes of spherical shape, separating a water compartment from the bulk water. The value of liposomes as model membrane systems derives from the fact that the liposome membrane forms a bilayer structure which is in principle identical to the lipid portion of natural cell membranes (New, 1990). In this thesis work, only unilamellar vesicles have been used, i.e. liposomes consituted by a single phospholipid bilayer. These liposomes can be classified on the basis of their dimension: they are called small unilamellar vesicles (SUVs) , large unilamellar vesicles (LUVs) and giant unilamellar vesicles (GUVs) if their diameters are approximately in the range 15-50 nm, 100-400 nm and 1 -200 µm, respectively.
As far as the composition is concerned, phospholipids (some representative examples of which are reported in Table 2.1) are the major structural components of biological membranes, and therefore they are used also for liposomes. The most common phospholipids are phosphatidylcholine molecules (PC), amphipatic molecules in which a glycerol bridge links two hydrophobic acyl hydrocarbon chains to an hydrophilic polar headgroup, phosphocholine (New, 1990). It should be noted that phosphatidylcholine, also known as “lecithin”, can be derived from natural sources such as egg yolk (ePC) or synthesized. The phosphatidylcholine extracted from natural sources is, actually, a mixture of phosphatidylcholines, with chains of different lengths and varying degrees of saturation.
Another important phospholipid found in nature (which has also been employed in this work) is phosphatidylethanolamine (PE), characterized by having a primary, instead of quaternary, ammonium headgroup and, consequently, a pH-dependent charge state.
Table 2.1 Chemical structure of some common phospholipids.
POPG: 1-Palmitoyl-2-Oleoyl-sn-Glycero-3-Phosphoglycerol
SOPE: 1-Stearoyl-2-Oleoyl-sn-Glycero-3-Phosphoethanolamine
DMPC: 1,2-Dimyristoyl-sn-Glycero-3-Phosphocholine
DPPC: 1,2-Dipalmitoyl-sn-Glycero-3-Phosphocholine
POPC: 1-Palmitoyl-2-Oleoyl-sn-Glycero-3-Phosphocholine
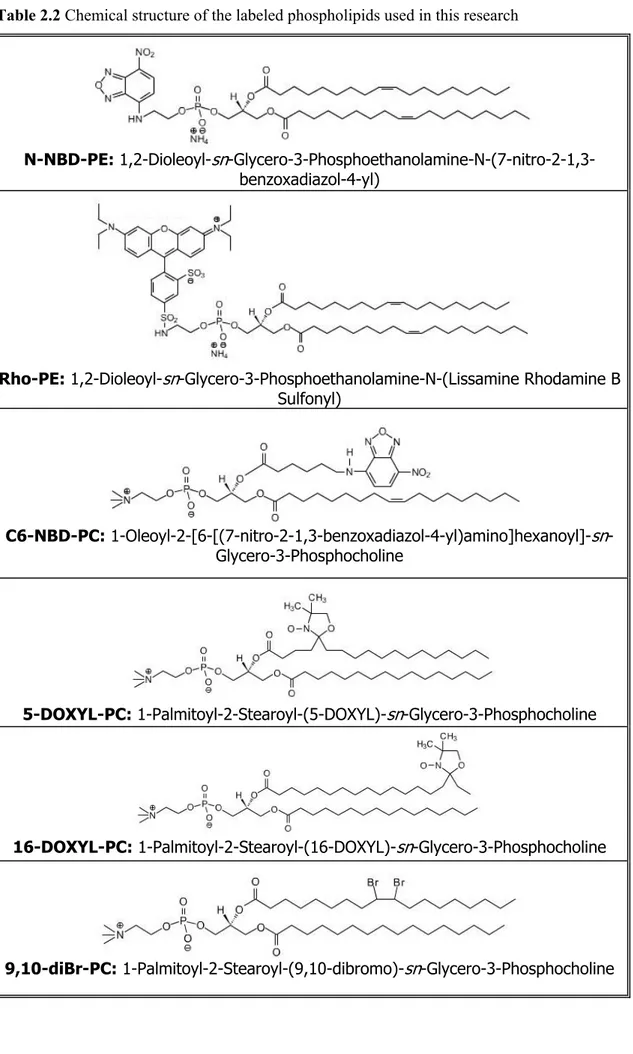
Table 2.2 Chemical structure of the labeled phospholipids used in this research
N-NBD-PE: 1,2-Dioleoyl-sn -Glycero-3-Phosphoethanolamine-N-(7-nitro-2-1,3-benzoxadiazol-4-yl)
Rho-PE: 1,2-Dioleoyl-sn-Glycero-3-Phosphoethanolamine-N-(Lissamine Rhodamine B Sulfonyl)
C6-NBD-PC: 1-Oleoyl-2-[6-[(7-nitro-2-1,3-benzoxadiazol-4-yl)amino]hexanoyl]-sn -Glycero-3-Phosphocholine
5-DOXYL-PC: 1-Palmitoyl-2-Stearoyl-(5-DOXYL)-sn-Glycero-3-Phosphocholine
16-DOXYL-PC: 1-Palmitoyl-2-Stearoyl-(16-DOXYL)-sn-Glycero-3-Phosphocholine
Moreover, sterols, and in particular cholesterol (henceforth abbreviated as Cho), are other important components of most natural membranes. Due to the rigidity of their structure, their incorporation in the lipid bilayer can bring about major changes in the properties of the membranes, such as a reduction in the freedom of motion of the fatty acyl chain carbon atoms. Being an amphipatic molecule, cholesterol inserts into the membranes with its hydroxyl groups oriented towards the aqueous surface and the aliphatic chain aligned parallel to the acyl chains in the center of the bilayer (New, 1990).
During this thesis work, unless where explicitly stated otherwise, we performed experiments using large unilamellar vesicles made up of ePC:Cho 1:1, prepared as described in Section 2.1.3. When necessary, liposomes labeled with substituted lipids have been used; their structures and abbreviations are reported in Table 2.2.
2.1.2 Phase transitions of phospholipid membranes.
Depending on temperature, lecithin membranes can exist in a fluid phase and a gel phase. The phase behavior of a liposome membrane determines such properties as permeability, fusion, aggregation and protein binding (Seddon and Templer, 1995).
In the gel phase, the hydrocarbon chains are essentially in the all-trans
conformation, aligned with the glycerol backbone approximately perpendicular to the plane of the membrane, and the phosphocholine headgroup in a straight line roughly parallel to the membrane surface. Therefore, the rotations of the fatty acid chains about the carboxyl bond are strongly hindered, as well as lipid lateral diffusion. As the temperature increases, reaching the gel → fluid transition temperature (called also “melting transition temperature”), the fatty acyl chains experience a considerable increase in their conformational freedom and in the area occupied by each lipid molecule.
The melting transition temperature is strongly affected by the lipid chain length. For example, Tm=25° C for DMPC, and 41°C for DPPC, the latter having
positions) of lipid insaturations: for example, the Tm for 1-palmitoyl-2-steroyl
phosphatidylcholine and 1-palmitoyl-2-oleyl-phosphatydilcholine, which differ for 1 double bond only, are 44° C and –2°C, respectively (Szoka and Papahadjiopoulos, 1980; Sackman,1995). Moreover, in the presence of more than 33% (mol:mol) cholesterol there is no more evidence of the membrane phase transition, as this sterol is able to alter the membrane fluidity both below and above the transition temperature (Miao et al., 2002; New,1990).
2.1.3 Large and small unilamellar vesicle preparation.
Large unilamellar vesicles (LUVs) were prepared by dissolving the desired amount of lipids in a chloroform/methanol solution (2:1 v/v). The solvents were evaporated under an argon atmosphere, to avoid lipid oxidation, until a thin film was formed. Complete evaporation was ensured by applying a rotary vacuum pump for at least 2 hours. The film was hydrated with a 20 mM Tris buffer (pH 7.0), containing 140 mM NaCl and 1 mM EDTA, while for release experiments a 30 mM carboxyfluorescein solution (pH 7.0), or a 0.1 mM solution of Texas Red labeled dextran were used. At this stage, the sample contains large, multilamellar vesicles (LMV), analogous in structure to an onion, with each lipid bilayer separated by a water layer. After vigorous stirring and 10 freeze and thaw cycles, to achieve a better separation between lipid bilayers in LMVs, the lipid suspension was extruded for 31 times through two stacked polycarbonate membranes with 100 nm pores (Avestin, Inc., Ottawa, ON, Canada). All these processes must be performed at a temperature above the melting temperature of the lipid used, i.e. at room temperature in the case of ePC/Cho 1:1 or POPC liposomes, and at 45°C for DMPC vesicles. Small unilamellar vesicles (SUVs) were prepared by sonication (Auvin-Guette et al., 1992). In particular, the MLV solution was left at rest for about 15 hours and then sonicated for at least 45 minutes (Branson sonicator mod. 250) at 0°C. Successively, the solution was filtered with a PRO-X hydrophilic LIDA filter of 0.45 µm.
The unencapsulated fluorescent tracer was separated from the liposomes by gel filtration on a Sephadex G-50 medium column, in the case of carboxyfluorescein, or a Sephacryl S-300 column for dextran. Final phospholipid concentration was determined by the Stewart method, presented in Section 2.1.5 (Stewart, 1980).
2.1.4 Giant Unilamellar Vesicles
Giant unilamellar vesicles are characterized by a diameter varying from 1 to 200 µm, very similar to those of cells. Due to their size, they can be directly visualized under an optical microscope. This property gives rise to multiple applications of GUVs. For instance, it is possible to isolate a specific vesicle under the microscope, and/or to perfuse a membrane-active agent in the proximity of that liposome in order to visualize its effects. Furthermore, reagents can also be injected into the vesicles interior (Menger and Angelova, 1998).
GUVs can be prepared by several methods, such as electroformation (Angelova and Dimitrov 1986) or the so-called “gentle hydratation” method (Akashi et al., 1996 and 1998).
We performed release experiments using GUVs prepared by electroformation (see Section 3.9.1)
Figure 2.1 Schematic representation of the Teflon cell (denoted as a) in which liposomes (empty circles) are formed. Arrows indicate the platinum wires.
To this end we have designed a Teflon cell with a quartz window on the bottom (to allow microscopic measurements in the UV region) containing two 0.5 mm diameter platinum wires spaced 0.5 cm apart (Figure 2.1). The upper part of the cell is open to facilitate the addition of reagents. A 1µL droplet of a lipid solution (1 mM in CHCl3/MeOH 1:1) is deposited on the center of each wire
under a stream of Argon. The solvent is evaporated using a rotary vacuum pump for at least two hours. Successively, the cell is filled with an aqueous solution of the dye that has to be entrapped into liposomes (3 µM CF or 18 µM Texas Red dextran, see Section 2.1.6 and 3.9.1). An initial voltage of 0.2 V (that is slowly increased to 1 V) is then applied at an alternated frequency of 10 Hz for almost an hour, at a temperature above the melting temperature of lipids. GUVs are then formed. They remain attached to the wires, do not evolve once voltage is terminated and are stable for several hours. A further increase in the voltage up to 4 V would cause the detachment of liposomes from wires.
The mechanism of GUV electroformation in an alternated field is not well understood. Probably, since the growing vesicles were observed to vibrate at the same frequency as the applied voltage, the electric field may serve to create a gentle mechanical agitation that assists in the formation, fusion and detachment of the vesicles (Menger and Angelova, 1998).
After liposome formation, the aqueous layer outside vesicles is partially removed (leaving the wires always immersed in the solution) and substituted with pure deionized water. This process is repeated for several times, until the signal of the fluorescent marker entrapped in GUVs is distinguishable from the background.
This method is very simple, and the fact that vesicles are partially attached to the platinum wires allows a fast change of the external solution. For this reason, it is particularly suited to release experiments. On the other hand, during this thesis work we have also attempted to use GUVs for conductance measurements, with the voltage-clamp technique (see Section 3.9.3). In this case, the presence of a relatively high salt concentration in solution is needed, but this is not possible with the electroformation method. For this reason, we
have used a different approach to GUV preparation, namely the “gentle hydration” method of Akashi (Akashi et al., 1996;1998).
In this case, lipids were dissolved in a chloroform/methanol solution (1:2 v/v) in a 5mL glass tube, at a final volume of 400µL. The solvent was evaporated at 45° C (or 60 °C for DPPC containing liposomes) in a rotary evaporator under argon atmosphere, and a thin lipid film was formed on the whole glass tube. Complete evaporation was ensured by applying a rotary vacuum pump overnight. The completely dried lipids were then prehydrated at 47°C (65 °C for DPPC containing liposomes) with water-saturated N2, until the film became
transparent (about 45 minutes). Five milliliters of buffer, N2 purged, were added
to the tube. The tube was then filled with Argon and incubated for three hours at 37°C (45°C for DPPC containing liposomes), and gently rocked every hour to disperse the lipid film uniformly in the solution. After further incubation overnight at room temperature, we found a bulky cloud floating in the middle of the solution, which contained giant liposomes. They remain stable for more than two weeks, if stored at 4°C, and some days at room temperature.
2.1.5Phospholipid assay
Phospholipid concentration was determined according to Stewart’s method (Stewart, 1980), which consists in measuring the absorbance of the association complex between ammonium ferrothiocyanate and the phosphatidyl head group (λmax = 488 nm).
More in detail, 1.5 mL of a 0.1 M ammonium ferrothiocyanate aqueous solution was added to 1.5 mL of chloroform solution, containing the lipid to be determined, and the test tube was vigorously shaken for 60 s to favor the formation of the complex. Complex formation between ferrothiocyanate and phospholipids brings an aliquot of the water-soluble ammonium ferrothiocyanate, proportional to the lipid concentration, in the chloroform phase. After centrifugation (3 min at 3800 rpm) to rapidly separate the two solvent phases, and removal of the upper aqueous phase, the chloroform
solution was transferred in a quartz cuvette and its absorbance at λmax
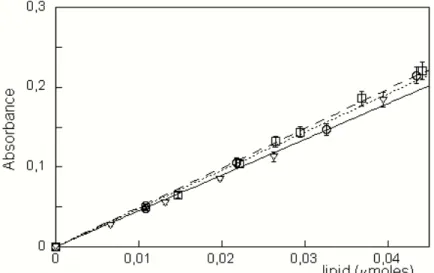
measured. The phospholipid concentration was determined by comparison with a calibration curve, obtained by using solutions of known title. A linear behavior was observed at least up to 0.04 µmol of phospholipid present in the chloroform solution. Calibration curves determined for ePC, DMPC and 6,7-DiBr-PC are reported in Figure 2.2. The slopes of the curves are 4.5±0.2 µmoles-1 ,
4.9±0.1 µmoles-1 and 4.8±0.2 µmoles-1 respectively; R= 0.998 in all cases. All
the experiments were performed in triplicate.
Figure 2.2 Calibration curves obtained using standard solutions of ePC (triangles and continuous line), DMPC (squares and dashed line)and 6,7-DiBr-PC (circles and dotted line). Points represent experimental data, while lines the fits.
Cholesterol content was estimated based on its ratio to the phospholipid concentration.
Finally, we verified that the presence of labeled phospholipids like NBD-PE, Rho-PE at few percent of the total lipid concentration, does not affect the accuracy of the phospholipid assay.
2.1.6 Liposome leakage
2.1.6.1 Release experiments from LUVs
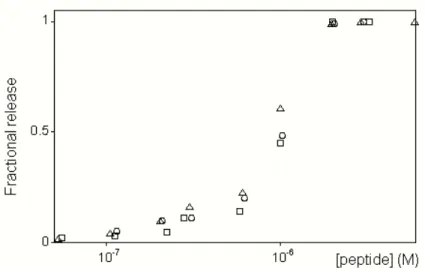
Perturbation of membrane permeability was determined by measuring the fractional release of a fluorophore entrapped inside liposomes. In the case of carboxyfluorescein (CF, 30 mM concentration), this quantity can be measured directly by the increase in fluorescence intensity (excitation 490 nm, emission 520 nm) caused by the reduction in self-quenching (Chen and Knutson, 1988). When the entrapped molecule was Texas-red (TR) labeled dextran (0.1 mM concentration), leakage was measured by adding to the outside solution anti-TR antibodies to a 10 µg/mL final concentration (according to what reported on the operating procedures provided by the manufacturer, Molecular Probes. Inc).
Antibody binding to the fluorophore causes a change in its fluorescence intensity (Sharpe and London, 1999), measured with λexc. = 592 nm and
λem. = 604 nm. In both cases, fractional release (R) was determined by the
following formula:
R= F − F0%
F100%− F0%
(2.1)
where F0% is the fluorescence intensity before peptide addition, and F100% is the intensity corresponding to 100 % leakage, determined after vesicles were completely disrupted by adding Triton X-100. The release kinetics was recorded with a 0.2 s timestep.
2.1.6.2 Release experiments from GUVs
Release of dye entrapped in GUVs prepared by electroformation (Section 2.1.4) was followed using a Nikon TE200 inverted microscope (Nikon, Tokio, Japan) equipped with two excitation/emission filter sets: the “blue” excitation filter set (B-2E/C,λexc=465-495 nm, λem= 515-555 nm), and the “green” excitation filter
set or G-2E/C:λexc=528-553 nm, λem= 590-650 nm). The use of these two
filters allows the concomitant visualization of two different dyes, one entrapped inside the vesicle and the other included in their phospholipid bilayer.
2.2 Techniques
2.2.1 Fluorescence Spectroscopy
2.2.1.1 Introduction
Fluorescence spectroscopy is a particularly important experimental technique to investigate chemical and biochemical systems, since it is non destructive, extremely sensitive and its time-scale (0.1-100 ns) is comparable to that of many biological processes (protein rotations, conformational fluctuations, etc.).
The phenomenon of fluorescence consists in the radiative decay of a molecular (or atomic) system, following the absorption of a photon from a luminous source. More in detail, when light of an opportune wavelength is absorbed by a molecule, resulting in a spectroscopic transition to a less stable, higher energy state, the dissipation of this excess energy can follow different competitive pathways: non-radiative (excited state reactions, collisions with the solvent or with other molecules, energy transfer) or radiative (fluorescence or phosphorescence). In the radiative decay, the relaxation to the ground state occurs through the emission of a photon (red-shifted with respect to the excitation wavelength, because of vibrational, and solvent relaxation in the excited state) (Lakowicz, 1983).
A fluorescence spectrum consists in registering the emission intensity of the sample at different wavelengths with a constant excitation radiation of opportune energy. Conversely, the excitation spectrum records the dependence of emission intensity at a single wavelength as a function of the excitation wavelengths.
A quantitative way to characterize the relative importance of the radiative relaxation pathway is the so-called quantum yield (q), which is defined as the ratio between emitted photons (nf) and absorbed photons (na):
NR R R a f k k k n n q + = = (2.2)
where kR and kNR are the rate constants for the radiative (fluorescence emission) and non radiative decay, respectively. Therefore, this quantity represents the probability that an excited system returns to the ground state by emitting a photon.
Experimentally, the quantum yield (q) is proportional to the ratio of the steady-state fluorescence intensity (F) emitted by the probe to its absorbance (A):
A
F
q
∝
(2.3) Therefore, q is determined by using a fluorescent standard whose quantum yield is known and whose emission spectral properties closely match those of the material under investigation (IUPAC, 1988). The quantum yield of the sample is then operationally defined as:2 2 st st st sample st sample sample sample n F q n A A F q = (2.4)
where q is the quantum yield, A is the absorbance at the excitation wavelength,
F is the integrated emission area across the band, n the refractive index of the
solvent and the subscripts sample and st refer to the sample and to the standard, respectively.
Another important parameter is the fluorescence lifetime of the probe. When a population of identical fluorophores is excited by a short light pulse, the time evolution of the emitted intensity can be represented by a single exponential function: τ − + −
=
=
o t t k k oe
F
e
F
t
F
(
)
( R NR ) (2.5)where F0 and F(t) are the fluorescence intensities measured just after the pulse (at t=0 s) and a given time t, respectively. The fluorescence lifetime τ is the
average time that molecules spend in their excited state before returning to ground state; therefore, by definition, it is the reciprocal of the sum of the rate constants of all decay processes:
NR R k k + = τ 1 (2.6)
In the absence of non radiative decay, the fluorophore lifetime is called intrinsic lifetime and is given by:
Em R A k 1 1 0 = = τ (2.7)
where AEm is the Einstein’s coefficient for spontaneous emission. By combining equations (2.6) and (2.7) it can be shown that the quantum yield is related to the lifetime: 0 τ τ = + = NR R R k k k q (2.8)
2.2.1.2 Förster resonance energy transfer (FRET)
Among all the possible non radiative pathways, one is particularly important to study biological systems at a molecular level, namely Förster energy transfer. This process consists in the transfer of excitation energy from a fluorophore in the excited state (donor) to a chromophore in its ground state (acceptor) without any emission or absorption of photons: it is caused by a resonance phenomenon due to the dipolar interaction between the donor and acceptor molecules. In order for this resonance to occur, it is necessary that the emission spectrum of the donor overlaps (at least partially) to the absorption spectrum of the acceptor. Being a stochastic process with a probability depending on the distance and mutual orientation between the two chromophores, energy transfer provides structural information on the sample under investigation (Lakowicz, 1983).
The energy transfer efficiency EFRET, defined as the probability that an excited donor relaxes to the ground state by non radiative energy transfer, can be expressed as: 0 D ET ET FRET k k k E + = (2.9)
where kET is the rate constant for energy transfer while 0
D
k is the rate constant
for all the other decay pathways, which take place also in the absence of acceptor molecules.
According to Förster theory (Förster, 1948), the dependence of the energy transfer efficiency on the structural parameters can be expressed as:
1 6 0 2 3 2 1 − + = R r EFRET κ (2.10)
r being the distance between the donor and the acceptor and κ2 a parameter
depending on their mutual orientation, which, in the case of fast rotation of the probes, averages to 2/3; R0, called Förster radius, is the characteristic distance corresponding to 50% energy transfer efficiency (for κ2=2/3). It is defined as:
6 1 0 4 0 3 2 ⋅ ⋅ ⋅ = n− q J R α D (2.10)
where α is a constant (8.8 10-25 M cm3), n is the refractive index of the medium, 0
D
q is the quantum yield of the donor when no acceptor is present and J is the superposition integral between the fluorescence spectrum of the donor
(FD) and the absorption spectrum of the acceptor (εA = molar extinction coefficient), weighted by λ4 (λ being the wavelength of the radiation):
( ) ( )
( )
∫
∫
∞ ∞ = 0 0 4 λ λ λ λ λ ε λ d F d F J D A D (2.11)Experimentally, energy transfer efficiency can be measured both by steady-state and time-resolved fluorescence. Förster efficiency can be expressed as:
0 0 1 1 D A D D A D FRET q q E τ τ − = − = (2.12) A D q ( A D τ ) and 0 D q ( 0 D
τ ) being the donor quantum yields (lifetimes) measured in the presence and in the absence of the acceptor, respectively. If the energy transfer acceptor is a fluorophore, steady-state FRET efficiency can also be experimentally determined by measuring the increase of its emission signal after interaction with the donor. In particular, when donor molecules are absent, the acceptor fluorescence intensity (at the excitation wavelength used in FRET experiments) is:
A A A q A
F0 ∝ (2.13)
where qA and AA are the quantum yield and the absorbance of the acceptor
respectively, and the superscript refers to the absence of donor.
In the presence of donor molecules, this quantity increases, due to energy transfer according to:
D A FRET A A D A q A E q A F ∝ + (2.14) Here D A
F is the fluorescence intensity of acceptor in the presence of donor
molecules and AD is the absorbance of the donor at the excitation wavelength. Combining equations 2.13 and 2.14, one can easily obtain the relative increase in the acceptor fluorescence as a function of transfer efficiency:
FRET A D A A D A FRET A A A D A E A A A q A q E A q F F + = + = 1 0 (2.15) 2.2.1.3 Anisotropy measurements
In this technique the sample is excited by linearly polarized light: the probability of excitation of a given molecule is proportional to cos2θ (where θ is the angle between the excitation transition dipole of the probe and the polarization direction). Consequently, a “photoselection” is performed, and the excited molecules have their transition dipoles oriented preferentially in the direction of the excitation radiation. The emission photons have a polarization direction that is again distributed with a cos2θ law with respect to the emission
transition dipole orientation. Therefore, in the absence of diffusional motions, the emitted light is anisotropic: the fluorescence polarized parallel (I ) with //
respect to the excitation polarization direction is more intense than the perpendicular one (I⊥) (Stella, 2000).
To characterize on a quantitative basis this phenomenon, an experimental observable called fluorescence anisotropy (r) is introduced:
⊥ ⊥ + − = I I I I r 2 // // (2.16)
For a completely polarized fluorescence I⊥ =0 and therefore r = 1, while for depolarized fluorescence I// = I⊥and hence r = 0.
Actually, the maximum observable anisotropy (called fundamental or limiting anisotropy and observable by performing measurements on a diluted sample in glycerol at –20 °C) is <1, and in particular is defined as:
(
)
5 1 cos 3 2 0 = ϑ− r (2.17)ϑ being the angle between the absorption and emission transition dipoles of the fluorescent probe: in the case of parallel transition dipoles (ϑ=0) a limiting value of 0.4 is obtained.
The emission can be depolarized by several phenomena, like diffusive motions during the lifetime of the fluorophore excited state, so that the observed anisotropy is generally lower than its limiting value. As the extent of the diffusive motions depends on the viscosity of the solvent and the size and shape of the diffusing species, the measurement of anisotropy provides an estimate of the dimensions of the fluorophore or of the molecule the probe is linked to.
In particular, in the simplest case in which a molecule is assumed to be a rigid sphere with a mono-exponential intensity decay, anisotropy is given by the Perrin equation: r r r ϕ τ + = 1 0 (2.18) where τ is the fluorophore lifetime and ϕr is the rotational correlation time,
which can be computed from the Stokes-Einstein equation:
kT V
r η
ϕ = (2.19) Here, V is the volume of the solvated molecule and η the viscosity of the solution.
2.2.1.4 Instrumental apparatus
Excitation and emission spectra, and anisotropy values were obtained by steady-state fluorescence experiments on a thermostatted Spex Fluoromax spectrofluorimeter (Edison, NJ, USA) operating in a single photon counting mode. Anisotropy experiments were performed by equipping the spectrofluorimeter with Glan-Thomson polarizer prisms.
Time dependent fluorescence decays were recorded on a thermostatted CD900 time-correlated single photon counting (TCSPC) apparatus (Edimburgh instruments). This technique is a statistical sampling method based on the stochastic nature of fluorescence emission, which requires that a single photon be detected after each excitation pulse.
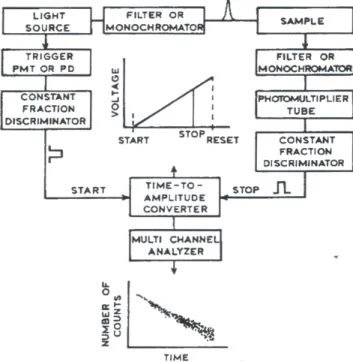
A schematic illustration of the instrument is reported in Figure 2.3.
Figure 2. 3 Schematic illustration of the time-correlated single photon counting apparatus.
The sample is repetitively excited using a pulsed light source (a flash-lamp filled with ultrapure hydrogen 0.3 bar, 30KHz repetition rate, full width at half maximum: 1.2 ns). Each pulse is optically monitored by a high speed photomultiplier (PMT) to produce a start signal, which is used to trigger the voltage ramp of the time-to-amplitude converter (TAC). The voltage ramp is stopped when the first fluorescence photon from the sample is detected. It must be stressed that, to avoid pulse pile-up effects which would distort the signal, biasing the decay to shorter times, only one or two photons every hundred exciting pulses should be detected. The TAC provides an output pulse whose voltage is proportional to the time between the start and the stop signal. A multichannel analyser (MCA) converts this voltage to a time channel using an
analog to digital converter. Summing over many pulses the MCA builds up a probability histogram of counts versus time channels.
In order for the probability distributions to be statistically significant, the experiment is continued until one has collected at least 104 counts in the peak
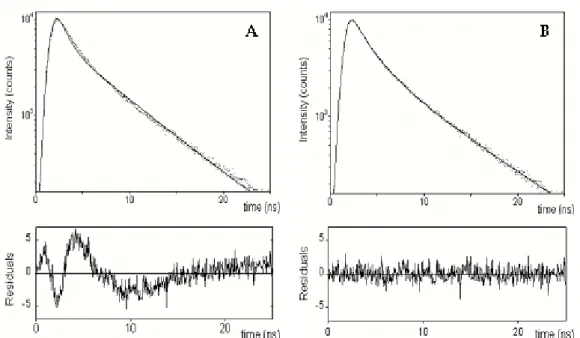
channel. Under this conditions, the histogram of photon arrival times represents the intensity decay of the sample. However, due to the light pulse having a finite width, the observed decay (here called R(t)) is the convolution of the “true” intensity decay of the sample (I(t)) and the instrument response function (the “Lamp” profile, L(t)):
∫
− ′ ′ ′ = t t d t I t t L t R 0 ) ( ) ( ) ( (2.20)In the common practice, the a posteriori analysis of the results of a time-dependent experiment (to obtain the number of different species, their lifetimes and relative populations) is carried out by performing the so-called iterative reconvolution. This technique relies on choosing a suitable test function with adjustable parameters (Ic) and iteratively varying the values of the parameters until a minimum of the function χ2 is reached. χ2 is defined as:
[
]
∑
= − − − = χ nt t R t R t R m n 0 2 2 ) ( ) ( ~ ) ( 1 1 (2.21)where R~(t) is the reconstructed decay profile obtained after convolving the test
function Ic(t) with the lamp profile, m is the number of fitting parameters and
the summation is performed over the n collected data points. In particular, the fluorescence decay of many heterogeneous samples (see Section 3.2.2) can be expressed as a sum of exponential functions, so that Ic(t) is given by:
∑
= τ − α = 0 1,2,3,... ) ( n i t i c t I e i I (2.22) where τi are the fluorescence lifetimes of the individual emitting species.However, it has been demonstrated that, for the accurate recovery of complex time-resolved experiments, it is advantageous to combine more than one fluorescence decay curve into a single analysis. The simultaneous analysis of multiple decay experiments is referred to as “global analysis” (Knutson et al., 1983; Beechem et al., 1991). Global analysis procedures are of significant advantage when some unknown parameters of interest are linked between two or more fluorescence decay experiments performed under different conditions (e.g. temperature, excitation/emission wavelengths, etc.). These parameters, which are invariant in all data sets, are called global parameters. The decay parameters αi and τi are then obtained minimizing global χ2, defined as:
[
]
∑∑
= = − − − = χ exp 1 0 2 2 ) ( ) ( ~ ) ( 1 1 N i n t i i i t R t R t R m N (2.23)Here R(t) and R~i(t) are the observed and reconstructed decay profile for the
ith experiment, m is the number of fitting parameters and N is the total number of data points.
Global analysis results in a much steeper χ2 surface with respect to individual
decay analysis and, as a consequence, in a higher probability of recovery of the correct fitting parameters.
Analysis of experimental data has been performed with the software provided by Edimburgh Instruments.
2.2.1.5 Experimental details
Peptide adsorption on cell walls (see Section 3.2.1). Quartz and poly(methylmethacrylate) cuvettes were treated with a 5% (weight/weight) solution of poly(vinylalcohol), poly(ethyleneimine) or poly(ethyleneglycole), overnight. Before use, cuvettes were then thoroughly rinsed with deionized water. Peptide adsorption was quantified by the decrease in emission intensity with time, after the fluorescent analog F10 was dissolved in water from a concentrated methanolic solution (final concentration1 µM). λexc = 265 nm, λem
Lipid flip-flop (see Section 3.7.3). Peptide-induced lipid flip-flop was determined by adding bovine serum albumin (BSA; final concentration = 0.2 mM) to a solution of C6-NBD-PC labeled liposomes (1% molar ratio; total lipid concentration = 0.2 mM). This caused the extraction of C6-NBD-PC molecules located in the outer layer, resulting in a quenching of the NBD fluorescence intensity. After equilibration, a given peptide concentration was added. If this caused lipid flip-flop, C6-NBD-PC becoming exposed to the outer layer could be extracted by BSA, and a further decrease in fluorescence intensity would be observed.
NBD fluorescence was excited at 467 nm, and BSA binding was monitored by measuring NBD fluorescence at 522 nm.
Iodide quenching experiments (see Section 3.8.1). Iodide quenching experiments were performed by titrating a liposome solution 2 mM in lipid, containing 1.0 µM of F10 or A3, with small aliquots of a concentrated iodide solution ([KI] = 4M) prepared on the same day, containing also Na2SO3 1 mM,
which prevents iodide oxidation to iodine.
Samples were excited at 280 nm, and emission was measured at 304 nm for fluorene and 382 nm for azulene.
Depth dependent quenching experiments (see Section 3.8.2). Quenching experiments using dibromide derivatives were performed with liposomes entirely composed of ePC phospholipids marked with bromine atoms. The relative amount of dibrominated lipids was the same for all three products, as demonstrated by HPLC-MS experiments performed in the manufacturer’s laboratory (Avanti Polar Lipids, Alabaster, AL, U.S.A).
Doxyl-containing liposomes were formed by ePC:Cho 1:1 molar ratio with a 7% of labeled lipids (the doxyl moiety is a much more effective quencher of our fluorophore than bromine). The spin label content was determined by double integration of EPR spectra (Chattopadhyay and London, 1987) performed both on the stock solutions of labeled lipids, and directly on an aliquot of the final
liposome solutions (~ 5mM, total lipid concentration), diluted 1:10 with isopropanol. All vesicle preparation contained the same amount of spin labels, within a 10% error.
All depth-dependent quenching experiments (both using dibromide- and doxyl-derivatives) were performed by adding peptide analogs to the different labeled liposomes and to a reference unlabeled liposome solution. The fluorescent analogs were excited at 290 nm (cut-off filter at 295 nm) and, after a 20 minutes equilibration period, the emission spectra were collected between 300 nm and 400 nm (F10) or between 350 nm and 450 nm (A3).
2.2.2 UV-Vis Absorption
UV-Vis Absorption spectra were recorded on a thermostatted J7850 Jasco apparatus (Tokio, Japan).
The concentration of fluorescent peptide analogs was determined by measuring the absorbance of the chromophores linked to the peptide chain (λ=301 nm for Fmc and λ=343 nm for Aal) and comparing it to the corresponding calibration curves (Fmc: ε(301 nm) = (6.3±0.1) 104 M-1cm-1; Aal:
ε(343 nm)= (4.3±0.1) 104 M-1cm-1)
2.2.3 Circular Dichroism (CD)
Circular dichroism is probably the most used spectroscopic technique for the investigation of the secondary structure of peptides and proteins. It consists in measuring the differential absorption of right- and left-circularly polarized UV (or visible) light by dissymmetric molecules. In particular, the main structural information for peptides are obtained in the far UV region (180-250 nm), where the n→π* and π→π* transitions of the amidic bond occur. This signal is strongly dependent on the backbone conformation (Cantor and Schimmel,1980).
When aromatic compounds or other chromophores are linked to the peptide chain, further structural information can be obtained by examining their CD (λ>240 nm): even if these groups are intrinsically not chiral, they can show an induced dichroism due to electronic interactions with the dissymmetric environment.
Based on these considerations, CD was used to determine trichogin secondary structure both in solutions and in the membrane phase. Experimentally, we performed our measurements a thermostatted Jasco J600 apparatus (Tokio, Japan) using quartz cuvettes of 1 mm path length in the far UV region, and 1cm path length for measurements in the aromatic region. 8 scans were recorded during the acquisition of each spectrum, in order to maximize the signal to noise ratio, and an a posteriori correction for the background signal was performed, by subtracting the spectrum of a blank solution. Additionally, measurements on large unilamellar vescles (see Section 3.5.1) were carried out at a 1 mM lipid concentration, where the effect of light scattering by liposomes is negligible, as confirmed by recording the spectrum of liposomes alone and by the independence of the signal on the distance between the sample-holder and the detector (Mao and Wallace, 1984).
2.2.4 ATR-FTIR
Attenuated total reflection Fourier transform infrared (ATR FTIR) is one of the most powerful methods for recording IR spectra of biological materials like membranes. It requires few micrograms of sample, and provides information about the conformation and orientation of proteins and peptides in a lipid environment. Because of the long IR wavelength, light scattering problems are virtually non-existent, and highly aggregated molecules or large membrane fragments can be investigated (Tamm, 2002).
In an ATR-FTIR experiment, an internal reflection prism (in our case made of germanium) is covered with single or multiple lipid layer(s) containing the proteins or the peptides, and the infrared beam is focused into the plate (Figure 2.4).
Figure 2.4 Schematic representation of an ATR-FTIR experiment on supported lipid bilayers containing peptides. The incident (i) IR beam propagates via multiple internal reflections within the trapezoidal ATR germanium plate.
The light is propagated into the crystal by multiple internal reflections until it exits to the detector. Wherever the light is reflected, it creates an evanescent field outside the plate, which decays exponentially within a distance comparable to the wavelength used. Absorption of the energy of the evanescent field by the supported membrane (and peptide) provides spectra, which in general are very similar to those obtained with a transmission geometry.
Infrared spectra of proteins and polypeptides exhibit a number of so-called amide bands, which represent different vibrations of the peptide moieties. The amide I normal vibrational mode is the most widely used to study the peptide secondary structure. It originates from the C=O stretching vibration of the amide group (coupled to the in-phase bending of the N-H bond and the stretching of the C-N bond) and gives rise to infrared band(s) in the region between approximately 1600 and 1700 cm-1. The location of the amide I maximum depends on the pattern of hydrogen bonding and on the orientation and distance of interacting dipoles and thus it provides information about the geometrical arrangement of peptide groups in a polypeptide chain. The relationship between the position of the amide I and the type of secondary structure has been recognized by analyzing IR spectra of peptides that fold into well-defined structures (Haris and Chapman 1995). Typical absorption frequencies for α-helices and 310 helices are 1650-1660 cm-1 and 1660-1670
cm-1, respectively (Jackson and Mantsch, 1992; Gazit, 1996). In the presence of
water or water vapor, the random coil signal falls at the same frequency of the α-helix, hindering an univocal identification of the secondary structure. Substitution of water with D2O causes the substitution of amide protons with
deuterons in the peptide in random coil conformation, shifting their amide I absorption to lower frequencies (∼1640 cm-1).
Experimentally, all the spectra have been recorded on a Nicolet FT-IR (Thermo Electron Co., Madison, WI, U.S.A.) equipped with an ATR germanium cell (12 total reflections on the film side at an incidence angle of 45°C). The ATR element was modified, placing over the plate a homemade gas-tight cover, containing a holder for D2O, in order to saturate the compartment with D2O
vapors and allow the exchange with water.
In particular, a 200µL droplet containing 13.16 mM POPC and 0.05:1 peptide in CH3Cl/MeOH 1:1 (v/v) was deposited onto the surface of the germanium
crystal (preventively treated with a basic detergent in order to increase its hydrophylicity), taking care to make the film as uniform as possible. The solvent was then evaporated using a gentle argon flow. While evaporating, capillary forces flatten the membranes which spontaneously form oriented bilayers.
512 interferograms were accumulated at a resolution of 2 cm-1 and the resulting spectrum was background-corrected by subtracting the signal of the empty cell.
2.2.5 Stopped flow
Stopped-flow allows the kinetics of a reaction to be followed continuously in the millisecond to second time scale, after rapid mixing of the reactants.
A schematic representation of the instrument is shown in Figure 2.5.
Figure 2.5 Diagrammatic representation of the stopped-flow method. The arrow represents