ALMA MATER STUDIORUM
UNIVERSITA' DI BOLOGNA
SCUOLA DI SCIENZE
Corso di laurea magistrale in Biologia Marina
Bioaccumulation of copper (CuONPs vs ionic Copper) from sediments in the clam
Scrobicularia plana
Tesi di laurea in Adattamenti degli Animali all'Ambiente Marino
Relatore Presentata da
Prof.ssa Elena Fabbri Silvia Scola
Correlatore
Dott.ssa Olivia Campana
Dott. Julián Blasco
Table of contents
1 Introduction ... 3
1.1 Metal contamination ... 3
1.2 Trace metal contamination ... 4
1.3 Copper ... 6
1.3.1 Effects on bivalves ... 6
1.3.2 Effects on human health ... 7
1.3.3 Nanoparticles ... 8
1.4 Study area ... 10
2 Aim of the study ... 13
3 Materials and methods ... 15
3.1 Particle characterization in filtered seawater of experimental conditions ... 15
3.2 Organism collection and acclimatization ... 15
3.3 Sediment collection, characterization and spiking ... 16
3.4 Experimental design ... 17
3.5 Sediment analysis ... 17
3.6 Interstitial water and overlying water analysis... 19
3.7 Bivalves analysis ... 19
3.7.1 Condition Index ... 19
3.7.2 Subcellular distribution... 20
3.8 Statistical analysis ... 21
4 Results and discussion ... 23
4.1 Size distribution of nanoparticles ... 23
4.2 Sediment... 24
4.3 Interstitial water and overlying water ... 26
4.4 Ionic and nanoparticle copper bioaccumulation ... 29
4.5 Condition Index ... 31
4.6 Subcellular distribution ... 33
4.7 Conclusion ... 37
Acknowledgments ... 39
1
Abstract
Sediments are considered a sink for metals, and nanoparticles transport in environmental is dominated by sedimentation. Consequently organisms that live in the sediments are more exposed to the risks related to exposure and toxicity of engineered nanoparticles (ENPs), especially deposit feeding invertebrates that have body surfaces in direct contacts with sediments and ingest huge amounts of sediment particles, due to the low source of food in sediments.
In this study was carried out a 30-day experiment on juveniles of Scrobicularia plana exposed to spiked sediments with two different forms of copper, ionic (CuCl2) and nanoparticle (CuONP), both with low and high exposure. The first aim of this study was to evaluate bioaccumulation kinetics of the two different forms of copper in S. plana, in terms of bioaccumulation in the whole tissue and subcellular fractionation. The second aim was to evaluate the Condition Index of S. plana using the dry flesh weight: dry shell weight ratio condition index. Results of the bioaccumulation kinetics show a significant contamination and bioaccumulation of copper in whole animal tissue, that increased over time; for both copper forms, the organisms exposed to the highest concentrations showed the highest values of metal accumulation. The subcellular fraction results were in agreement with those of the bioaccumulated copper in the whole tissue. The results indicate the ability of the bivalve to detoxify bioaccumulated copper and that the concentration of copper associated to the metabolic available fraction (MAF) increases significantly as the concentration of Cu increases in the sediment. Thus, S. plana bioaccumulates copper, and has the ability to regulate the MAF rather than the total accumulated metal.
Data on the Condition Index showed that the high CuCl2 treatment had a toxic effect on the physiological state of the organisms.
3
1 Introduction
1.1 Metal contamination
Metals contamination in the environment is a worldwide problem.
The origin of metals in marine sediments may be anthropogenic or natural and the importance depends on type and location of the metal. Moreover metals have a long biological half-life (Blasco et al., 2010).
Aquatic organisms can be often exposed to continuous or episodic metal contamination as a consequence of anthropic and natural factors. Magnitude, duration and frequency of the exposure influence the effects and the toxicokinetic processes, which regulate the intercellular concentration of metal ions into the organism (Santana et al., 2017).
Coastal ecosystems are among the areas most often affected by anthropogenic metal inputs. Fine particles of metals present in the water column are adsorbed by sediments, where they settle, and constitute a potential metal source in aquatic environments, also acting as carriers. Characteristics of the sediment, redox state, mineralogical composition, physical transport and adsorption/desorption processes affect the behaviour and fate of the metals.
A very relevant thing is that sediments are considered a sink for metals, for which changes like pH, dissolved oxygen and redox potential may lead to the metals remobilization to the overlying water (Blasco et al., 2010). Indeed sediments are used as monitoring tools and in the initial phase of environmental assessment of aquatic systems (Birch et al., 2001).
Another factor is the burrowing activity of macroinvertebarte organisms, that can impact the fluxes of particles and solutes from sediment to water. Deposit feeders ingest sediment which can represent up to the 100% of the metal body burden. This makes the metals available to marine organisms, for which can be toxic, and becoming part of the food chain can have repercussions on human health (Blasco et al., 2010). In aquatic organisms there are two ways to regulate essential metal, like copper: the first one provides for the limitation of metal uptake at the body concentration level, the second one acts on specific accumulation strategies and on active elimination of the metal excess or its storage as inert form. This strategies include extracellular, like
metal-4 rich granules, and intracellular, like lysosome or metallothionein-like proteins, structures that sequester metals in a detoxified form (Santana et al., 2017).
To determinate trace metal pollution in the aquatic environment are often used mollusc as indicators, because the metals concentration in the organisms or in a part of them is considering as a measure of the metals concentration in the environmental (White & Rainbow, 1985).
1.2 Trace metal contamination
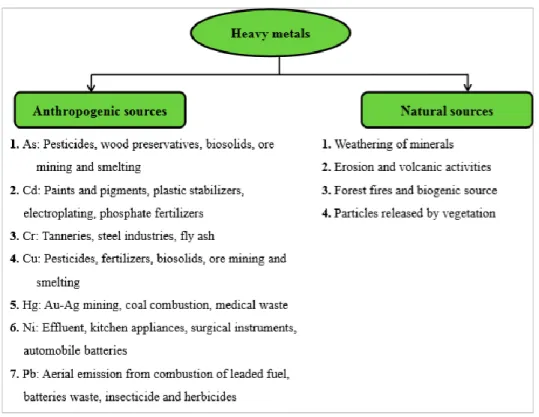
The release of trace metal into the soil and waters it is considered a serious problem due to the fact that they cannot be broken down to non-toxic forms and for this reason they have long-lasting effects on aquatic ecosystem. Metals like copper, silver, zinc, nickel, cadmium, mercury, selenium, chromium, arsenic are toxic even at very low concentrations. The natural sources of trace metal correspond to pedogenetic processes of weathering of materials (Fig. 1.1), and the most significant sources are erosion, weathering of minerals and volcanic activity. The anthropogenic sources are electroplating, use of pesticides, mining, biosolids, phosphate fertilizer discharge and smelting. The excess generation of metal by natural and anthropogenic sources makes theme become contaminants (Dixit et al., 2015).
5 Aquatic invertebrates accumulate in their tissues both essential and non-essential trace metals. The concentration of trace metal in tissue depends on the surrounding aquatic medium and bioavailabilities of the metal in water and diet, as well as on the ability of detoxification of the animal species.
According to the species they accumulate trace metals in different concentrations, depending on the specific tissue and specific species. Indeed an accumulated trace metal body concentration can be very high for an organism and very low for another. For this reason, the concentration of trace metals of species, even within closely related taxa, living in the same habitat may be very different, thus it is not possible to estimate an absolute scale.
The physiology of the animal affect also the fate of trace metal, along with how the organism used it for an essential metabolic purpose, excreted it or stored it in the body. Trace metals normally have an affinity for nitrogen and sulphur, and many proteins contain one or both of them. This characteristic and their potential to bind to molecule with an affinity for that metal make them potentially toxic, and prevent proteins or other molecules from perform the metabolic functions.
When a trace metal enters an organism is ‘metabolically available’. Subsequently it is excreted or is bound to a particular molecule that chelates it. In this way the trace metal is for example trapped through the binding to proteins like metallothioneins. Even when the trace metal is an essential one, a further accumulation of it in metabolically available form can be toxic, with initially sublethal effects but eventually lethal effects.
Organisms can accumulate two different forms of trace metal: metabolically available form, which can cause toxic effects to the organism, and metabolically detoxified form, in which the metal has been detoxified and is no longer available for metabolic processes thus represents no danger to the animal. The beginning of toxic effects depends only on the concentration of metal in metabolically available form.
The uptake of metals may changes over time if ambient bioavailabilities change and, consequently, the accumulation of trace metals by the organisms changes. For this reason, when the rate of metal uptake into the organisms exceeds the combined rate of excretion and detoxification of metabolically available form, the organisms suffer toxic effects (Rainbow, 2002).
There are many techniques to remove trace metals from contaminated water bodies and land, such as oxidation or reduction, reverse osmosis, filtration, chemical precipitation, ion-exchange, evaporation, technology and electrochemical treatment. The problem is
6 that most of these techniques needs concentrations of trace metals with a value of at least 100 mg/L, and physico-chemical methods with very low concentrations result ineffective or expensive. Since most trace metal salts are soluble in water they cannot be separated by physical separation methods. An alternative to remove trace metal could be biological methods, such as biosorption and bioaccumulation (Dixit et al., 2015). Indeed, bioaccumulation of trace metal in organisms tissue can indicate trophic transfer of contaminants (Riba et al., 2005).
1.3 Copper
Copper (Cu) is an essential trace element presents in small quantities in various tissues and cells and the maximum concentration is in the liver. Ions of copper can be found in oxidized (Cu2+) or reduced (Cu+) state. The concentration of copper in freshwater is between 4 and 10 µg Cu/L, where Cu is mostly bound to organic matter, and that presents in soil is approximate to 50 ppm Cu.
In atmosphere the copper range is from 5 to 20 ng Cu/m3 and derives from both natural sources, as volcanoes, forest fires and windblown dust, and anthropic sources, as municipal incinerators, Cu smelters and steel and iron production (Gaetke et al., 2003).
1.3.1 Effects on bivalves
In aquatic organisms the availability of trace metals is influenced by the metal's chemical speciation and toxicity of metal is associated more to ion activity than total metal concentration. In studies on bivalve molluscs, however, the trace metals chemical speciation usually is not considered.
Copper is an essential trace metal used by organisms for growth and development, but can become toxic at high levels decreasing the animal resistance to environmental stress and altering productivity.
Copper can be transported directly across external cell membrane as free ion (Cu(H2O)62+) or as inorganic complex species (e.g. CuCl+, CuOH+, CuCO3), or can bind to ligand sites at cell surfaces exposed directly to media and subsequently pass into the tissues with a copper rate of passage proportional to the quantity bound to membrane sites that is related to cupric ion activity in the external medium.
7 In marine and estuarine waters copper is highly complexed and many studies have shown the importance of free metal ion activity in terms of toxicity and availability of trace metals (Zamuda and Sunda, 1982).
Bivalves are commonly used in monitoring programs to study trace metals pollution of coastal marine ecosystems for their characteristics such as the high filtration rate, the capacity to accumulate vast range of contaminants, the wide distribution due to being sessile, the important ecological role and commercial interest.
Studies on bivalve molluscs exposed to metals, as copper, found alterations of the immune surveillance in terms of hemocytes, that have an important role in digestion, internal defence, shell repair and excretion. Toxic effects on hemocytes have an impact on animal survival because they represent the major defence against pathogens and foreign materials.
Hemocytes accumulate high levels of metals mostly in lysosomes that lead to an alteration of integrity of lysosomal membranes and a consequent cell damage due to the release of hydrolases, normally used to degrade exogenous materials out of cells.
Hemocytes exposed to copper show a significant dose-dependent decrease in the phagocytic activity.
Another effect that has been observed is the peroxidation of membrane lipids that is probably mediated by reactive oxygen species whose levels are increased by trace metals (Matozzo et al., 2001).
1.3.2 Effects on human health
In the human body the absorption of copper depends on the chemical form and the presence of other dietary components.
Copper is used in many industrial and craft sectors, as construction, military armaments, transportation, cosmetic, mechanical, jeweller and also in dental products, but copper exposure through these items is not harmful.
Copper is adsorbed in the small intestine, 30-50% of that ingested, and a much smaller part in the stomach. Copper binds mainly with albumin but also with transcuprein and is transported in the blood.
The copper present in the liver might be secreted into plasma, excreted in bile or stored in the hepatocytes, where is mainly bound to metallothionein, to prevent cytotoxicity, or
8 synthesized into cuproenzymes. A liver normally contains from 18 to 45 µg Cu/g dry weight and the blood approximately 6 mg Cu/ kg.
Humans can control excess amounts of copper in the body increasing excretion or decreasing absorption, indeed chronic and acute toxicity effects are quite rare, also because the quantity of copper ingested by food and water is low. The copper toxicity arises when the body is exposed to excess concentrations due to environmental contamination, occupational hazard or accident, or for inborn errors of Cu metabolism. The liver is the first organ to be affect by chronic effects because once copper is entered in the blood it is deposited there, indeed the first expression of intoxication is the liver cirrhosis, with hemolysis and damage to renal tubules, organs and brain. Subsequently may occur coma, vascular collapse, hepatic necrosis and lastly death.
Symptoms of acute gastrointestinal effects are caused by the ingestion of contaminated food or water.
Copper intoxication can cause effects as anorexia, lethargy and weakness in the early stages, and erosion of the epithelial lining of the gastrointestinal tract, hepatocellular necrosis in the liver and acute tubular necrosis in the kidney.
In an untreated adult the estimated lethal dose of copper corresponds to 10-20 g into the body (Gaetke et al., 2003).
1.3.3 Nanoparticles
The use of engineered nanoparticles (ENPs) in nanotechnologies has led to new industrial and business opportunities (Buffet et al., 2011). Their small size, three dimensions ≤ 100 nm, the large surface area to volume ratio which gives physicochemical properties (Volland et al., 2018) distinct from their bulk counterparts (Buffet et al., 2011) and electrochemical properties, as well as being useful for industrial materials (Hanna et al., 2013), makes them concern due to the consequently discharge into freshwater and marine environmental (Baker et al., 2013).
Nanoparticles transport in environmental is dominated by sedimentation due to their tendency to create aggregates of particles (> 1µm). In this way sediments act as purifiers of water body accumulating contaminants from surface water (Dedeh et al., 2014). Consequently organisms that live in the sediments are more exposed to the risks related to exposure and toxicity of ENPs (Hanna et al., 2013), especially deposit feeding
9 invertebrates that have body surfaces in direct contacts with sediments and ingest sediment particles (Pang et al., 2012).
In the marine food web most organisms are both prey and predators which means that tropic accumulation can be from and to different sources.
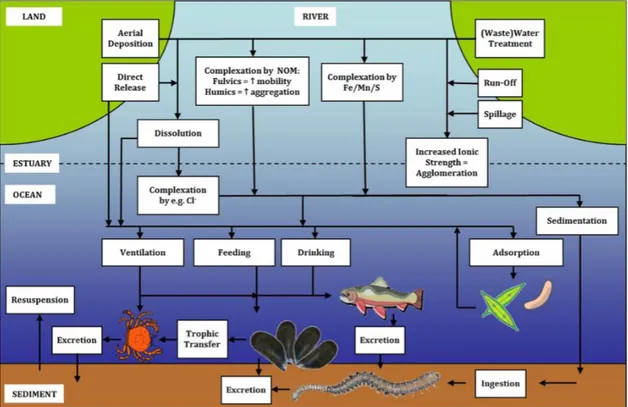
NPs along the course of the river are complexed into aggregates arriving to estuaries and ocean where is promoting a rapid sedimentation becoming available for in-fauna and associated biota. Moreover nanoparticles can be resuspended in the water column (Fig. 1.2) (Baker et al., 2013).
It is difficult to identify and quantify nanoparticles in complex matrices, as sediment, water and soils, and in organisms for lack of monitoring data, and the majority of studies probably are unrealistic because they were conducted with high NPs concentrations (Buffet et al., 2011).
Fig. 1.2. Trophic transfer in the marine environmental (image from Baker et al., 2013).
In particular, copper oxide (CuO) NPs are used in a whole variety of industrial and consumer applications (Volland et al., 2018) as bacteriocides, a heat transfer fluid in machine tools for the excellent thermal conductivity of nanofluids, and to replace noble metal catalysts for carbon monoxide oxidation (Buffet et al., 2011).
10 Surface area of CuO NPs bear the potential for particle-specific effects and increased interaction with biological systems, and for this reason there is an interest in ecotoxicology due to the increasing of its bulk form.
The effects of CuO NPs toxicity is similar to effects of Cu toxicity, forming ROS (Reactive Oxide Species), causing DNA damage and inflammatory responses.
The composition of the exposure media, in terms of ionic strength, pH and presence of organic matter, and the particle characteristics, in terms of coating, size, surface charge and shape, influence CuO NPs chemical and physical transformations (Volland et al., 2018).
1.4 Study area
Rio San Pedro is a salt marsh creek located in the south west of Spain inside the area of Bay of Cadiz. In 1996 it has been qualified as Natural Park, indeed it is very important ecological site.
In Rio San Pedro the water column is well mixed and the maximum depth of the creek is 4-5 m presenting a semi-diurnal tidal regime. The height of tidal column varies from 3.5 m at spring tide to 0.5 m at neap tide.
This area has various uses as fishing boat anchorages, recreational shipping, urban centres, touristic beaches and semi-intensive marine fish aquaculture (Fig.1.3) (Silva et al., 2012a).
The highly productive for aquaculture and clam fishing combined with residential activities led to pollution of the coastal ecosystem due to untreated aquaculture waste waters from a fish farm situated in its upper part. The results of this pollution was an organic enrichment that led to low pH and higher levels of nutrients, particulate organic matter, suspended solids, and metals (Silva et al., 2012b).
The water renewal in the upper part is inconsistence because water input deriving from the Bay of Cadiz, thus the only inputs are rainwater and fish farm effluents (Silva et al., 2012a).
According to Tovar et al. (2000) acidic character of faeces and fish food and the high ammonium concentration caused the low pH values in the fish farm effluent and seasonal pattern of nutrients differs from that of coastal waters. Tovar et al. (2000) also defined two zones of water quality, one closer to the mouth long approximately 8 km
11 with a good water renovation controlled by the tides and without fish farms, the other with effects of the semi-intensive fish culture. The effluents of the second one represent the major source of organic matter, nutrients, and suspended solids in the ecosystem. The study of Mendiguchía et al. (2006) showed a significant enrichment in sediments of trace metals like Cu, Zn and Pb, and organic matter as a consequences of aquaculture effluents.
13
2 Aim of the study
Sediments are considered a sink for metals, and nanoparticles transport in environmental is dominated by sedimentation. Consequently organisms that live in the sediments are more exposed to the risks related to exposure and toxicity of ENPs, especially deposit feeding invertebrates that have body surfaces in direct contacts with sediments and ingest sediment particles.
Indeed bivalves are commonly used in monitoring programs to study trace metals pollution of coastal marine ecosystems for their characteristics.
A study of 3 years shows that S. plana has a potential as indicators of whole sediment toxicity (Byrne & O’Halloran, 2001).
The bivalve mollusc behaves like a facultative suspension feeder, surrounding its semi-permanent burrow during emersion periods and collects food by siphoning sediment from the surface and from subsurface sediments (Hughes, 1969), or like a suspension feeder during immersion period (Mouneyrac et al., 2014). They can also get part of its food by filtering the overlying water (Bryan and Uysal, 1978).
The habitat of S. plana are soft sediments of estuarine ecosystem and the animal can tolerate wide ranges in salinity (4–30 ‰). Bryan et al. (1980) have demonstrated that S.
plana accumulates heavy metal in an efficient way due to the slow rate of exchange of
metals with its environment (Byrne & O’Halloran, 2001).
The uptake of contaminants can be related to low source of food in sediments, which leads to the ingestion of huge amounts of sediment by animals (Mouneyrac et al., 2014). This species is not used in aquaculture and is very difficult to collect in the field. For this reason it is not routinely used for toxicity test in the research institutions. Other problems are the lack of pre-test history and the difficulty of determining the age class. Therefore, is not recommended the use of this specie as a routine bioassay organism, but is recommended as bioassay organism to evaluate the toxicity of field-collected sediments (Byrne & O’Halloran, 2001). For this reason S. plana has been chosen for this study.
The first aim of this study was to evaluate bioaccumulation kinetics of two different forms of copper, ionic (CuCl2) and nanoparticle (CuONP) in S. plana. The evaluation was made in terms of bioaccumulation in the whole tissue and subcellular fractionation, used to determine the implications on subcellular metal distribution in terms of metabolically available fraction and detoxified metal fraction. This choice was made
14 because a tissue-residual approach based on the total tissue could lead to mistakes caused by metal compartmentalization within extracellular and intracellular structures that sequester metals in a detoxified form (Santana et al., 2017).
The second aim was to evaluate the Condition Index of S. plana. In aquaculture condition indices are used for two purposes, an economic one to designate the quality of the product, and a ecophysiological one to indicate the apparent “health” of a stock describing the physiological activity of the animals as growth, reproduction or secretion, in a specific environmental.
There are two types of indices to evaluate the metabolic state of the animal. The first one is a static index, that is specific for a single point in time and represents the physiological state of the animal at a given moment. The second one is a dynamic index, that is determined over a period of time and represents the physiological changes in the individuals in a population.
The estimates of condition is facilitated in bivalves by presence of a large quantity of mineral shell and tissue body. A widely used condition index is the dry flesh weight : dry shell weight ratio, because it is easy to standardize and universal. Another important factor is that is possible to eliminate the bias due to water content fluctuations using dry tissue (Lucas and Beningeri, 1985).
The dry flesh weight : dry shell weight ratio condition index has been used in this study.
15
3 Materials and methods
3.1 Particle characterization in filtered seawater of experimental
conditions
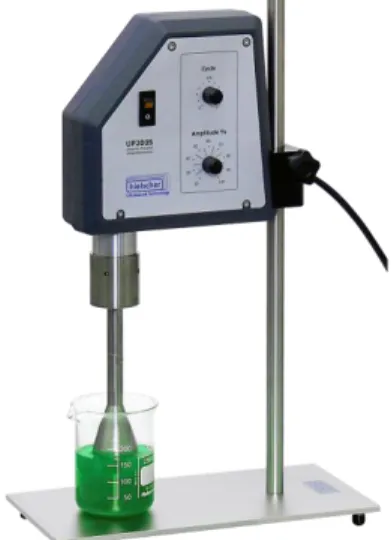
CuO NPs were purchased from Sigma-Aldrich (product number 544868-5G) with nominal size through Transmision Electronic Microscopy (TEM) < 50 nm and purity 99.99% . Size distribution and zeta potential of CuO NPs were analysed in deionized water and filtered seawater at 1 mg L-1 at 0h through Dynamic Light Scattering (DLS, Zetasizer Nano ZS90, Malvern Instruments, software version 7.10) (Fig. 3.2). The stock suspension of CuO NPs were prepared with ultrasonicator UP200S (hielscher Ultrasound Technology, Germany, 200W, 24 kHz) (Fig. 3.1) at amplitude of 50% and frecuancy of 0.5 over 5 min.
Fig. 3.1. Ultrasonicator UP200S Fig.3.2. Zetasizer Nano ZS90
(image from www.hielscher.com). (image from https://www.malvernpanalytical.com ).
3.2 Organism collection and acclimatization
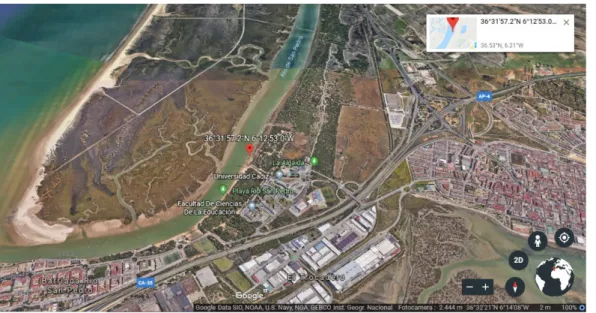
Juveniles of Scrobicularia plana were manually collected from an intertidal mudflat area located in Rio San Pedro (36°.53’25.46”N, -6°.21’47.29”W Cadiz, SW Iberian Peninsula) (Fig. 3.3) at the end of June 2018.
Bivalves were acclimated 4 days (pHwater 7.6 ± 0.04, DO 5.5 ± 0.2 mg L-1, temperature 19.8 ± 0.1 °C, salinity 33 ± 0.6; means ± SD) in a polypropylene tank with a
flow-16 through system and continually aerated . On the second day of adaptation the organisms were fed with plankton substitute (Tropic Marin®). After acclimatization bivalves were divided in size classes and only organisms with shell length ranging from 1.4 to 1.7 cm were selected.
Fig. 3.3. Sampling site in Río San Pedro (Cadiz, SW Iberian Peninsula).
3.3 Sediment collection, characterization and spiking
Sediment from a pristine site in Rio San Pedro (36°.53’25.46”N, -6°.21’47.29”W Cadiz, SW Iberian Peninsula) (Fig. 3.3) was collected at a depth of 0-3 cm and stored at 4ºC. Subsequently sediment was press-sieved through a 2.0 mm mesh to remove debris and macrofauna and stored at 4ºC in the dark for 26 days until spiking.
After thorough homogenization, two subsamples were collected after and before sieving and used for the geochemical characterization (humidity 55 ± 0 %, calcination 0.02 ± 0 %, density 1310 ± 64 g L-1, porosity 1564 ± 144 g L-1, organic carbon content 6 ± 0.3 %, particle size content 71 ± 0.01 %, fine fraction <63 µm 30 µg Cu g-1; means ± SD). Sediment was then spiked following the procedure described by Simpson et al. (2011) employing an aqueous stock solution of copper chloride (CuCl2) added on a per dry weight basis to the sediment to yield two copper concentrations of 50 (low) and 500 (high) µg Cu g-1 .
Suspension of CuO nanoparticles was prepared in 1L of deionized water and was subjected to a subsequent ultrasonic treatment with ultrasonicator UP200S (hielscher Ultrasound Technology, Germany, 200W, 24 kHz) (Fig. 3.1) at amplitude 50% and
17 frecuancy of 0.5 over 5 min. Sediment was thoroughly mixed several times each day for two weeks during which pH was monitored every day (7.2 ± 0.1; mean ± SD) and pH neutralization was considered unnecessary.
3.4 Experimental design
The experiment was conducted exposing the selected juveniles of S. plana during 30 days to spiked sediments into fifteen small tanks. Each tank contained 500g of sediment and 2L of water, collected from Rio San Pedro, with a ratio 1:4 (w/v).
The tanks were permanently aerated, pHwater, dissolved oxygen (DO), temperature and salinity were monitored every day and water was changed periodically (day -1, 3, 9, 15, 19, 23) to ensure oxygenation.
Five treatments, each one tested in triplicate, were set up simultaneously: 1) control, with uncontaminated sediment; 2) low CuCl2 exposure; 3) high CuCl2 exposure; 4) low CuO exposure; 5) high CuO exposure.
Forty test organisms were added each tank, with respectively 40 organisms in each one, at day 0 of the experiment.
Throughout the experiment sediment was sampled at day -1, 3, 15 (only 6 tanks with high concentration) and 28 (control and low concentration tanks) for the analysis of Cu concentration in the interstitial water and in the sediment. Cu concentration was also analysed in the overlying water sampled at day 0, 1, 5, 15, 28 and in the organism tissue sampled at day -1 (30 organisms from the acclimatization tank), 1, 5, 15, 28 (10 from each tank) after clams had been allowed to depurate 2 h in natural clean seawater. Physical variables (weight and length) of the sampled organisms were also measured for the calculation of the Condition Index.
Water and sediment samples were stored at -20 ºC until analysis.
3.5 Sediment analysis
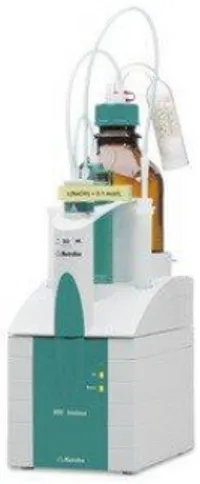
Sediment particle size was determined by wet-sieving through a 63 µm sieve using a small amount of deionized water. Particulate organic carbon (OC) content was determined by titration with ferrous ammonium sulphate 0.5 N employing 888Titrando analyser (Metrohm , USA) (Fig. 3.4). Cu concentration was measured in bulk sediment and in the <63 µm fraction after lyophilisation and subsequent digestion according to
18 the following procedure. Approximately 0.4 g of freeze-dried sediment and 0.2 g of
reference material MESS-3 (marine sediment) were digested using 3 ml HNO3
(Suprapur® Merck, Germany) and 9 ml HCl (Suprapur® Merck, Germany) in a Start D Milestone model microwave (Fig. 3.5), and made up to 50 ml with deionized water. Cu concentrations samples were then diluted twenty times with deionised water to avoid acid content >2% and analysed by inductively coupled plasma mass spectrometry (ICP-MS, iCAP Q, Thermo Fischer Scientific, Waltham, USA) (Fig. 3.6). For quality assurance, replicates were analysed for all samples. Acid-digest blanks and certified reference material were run with each batch of samples.
Copper concentration in the measured reference material was 38.58 ± 1.80 µg g-1 dry mass (mean ± SD; n=3) and in agreement with the certified value 33.9 ± 1.6 µg g-1 dry mass.
Fig. 3.4. 888 Titrando analyser Fig. 3.5. Start D Milestone model microwave (image from http://www. metrohm.com). (image from http://www.speciation.net).
19
3.6 Interstitial water and overlying water analysis
Interstitial water was extracted by centrifugation at 3000 rpm for 30 min. Both interstitial water and overlying water were filtered through 0.45 µm cellulose acetate filter (Sartorius Minisart, Sartorius, Goettingen , Germany) immediately after collection,
acidified with concentrated HNO3 (Suprapur® Merck, Germany) 2% (v/v) and stored at
4°C until analysis.
Copper concentrations in dissolved samples were analysed by ICP-MS (Fig. 3.6) after 1/20 dilution to reduce salinity.
3.7 Bivalves analysis
During the experiment a first sampling was made from the acclimatization tank at day -1 of 30 test organisms, of which 20 was used for Condition Index analysis and 10 was frozen for subcellular distribution analysis. In the others samples 10 organisms were collected from every tank, of which 5 were used for CI analysis and 5 for subcellular distribution analysis.
3.7.1 Condition Index
All fresh organisms were measured (shell length in mm) and weighed (dry and wet weight in g) after being dried with lab wipers to remove water excess. Subsequently soft tissue was removed, gently dried with a lab wipe, weighed and oven dried at 60°C for 24 h.
After 24 h dried tissue samples were weighed again to calculate the dry/wet weight ratio. Condition Index (CI) was determined as follows (Walne, 1976):
CI = [(dry flesh weight/dry shell weight) × 100]
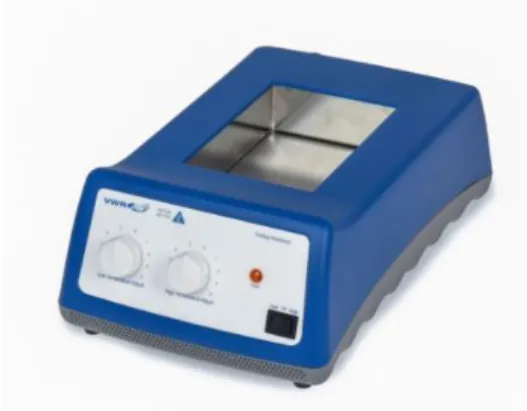
Approximately 0.3 g of tissue and 0.2 g of reference material ERM-CE278k (mussel tissue, JRC) were digested using 2 ml HNO3 and 0.5 ml H2O2 with a laboratory digestor block (Analog Heat Block, VWR) (Fig. 3.7) at 95 °C for 2 h, and made up to 10 ml with deionized water.
For the analysis of Cu concentrations, samples were previously diluted 10 times with deionised water to avoid acid content >2% and analysed by ICP-MS (Fig. 3.6).
20 Blank and reference material were run with each batch. Copper concentration in the reference material was 6.37 ± 1.66 µg g-1 dry weight (mean ± SD; n=5) in good agreement with the certified value of 5.98 ± 0.27 µg g-1 dry weight.
Fig. 3.7. Analog Heat Block, VWR (image from https://us.vwr.com).
3.7.2 Subcellular distribution
Tissue samples were thawed on ice and manually minced with a blade. Subsamples of approximately 0.1 g (wet weight) were separated and oven dried at 60 °C overnight, weighed to calculate the dry/wet weight ratio and subsequently digested.
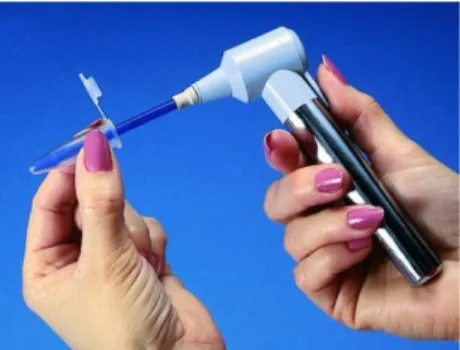
The rest of tissue (TM1) was homogenized on ice using a Pellet Pestle (Kontes) (Fig.
3.8) in Ca2+/Mg2+ Free Saline Buffer (360 mM NaCl, 20 mM HEPES, 12.5 mM KCl, 5
mM tetrasodium EDTA), adjusted to pH 7.4 at 4 °C; tissue-buffer ratio was adjusted to 1:10 (w/v).
Homogenated tissue was subjected to differential centrifugation following the procedure adapted from Taylor and Maher (2010). The first spin at 1000xg at 4ºC for 10 min gave supernatant S1 and pellets P1
Pellets P1 were oven dried at 60 °C for 60 min and spin at 10.000xg at 20°C for 10 min to yield supernatant S2 that represented nuclei and cellular debris fraction and pellets P2 that contained granules fraction.
Supernatants S1 were centrifuged at 10.000xg at 4ºC for 30 min to obtain supernatant S3 and pellets P3 that represented heavy organelles and mitochondria fraction. Subsequently, supernatants S3 were ultracentrifuged at 100.000xg at 4ºC for 60 min delivering supernatant S4 and pellets P4 that represented lysosome and microsome fraction.
21 Finally, supernatants S4 were centrifuged at 50.000xg at 4ºC for 10 min to yield supernatant S5 that contained the heat-stable proteins fraction (metallothionein and metallothionein-like proteins) and pellets P5 that contained heat sensitive proteins fraction (enzymes). All fractions were stored at 4ºC until analysis.
In order to determine Cu concentration in each fraction, samples were digested with 1 ml HNO3 and 200 µl H2O2 with a laboratory digester block at 90 °C for 2 hour, and made up to 5 ml with deionized water. Following, samples were diluted ten times and Cu concentrations were determined by ICP-MS (Fig. 3.6).
Blanks and reference material were run with each batch. Copper concentration in the reference material was 5.88 ± 2.15 µg g-1 dry weight (mean ± SD; n=11) in total agreement with the certified value of 5.98 ± 0.27 µg g-1 dry weight.
Fig. 3.8. Pellet Pestle (image from https://www.sigmaaldrich.com).
3.8 Statistical analysis
Statistical analysis were carried out with Statgraphics Centurion XVII computer software (Statpoint Technologies, Inc.) and graphs were made using Excel.
Data were tested for normality and homogeneity of variance (Levene test). Multiple Sample Comparison function was run to compare independent samples of variable data. ANOVA (F-test) or Kruskal-Wallis (H-test) tests were applied depending on the analysis of the statistical assumptions (normality and homoscedasticity). A post hoc Pairwise Multiple Comparison test, based on Fisher’s least significant (LSD) procedure for parametric analysis or on Bonferroni procedure for non- parametric analysis, was performed to compare between groups when the main test revealed statistical significant difference. Statistical significance was set at p ≤ 0.5.
23
4 Results and discussion
Physico-chemical variables were monitored every day during the experiment, and the average values corresponded to 8.0 ± 0.1 for pHwater, 6.1 ± 13.0 mg L-1 for DO, 22.7 ± 0.9 °C for temperature and 37.7 ± 1.3 for salinity (values are means ± SD).
4.1 Size distribution of nanoparticles
Size Distribution CuO NPs
size (nm) 0 2000 4000 6000 8000 10000 12000 % of I nt ensit y 0 2 4 6 8 10 12 14 Ultrapure water Filtered seawater
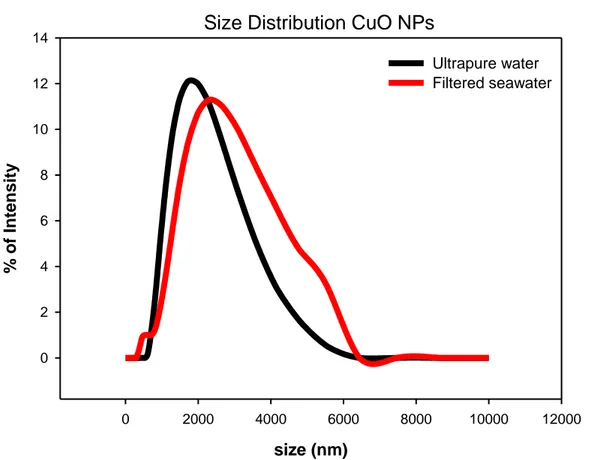
Fig. 4.1. Size distribution of CuO nanoparticles in the two media.
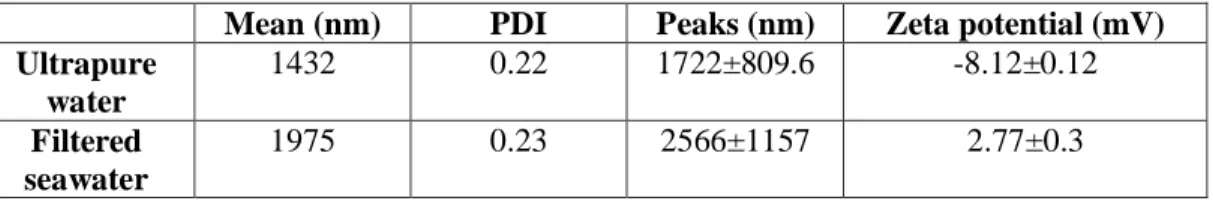
Size distribution of CuONPs employed in this study in ultrapure water and filtered seawater presented average values of 1432.0 and 1975.0, respectively (Fig. 4.1; Table 1). Zeta potential measurements showed that the particles are positively charged
(2.8 ± 0.3; mean ± SD) in filtered seawater, which supports the stability of the suspension, while in ultrapure water appear slightly negatively charged (-8.1 ± 0.1; mean ± SD), indicating a poor stability.
24
Table 1. DLS characterization of particles used in this study. Z-Average standard deviation is based on the respective mean Polydispersion Indices (PdI=(SD/Mean)2).
Mean (nm) PDI Peaks (nm) Zeta potential (mV)
Ultrapure water 1432 0.22 1722±809.6 -8.12±0.12 Filtered seawater 1975 0.23 2566±1157 2.77±0.3
4.2 Sediment
Fig. 4.2.1 Copper concentrations measured in the bulk sediment. Values are means ± SE; n= 3. -1, 15, and 28 represent days of sampling compared to day 0.
25
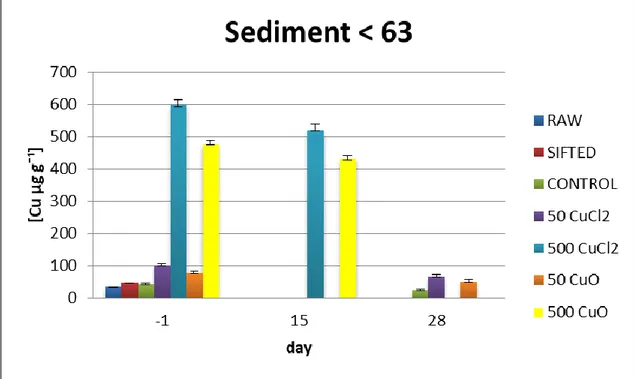
Fig. 4.2.2 Copper concentrations measured in < 63 µm sediment fraction . Values are means ± SE; n= 3. -1, 15, and 28 represent days of sampling compared to day 0.
Figures 4.2.1 and 4.2.2 showed copper concentrations measured in the bulk sediment and in the <63 µm sediment fraction for ionic (CuCl2) and nanoparticle (CuO) treatments during the experiment.
Copper concentration in the control bulk sediment and <63 µm sediment fraction presented an average values of 30.7 ± 1.2 µg g-1 and 33.8 ± 11.1 µg g-1 (means ± SD) with a maximum value of 32.3 µg g-1 and 45.2 µg g-1 at day -1, respectively.
The CuCl2 and CuO low treatments showed average values of copper concentrations of
77.2 ± 6.9 µg g-1 and 6.9 ± 10.8 µg g-1 (means ± SD) reaching a maximum value of 84.7 µg g-1 and 76.9 µg g-1 at day -1, respectively, and in the < 63 µm sediment fraction presented average values of 83.5 ± 19.3 µg g-1 and 63.8 ± 16.4 µg g-1 (means ± SD) with a maximum value of 102.2 µg g-1 and 87.3 µg g-1at day -1, respectively.
Lastly, the CuCl2 and CuO high treatments presented average values of 460.3 ± 89.3 µg g-1 and 388.1 ± 33.7 µg g-1 (means ± SD) with a maximum value of 615.7 µg g-1 and 430.1 µg g-1 (means ± SD) at day -1, respectively. In the < 63 µm sediment fraction concentrations corresponded to average values of 557.9 ± 49.9 µg g-1 and 454.1 ± 31.9 µg g-1 (means ± SD) reaching a maximum value of 639.7 µg g-1 and 485.2 µg g-1 at day -1, respectively.
26 The < 63 µm sediment fraction has higher copper concentrations in all treatments, due to the highest binding capacity of this fraction as result of the surface/volume ratio. According to a study of Simpson et al. (2011) on silty sediments (95–99% < 63 µm, 4–5% OC) presented acute and chronic thresholds of 510 µg Cu g-1 and 160 µg Cu g-1, respectively. Indeed copper concentrations in the control sediment were in agreement with the values proposed. Also low treatments for both ionic and nanoparticle copper treatments, presented values in agreement whit the study of Simpson et al. (2011). On the other hand, in the high treatments for both copper forms, concentration were higher compared to both acute and chronic thresholds. Moreover, all clams in the CuCl2 high treatment, which reached highest copper values, died at day 14, and mostly of the specimens of CuO high treatment died at day 15, confirming the toxic effects of these copper concentrations to benthic invertebrates in aquatic environmental.
4.3 Interstitial water and overlying water
Fig. 4.3.1. Copper concentration measured in interstitial water.
Values are means ± SE; n= 3. -1, 3, 15, and 28 represent days of sampling compared to day 0. * denotes significant difference between treatment and corresponding control.
Figures 4.3.1 and 4.3.2 presented copper concentrations measured in interstitial and overlying water, respectively.
27 Copper concentrations of interstitial water in the control had an average value of 4.7 ± 2.8 µg L-1 (mean ± SD) reaching a maximum of 8.7 µg L-1 at day 15.
Statistical analysis didn’t show a significant variation of copper concentation in the control time series.
Copper concentrations in CuCl2 and CuO low treatments presented an average value of 5.0 ± 2.7 µg L-1 and 2.5 ± 1.2 µg L-1 (mean ± SD) reaching a maximum of 9.4 µg L-1 and 3.8 µg L-1 at day 28, respectively.
Copper concentrations in CuCl2 and CuO high treatments presented similar average values of 9.4 ± 3.8 µg L-1 and 6.8 ± 2.8 µg L-1 (mean ± SD) reaching a maximum of 15.1 µg L-1 and 12.7 µg L-1 at day 3, respectively.
Only for CuCl2 high treatment was observed a significant difference compared to the corresponding control at day 3.
Fig. 4.3.2 Copper concentration measured in overlying water.
Values are means ± SE; n= 3. 0, 1, 15, and 28 represent days of sampling compared to day 0.
* denotes significant difference between treatment and corresponding control. Different symbols (€,©) denote significant difference between days within the same treatment.
The overlying water copper concentrations in the control experiment presented an average value of 2.0 ± 1.5 µg L-1 (mean ± SD) reaching a maximum of 5.7 µg L-1 at day 15.
28 Statistical analysis didn’t show a significant variation of copper concentrations in the control time series.
Copper concentrations in CuCl2 low treatments presented an average value of 4.4 ± 2.1 µg L-1 (mean ± SD) reaching a maximum of 7.3 µg L-1 at day 28. The CuO low treatments presented an average values of 2.7 ± 1.9 µg L-1 (mean ± SD), reaching a maximum of 6.5 µg L-1 at day 15.
In the CuCl2 low treatment, statistical analysis showed a significant increase of copper concentrations during the experiment, however this increase became significantly different from the corresponding control only on day 28, as for the CuO low treatment. Copper concentrations in CuCl2 and CuO high treatments presented different average values, 27.8 ± 18.8 µg L-1 and 11.3 ± 2.2 µg L-1 (mean ± SD), respectively, and the maximum value of 57.2 µg L-1 reached in the CuCl2 high treatment on day 15 was considerably higher compared to the maximum relative value of 14.3 µg L-1 reached in the CuO high treatment only on day 0.
For CuCl2 high treatment was observed a significant increase of copper concentrations over time also compared to the corresponding controls. On the other hand, this pattern was not evident in CuO high treatment that did not show a significant difference compared to the corresponding control. Average values of copper concentrations for interstitial and overlying water in the control treatment were both below the threshold proposed by Simpson et al. (2011) of 10 µg L-1, which means that the risk of acute toxic effects was very low.
Overlying water values in CuCl2 high treatment showed that the release of copper ions from sediment could be toxic if compared with the above threshold. Also the maximum copper value of overlying water observed in CuO high treatment exceeded the proposed threshold, but this value was considerably lower than that reached in CuCl2 high treatment.
As demonstrated in a study with other bivalves with similar feeding habitat that involves the use of siphons extruded above the sediment surface to reach the suspended particles, for Ruditapes philippinarum the contribution of the interstitial water to copper bioaccumulation is considered nor significant (Santana et al., 2017).
In another study carried out with the bivalve Tellina deltoidalis Campana et al. (2015) showed that the metal uptake resulted mainly from the particulate pathway rather than dissolved pathway and that the correlation between bioaccumulation and interstitial water was very low.
29
4.4 Ionic and nanoparticle copper bioaccumulation
Dissolved phase of copper is not the only source of bioaccumulation for aquatic organism (Croteau and Luoma, 2009). The feeding habitat of species influences the bioaccumulation kinetics (Santana et al., 2017) that may depend also on the different copper forms associated to the sediment particles such as ionic and nanoparticle copper. This is the reason why the bioaccumulation capacity of S. plana has been compared for these two copper forms. The bioaccumulation of ionic and nanoparticle copper forms during the experiment is presented in Fig. 4.4.
Fig. 4.4. Total copper bioaccumulation measured in S. plana.
Values are means ± SE; n= 9. -1, 1, 5, 15 and 28 represent days of sampling compared to day 0. Different letters denote significant difference within the control. * denotes significant difference between treatment and corresponding control. Different symbols (€,©) denote significant difference between days within the same treatment.
The bioaccumulated copper concentrations in the control presented an average value of 29.7 ± 10.9 µg g-1 (mean ± SD) reaching a maximum of 58.3 µg g-1 at day 5.
Statistical analysis showed a significant variation of copper bioaccumulation in the control time series determined by an increased uptake on day 5.
The bioaccumulated copper concentrations in CuCl2 and CuO low treatments presented similar average values of 55.9 ± 25.2 µg g-1 and 52.6 ± 15.3 µg g-1 (mean ± SD),
30 respectively. In both cases maximum values were reached at day 5 but the value was higher for CuCl2 low treatment (138.6 µg g-1) compared to CuO low treatment (94.5 µg g-1).The same pattern was observed in CuCl2 and CuO high treatments. Average values were similar, 222.5 ± 111.9 µg g-1 and 195.5 ± 69.4 µg g-1 (mean ± SD), respectively, but the maximum value of 528.8 µg g-1 was reached in the CuCl2 high treatment on day 5 compared to the maximum relative value of 383.9 µg g-1 reached in the CuO high treatment only on day 15.
In CuCl2 low treatment a significant increase of copper uptake was observed on day 5 and 28 compared to the corresponding control, instead, for CuO low treatment, this increase was observed on day 1, 15 and 28. A significant increase of total copper bioaccumulation compared to the control was also measured in all high treatments during the experiment. This increase was stable over time in the CuO high treatment but a significant variation was observed in the CuCl2 high treatment between day 1 and 5. The results showed a significant contamination and bioaccumulation of copper in whole animal tissue.
As expected the bioaccumulated copper concentrations in this experiment increased over time, and the organisms exposed to the highest concentrations for both copper forms showed the highest values of metal accumulation.
The variation of the copper concentration in the control over time can be explained by the bioaccumulation-elimination process undertaken by the organisms that at the beginning of the experiment were moved from a water-only environment to a sediment-water milieu containing naturally occurring copper concentrations. The same pattern
was observed in low treatments (50 CuCl2 and 50 CuO) where the organisms, moved to
the new environment, started bioaccumulating copper and then regulated the uptake over time. This regulation capacity seems to be somehow overwhelmed when the organisms where exposed to higher copper concentrations causing their death. Actually, bivalves have the ability to avoid contaminants isolating themselves by closing their valves, and S. plana can close the valves until 7 days (Kalman et al., 2015). Still, this mechanism failed in avoiding the toxic effect.
However, a tissue-residual approach based on the total copper bioaccumulation could lead to mistakes because metals can be compartmentalized within extracellular and intracellular structures that can sequester metals in a detoxified form (Santana et al., 2017). For this reason subcellular copper distribution was analysed in this study.
31
4.5 Condition Index
The Condition Index (CI) indicates the apparent “health” of the organisms in a specific environmental. Low values of this index provide significant information on the physiological state of an organism indicating a biological effort, as maintenance of energy in adverse environmental conditions or disease, or sexual activity (Lucas and Beningeri, 1985).
Fig. 4.5. Condition Index expressed as percentage. Values are means ± SE; n= 15. -1, 1, 5, 15, and 28 represent days of sampling compared to day 0. Different letters denote significant difference within the control. * denotes significant difference between treatment and corresponding control. Different symbols (€,©,$) denote significant difference between days within the same treatment.
Figure 4.5 showed the variation of the CI of S.plana when the organisms where exposed to different copper concentrations as ionic and nanoparticle forms.
The CI in the control presented an average value of 16 ± 3 % (mean ± SD) reaching a maximum of 25 % at day 1.
Statistical analysis showed a significant variation in the control time series with a progressive decrease of the CI.
In CuCl2 and CuO low treatments CI presented similar average values of 16 ± 3 % and 17 ± 3 % (mean ± SD) , respectively, reaching maximum values, of 22 % and 23 %, at day 1, respectively. The same pattern was observed in CuCl2 and CuO high treatments
32 with average values of 17 ± 3 % and 16 ± 4 % (mean ± SD), respectively. As for low treatments, the maximum value was reached on day 1, corresponding to 25 % and 26 %, respectively.
Statistical analysis showed significant variations in CuCl2 and CuO low treatments over time, but the two low treatments presented different trends. In CuCl2 low treatment there is a continue decrease since day 1 to 28, while in CuO low treatment increased toward the end of the experiment.
In CuO high treatment highlighted a significant difference over time with a progressive decrease of CI.
Despite, the significant differences of the CI observed in low treatments and in the CuO high treatment any of these variations resulted significantly different from the corresponding control. Only in CuCl2 high treatment was observed a significant decrease of CI on day 5 that was also significantly different compared to the corresponding control.
Indeed, a study of Sze and Lee (2000) on the bivalve Perna viridis showed that after the first month of exposure to spiked water (50 µg g-1 Cu) the differences were more marked and mussels showed significant reductions in tissue growth comparing to control; the authors observed a decrease of CI over time , with significant decrease after 3 months.
Another study of Kalman et al. (2015) on the bivalve Scrobicularia plana exposed to copper spiked water and sediment, uphold that a longer period than 30 days is needed to show the effect of sediment copper on the condition index.
This two study are in agreement with the results presented in this study. Moreover the CI shows that the high CuCl2 treatment had a toxic effect on the physiological state of the organisms.
33
4.6 Subcellular distribution
The internal metal partitioning is divided into five subcellular fractions: metal-rich granules (MTG), nuclei and cellular debris (NCD), organelles (microsomes,
mitochondria and lysosomes) (ORG), heat-sensitive proteins (HSP) and
metallothionein-like proteins (MTLP).
The combination of MRG and MTLP makes the detoxified metal fraction (DMF), that is considered to mitigate toxicity. Instead the combination of ORG and HSP represents the metabolically available fraction (MAF) (Campana et al., 2015), that has a great ecotoxicological significance because can lead to toxic effects if reaches a critical threshold concentration (Kalman et al., 2015). Indeed, when MAF concentration exceeds a critical threshold, or metal influx rate exceeds the detoxification and excretion capacity, toxicity may occur (Campana et al., 2015).
Fig. 4.6.1. Copper concentration measured in the detoxified metal fraction.
Values are means ± SE; n= 6. -1, 1, 5, 15, and 28 represent days of sampling compared to day 0.
Different letters denote significant difference within the control. * denotes significant difference between treatment and corresponding control. Different symbols (€,©,$) denote significant difference between days within the same treatment.
34 Figure 4.6.1 showed the bioaccumulated copper concentrations of the detoxified metal fraction throughout the experiment.
The average value of DMF in the control was 15.0 ± 3.3 µg g-1 (mean ± SD) reaching a maximum of 20.8 µg g-1 at day 5 and statistical analysis showed a significant variation of this fraction in the control time series. In CuCl2 and CuO low treatments the bioaccumulated copper concentrations presented average values of 26.5 ± 10.8 µg g-1 and 30.3 ± 7.0 µg g-1 (mean ± SD) , respectively, reaching a maximum value of 46.8 µg g-1 and 47.2 µg g-1 at day 28, respectively. Statistical analysis showed a significant variation of DMF in the CuCl2 and CuO low treatments time series but the increase was significantly different from the corresponding control only on day 28.
Copper concentration of the DMF fraction in CuCl2 and CuO high treatments showed
average values of 85.3 ± 33.7 µg g-1 and 96.2 ± 45.6 µg g-1 (mean ± SD), respectively, with the maximum value of 150.3 µg g-1 and 212.8 µg g-1 reached at day 1, respectively. For both treatments, statistical analysis showed a significant increase of copper concentrations in this fraction, compared to the corresponding control, that remained stable over time.
Fig. 4.6.2. Copper concentration measured in the metabolically available fraction. Values are means ± SE; n= 6. -1, 1, 5, 15, and 28 represent days of sampling compared to day 0.
Different letters denote significant difference within the control. * denotes significant difference between treatment and corresponding control. Different symbols (€,©) denote significant difference between days within the same treatment.
35 Figure 4.6.2 showed copper concentrations in the metabolically available fraction during the experiment.
Copper concentrations in MAF in the control presented an average value of 4.5 ± 2.6 µg g-1 (mean ± SD) reaching a maximum of 12.3 µg g-1 on day 28, and the statistical analysis showed a significant variation over time.
In CuCl2 and CuO low treatments MAF copper concentrations presented similar average values of 7.8 ± 5.4 µg g-1 and 6.8 ± 3.6 µg g-1 (mean ± SD) , respectively, but considerably different maximum values with 31.7 µg g-1 and 18.8 µg g-1 on day 5 and 28, respectively.
For CuCl2 low treatment, statistical analysis showed a significant variation of MAF copper concentration over time, while any significant variation was observed in the CuO low treatment during the experiment.
The average values of CuCl2 and CuO high treatments corresponded to 17.5 ± 5.7 µg g-1 and 13.8 ± 5.3 µg g-1 (mean ± SD), respectively, reaching a maximum value of 29.5 µg g-1 and 26.0 µg g-1 on days 1 and 15.
Statistical analysis did show a significant increase of MAF copper concentration in the CuCl2 high treatment, while any significant variation was observed in the CuO high treatment over time. Moreover, MAF copper concentrations in both treatments were always significantly different from the corresponding control.
The concentration of detoxified copper in organisms unexposed was stable with an average value of 77 ± 9 % (mean ± SD) of the total copper bioaccumulated.
The percentages of copper associated to DMF for CuCl2 and CuO high treatments were
82 ± 18 % (mean ± SD) and 87 ± 14 % (mean ± SD) of the total copper bioaccumulated, respectively.
These results indicated the ability of the bivalve to detoxify bioaccumulated copper, according to the study presented by Campana et al. (2015) where a significant positive relationship between copper associated with DMF and dietary uptake was observed. The concentration of copper associated to MAF increased significantly in organisms exposed to higher copper concentrations, and represented between the 14 and 23% of total bioaccumulated copper in all treatments and control.
The relative contributions of each subcellular copper fraction to MAF and DMF were also investigated (Fig. 4.6.3 and Fig. 4.6.4).
36
Fig. 4.6.3. Relative contributions of subcellular copper fractions (MGR and MTLP) to DMF. Values are means ; n= 6. 1, 5, 15, and 28 represent days of sampling compared to day 0.
Fig. 4.6.4. Relative contributions of subcellular copper fractions (ORG and HSP) to MAF. Values are means ; n= 6. 1, 5, 15, and 28 represent days of sampling compared to day 0.
The time series comparison between the relative contributions of MRG and MTLP to DMF copper concentration highlighted that over time, for all treatments, most of the bioaccumulated copper was detoxified by the organisms as MTLP fraction.
37 On the other hand, results highlighted that over time, most of copper metabolically available was associated to HSP fraction, because its relative contribution increased in all treatments compared to the copper concentration content in the ORG fraction.
The control experiment showed the same trend except for day 28 in which there is a considerable increase.
4.7 Conclusion
The study highlights that the bioaccumulation kinetics show a significant contamination and bioaccumulation of copper in whole animal tissue, that increased over time, and the organisms exposed to the highest concentrations, for both copper forms, showed
the highest values of metal accumulation. The subcellular fraction results were in agreement with those of the bioaccumulated copper in the whole tissue. Indeed, the concentration of copper associated to MAF increased significantly in organisms exposed to higher copper concentrations. The results also indicate the ability of the bivalve to detoxify bioaccumulated copper. Thus, S. plana bioaccumulates copper, and has the ability to regulate the MAF rather than the total accumulated metal.
Data on the Condition Index showed that the high CuCl2 treatment had a toxic effect on the physiological state of the organisms.
39
Acknowledgments
I would like to thank Dott. Julián Blasco of the Instituto de Ciencias Marinas de Andalucía (ICMAN) and Dott.ssa Olivia Campana from the University of Cádiz for their help provided during my master thesis research and for everything they taught me, and Prof.ssa Elena Fabbri for giving me the opportunity to collaborate with ICMAN and for the thesis drafting. I would also to thank Esmeralda V Mañas for the precious help without which I would been lost, Maria del Carmen Agullo for her assistance with metal analysis, Dott.ssa Marta Serra for taking charge of the nanoparticles characterization. I would like to thank Fondazione Cetacea and Centro di Recupero Tartarughe Marine Brancaleone for help me to understand that Marine Biology was my way.
I would like thank all my family for the constant support that gives to me, especially my mum who has always believed in me, even more than I did.
Lastly, I would like to thank all my friends, Luca to be the best person in my life and never abandoned me, the “Stelline” for bearing me and for their long distance support, my roommates for being my first love in Ravenna and for being with me in every moments, the BCS for being my family for two years, and TM for having welcomed me into the big family and for sharing with me all the uneasiness in Ravenna.
41
References
Baker T J, Tyler C R, Galloway T S, 2014. Impacts of metal and metal oxide nanoparticles on marine organisms. Environmental Pollution. 186, 257-271.
Birch G F, Taylor S E, Matthai C, 2001. Small-scale spatial and temporal variance in the concentration of heavy metals in aquatic sediments: a review and some new concepts. Environmental Pollution. 113(3): 357-372.
Blasco J, Gomes T, García-Barrera T, Rodríguez-Romero A, Gonzalez-Rey M, Morán-Roldán F, Tromibini C, Miotk M, Gómez-Ariza J L, Joao Bebianno M, 2010. Trace metal concentrations in sediments from the southwest of the Iberian Peninsula.Scientia Marina 74S1.
Bryan G W, Langston W J, Hummerstone L G, 1980. The use of biological indicators of heavy-metal contamination in estuaries –with special reference to an assessment of the biological availability of metals in estuarine sediments from south-west Britain. Marine Biological Association United Kingdom Occ. Publ. 1: 1–73.
Bryan G W & Uysal H, 1978. Heavy metals in the burrowing bivalve Scrobicularia
plana from the Tamar estuary in relation to environmental levels. Journal of the marine
biological association of the United Kingdom. 58(1): 89-108.
Buffet P E, Tankoua O F, Pan J F, Berhanu D, Herrenknecht C, Poirier L, Amiard-Triquet C, Bérard J B, Risso C, Guibbolini M, Roméo M, Reip P, Valsami-Jones E, Mouneyrac C, 2011. Behavioural and biochemical responses of two marine invertebrates Scrobicularia plana and Hediste diversicolor to copper oxide nanoparticles. Chemosphere. 84(1): 166-174.
Byrne P A & O'Halloran J, 2001. The role of bivalve molluscs as tools in estuarine sediment toxicity testing: a review. Hydrobiologia. 465(1-3): 209-217.
42 Campana O, Taylor A M, Blasco J, Maher W A, Simpson S L, 2015. Importance of subcellular metal partitioning and kinetics to predicting sublethal effects of copper in two deposit-feeding organisms. Environmental Science & Technology. 49(3): 1806-1814.
Croteau M N & Luoma S N, 2009. Predicting dietborne metal toxicity from metal influxes. Environmental Science & Technology. 43(13): 4915-4921.
Dedeh A, Ciutat A, Treguer-Delapierre M, Bourdineaud J P, 2015. Impact of gold nanoparticles on zebrafish exposed to a spiked sediment. Nanotoxicology. 9(1): 71-80.
Dixit R, Wasiullah, Malaviya D, Pandiyan K, Singh U B, Sahu A, Shukla R, Singh B P, Rai J P, Sharma P K, Lade H, Paul D, 2015. Bioremediation of Heavy Metals from Soil and Aquatic Environment: An Overview of Principles and Criteria of Fundamental Processes. Sustainability. 7(2): 2189-2212.
Gaetke L M & Chow C K, 2003. Copper toxicity, oxidative stress, and antioxidant nutrients. Toxicology. 189(1-2): 147-163.
Hanna S K, Miller R J, Zhou D, Keller A A, Lenihan H S, 2013. Accumulation and toxicity of metal oxide nanoparticles in a soft-sediment estuarine amphipod. Aquatic Toxicology. 142: 441-446.
Hughes R N, 1969. A study of feeding in Scrobicularia plana. Journal of the Marine Biological Association of the United Kingdom. 49(3): 805-823.
Kalman J, Bonnail-Miguel E, Smith B D, Bury N R, Rainbow P S, 2015. Toxicity and the fractional distribution of trace metals accumulated from contaminated sediments by the clam Scrobicularia plana exposed in the laboratory and the field. Science of the Total Environment. 506: 109-117.
Lucas A, Beninger P G, 1985. The use of physiological condition indices in marine bivalve aquaculture. Aquaculture. 44(3): 187-200.
43 Matozzo V, Ballarin L, Pampanin D M, Marin M G, 2001. Effects of copper and cadmium exposure on functional responses of hemocytes in the clam, Tapes
philippinarum. Archives of Environmental Contamination and Toxicology. 41(2):
163-170.
Mendiguchía C, Moreno C, Mánuel-Vez M P, García-Vargas M, 2006. Preliminary investigation on the enrichment of heavy metals in marine sediments originated from intensive aquaculture effluents. Aquaculture. 254(1-4): 317-325.
Mouneyrac C, Buffet P E, Poirier L, Zalouk-Vergnoux A, Guibbolini M, Risso-de Faverney C, Gilliland D, Berhanu D, Dybowska A, Châtel A, Perrein-Ettajni, H, Pan J F, Thomas-Guyon H, Reip P, Valsami-Jones E, 2014. Fate and effects of metal-based nanoparticles in two marine invertebrates, the bivalve mollusc Scrobicularia plana and the annelid polychaete Hediste diversicolor. Environmental Science and Pollution Research. 21(13): 7899-7912.
Pang C, Selck H, Misra S K, Berhanu D, Dybowska A, Valsami-Jones E, Forbes V E, 2012. Effects of sediment-associated copper to the deposit-feeding snail, Potamopyrgus
antipodarum: a comparison of Cu added in aqueous form or as nano-and micro-CuO
particles. Aquatic Toxicology. 106: 114-122.
Rainbow P S, 2002. Trace metal concentrations in aquatic invertebrates: why and so what?. Environmental Pollution. 120(3): 497-507.
Riba I, Blasco J, Jiménez-Tenorio N, DelValls T Á, 2005. Heavy metal bioavailability and effects: I. Bioaccumulation caused by mining activities in the Gulf of Cádiz (SW, Spain). Chemosphere. 58(5): 659-669.
Santana L M, Blasco J, Abessa D M, Campana O, 2017. Bioaccumulation kinetics of copper in Ruditapes philippinarum exposed to increasing, continuous and pulsed exposure: Implications for growth. Science of the Total Environment. 595: 920-927.
Silva C, Mattioli M, Fabbri E, Yáñez E, DelValls T A, Martín-Díaz M L, 2012a. Benthic community structure and biomarker responses of the clam Scrobicularia plana