Università Politecnica delle Marche
Scuola di Dottorato di Ricerca in Scienze dell’Ingegneria Curriculum in Ingegneria informatica, gestionale e dell’automazione ---
Study, assessment and identification of
Educational Robotics experiences at
school
Ph.D. Dissertation of:
Laura Screpanti
Advisor:
Prof. David Scaradozzi
Curriculum supervisor:
Prof. Francesco Piazza
Università Politecnica delle Marche
Scuola di Dottorato di Ricerca in Scienze dell’Ingegneria Curriculum in Ingegneria Informatica, Gestionale e dell’Automazione ---
Study, assessment and identification of
Educational Robotics experiences at
school
Ph.D. Dissertation of:
Laura Screpanti
Advisor:
Prof. David Scaradozzi
Curriculum supervisor:
Prof. Francesco Piazza
Università Politecnica delle Marche
Dipartimento di (nome del dipartimento dove la tesi e’ stata sviluppata) Via Brecce Bianche — 60131 - Ancona, Italy
Acknowledgements
No man is an island entire of itself; every man is a piece of the continent, a part of the main
(John Donne, Meditation XVII Devotions upon Emergent Occasions)
For what I achieved in this thesis is part of long journey begun in the past years and, hopefully, doomed to continue in the future. I would not have been able to achieve so much without the support, the open debates and the critical reviews of the scientific community which I belong to.
Most of all, I would like to express my special appreciation and thanks to my advisor, Professor David Scaradozzi, who has unceasingly provided guidance, advice and example.
I wish to thank my colleague, Ing. Lorenzo Cesaretti, for the witty conversations spanning from Educational Robotics to new sports and food, for sharing passion and curiosity.
A special thanks to my family, friends and boyfriend. Even though you could not imagine what was going on in my head and in my professional life, you chose to stand by my side, no matter how low my feelings were or how unnecessarily happy I was. Thank you.
Abstract
The aim of this thesis is to study and model the learning process of K12 classrooms during Educational Robotics (ER) activities. Approaching the study of learning in K12 classrooms during ER activities for modelling purpose, the first question to answer is what kind of variables are identified as representative of learning in the given context; subsequently, the causality principle between input and output should be demonstrated; finally, variables should be observed to provide a measure which could be related to the internal state of the system. In this work answers to these questions are explored by choosing the definition of learning as the process of acquiring knowledge, competence and abilities, by relating ER activities carried out in K12 classroom (procedures) with changes in those variables and by formulating and validating instruments to capture quantitative information about those variables. Some studies reported in literature present a model of learning for different context, none in the ER field. Moreover, in assessing ER activities there are fewer quantitative studies than qualitative studies, and ER itself lacks a formal definition of what it exactly entails. In the present work four case studies are presented. Each case study reports an ER experience in a K12 set of classrooms which employed the developed sensors to measure the outcome of the experience. After testing “traditional sensors” of learning, namely the state-of-the-art procedure to validate those instruments, some final considerations are provided on the metrology and causality issues for modelling.
Contents Acknowledgements ... i Abstract ... iii Contents ... iv List of Figures ... vi List of Tables ... v Introduction ... 1
Section 1 – Context and state of the art ... 9
1.1 Educational Robotics ... 9
1.2 Measurement and modelling in ER research ... 16
Section 2 – Evaluation tools ... 24
2.1 Knowledge and competence ... 30
2.1.1 Crossword puzzle for primary and secondary school’s students ... 32
2.1.2 Knowledge and competence test ... 35
2.2 Attitudes towards STEM studies and careers ... 38
2.2.1 Validation of the Italian modified version of the S-STEM questionnaire ... 42
2.3 Questionnaire on attitudes... 45
2.3.1 Expectation questionnaire ... 45
2.3.2 Satisfaction questionnaire ... 47
Section 3 – Case studies ... 51
3.1 Case study: questionnaire on attitudes ... 51
3.2 Case study: S-STEM questionnaire and knowledge test ... 57
3.3 Case study: Teachers’ training ... 67
3.4 Case study: Social skills ... 78
Conclusions ... 87
References ... 91
Appendix A ... 109
Crossword puzzle for primary school from Scaradozzi et al., 2016 and Screpanti et al., 2018 ... 109
Crossword puzzle for lower secondary school from Scaradozzi et al., 2016 and
Screpanti et al., 2018 ... 110
Appendix B ... 111
Knowledge questionnaire for students of the Lower Secondary School in the pre-activities phase ... 111
Knowledge questionnaire for students of the Lower Secondary School in the post-activities phase ... 117
Knowledge questionnaire for primary school’s students in the pre-activity phase ... 121
Knowledge questionnaire for primary school’s students in the post-activities phase ... 126
Appendix C ... 130
S-STEM Questionnaire – Italian modified version ... 130
Appendix D ... 135
Expectations questionnaire ... 135
List of Figures
Figure 1: quantitative and qualitative approaches deriving from contrasting
theoretical stances (Jacobson, Levin and Kapur, 2019). ... 3
Figure 2: scheme of a frontal lesson. ... 3
Figure 3: block diagram of the system (learner) in the open loop. ... 4
Figure 4: schematic representation of a sensor of learning. ... 4
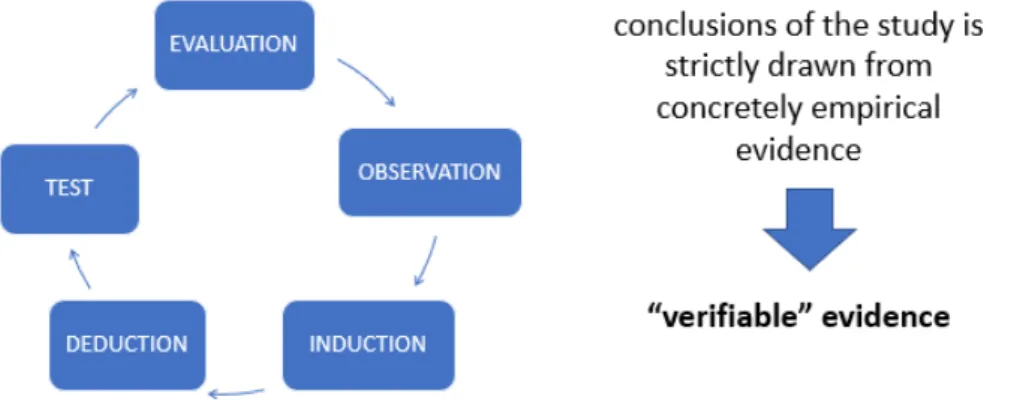
Figure 5: the scientific cycle. ... 5
Figure 6: block diagram of the system (learner) in the closed loop. ... 7
Figure 7: key competences for lifelong learning. ... 10
Figure 8: classification of RiE. ... 13
Figure 9: empirical cycle. ... 24
Figure 10: validity and reliability of a measure. ... 27
Figure 11: results of the crossword puzzle tests administered to primary school students. ... 33
Figure 12: results of the crossword puzzle tests administered to lower secondary school students. ... 33
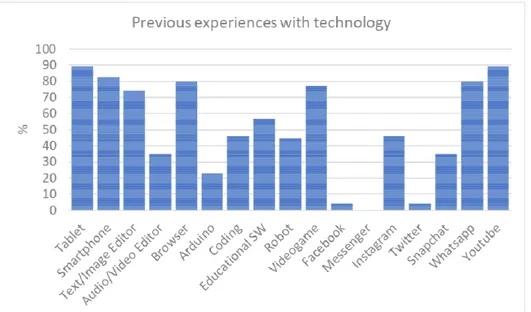
Figure 13: shares of students who had previous experiences with technology and social media. ... 38
Figure 14: Scree test comparing PCA and PAF results (left) and results from Horn’s parallel analysis (right). ... 43
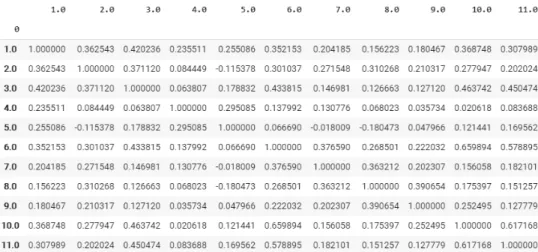
Figure 15: correlation matrix for the expectation questionnaire. ... 46
Figure 16: results from Horn’s parallel analysis of the expectations questionnaire. ... 46
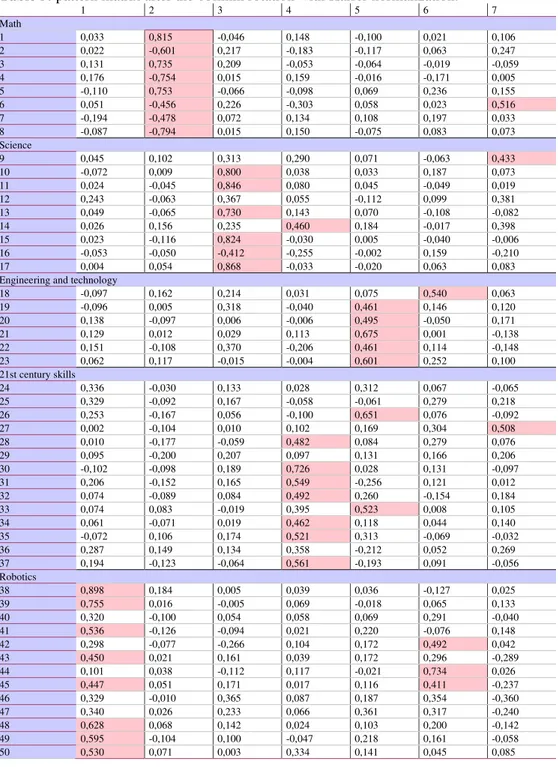
Figure 17: factors' loadings for expectations questionnaire. ... 47
Figure 18: correlation matrix for the satisfaction questionnaire. ... 48
Figure 19: results from Horn's parallel analysis for satisfaction questionnaire. ... 48
Figure 20: factors' loadings for the satisfaction questionnaire. ... 49
Figure 21: previous use of technologies and social media among the students of the sample. ... 52
Figure 22: chi squared results for expectations vs. background variables are displayed. ... 53
Figure 23: chi squared results for satisfaction vs. background variables are displayed. ... 54
Figure 24: chi squared results for change in attitudes vs. background variables are displayed. ... 54
Figure 25: distributions of scores on the 4 factors in pre and post condition.
... 55
Figure 26: previous experiences with technologies and social media of participants. ... 59
Figure 27: boxplots comparing results in the five factors of adapted S-STEM in pre and post condition. ... 60
Figure 28: distribution of scores among the classes and between the factors. ... 62
Figure 29: changes between classes from post measurement to pre measurement. ... 63
Figure 30: boxplot of scores from knowledge and competence test. ... 64
Figure 31: example of answer to question 11. ... 64
Figure 32: example of answer to question 12. ... 65
Figure 33: scores distributions. ... 66
Figure 34: distribution over the simple measure of change. ... 66
Figure 35: flow of information from experts to teachers and then to students. ... 67
Figure 36: scheduled activities of the training. ... 68
Figure 37: previous use of technology in the classroom. ... 70
Figure 38:histograms of B1-BL and B1-PT (left), B2_BL and B2-PT (right), related to ER (B1-BL and B1-PT value < 0.005, B2-BL and B2-PT p-value < 0.0167 and p-p-value < 0.05 for comparing BL and PT p-values). ... 73
Figure 39: histograms of B1-BL and B1-PT (left), B2_BL and B2-PT (right), related to Coding (B1-BL and B1-PT p-value < 0.005, B2-BL and B2-PT p-value < 0.0167 and p-value < 0.05 for comparing BL and PT values). ... 74
Figure 40: histograms of B1-BL and B1-PT (left), B2_BL and B2-PT (right), related to Tinkering (B1-BL and B1-PT p-value < 0.005, B2-BL and B2-PT p-value < 0.0167 and p-value < 0.05 for comparing BL and PT values). ... 75
Figure 41: scores on the three methodologies compared to background variables. ... 76
Figure 42: changes in knowledge and the demographic variables. ... 76
Figure 43: correlation between self-confidence and knowledge. ... 77
Figure 44: procedure in the classroom. ... 80
Figure 45: results from question 4 (fun with classmates) and 5 (good collaboration with my classmates). ... 82
Figure 46: Group A choices (left) and rejection (right) for the area of play (top) and study (bottom). ... 84 Figure 47: Group B choices (left) and rejection (right) for the area of play (top) and study (bottom). ... 85
List of Tables
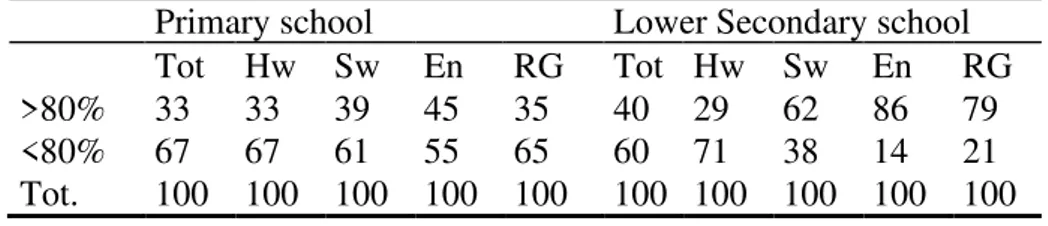
Table 1: percentage of students who scored above or below the threshold
expressed as the percentage of correct answers. ... 34
Table 2: descriptive statistics of the sample. ... 37
Table 3: example of items from S-STEM questionnaire. ... 40
Table 4: description of the S-STEM questionnaire adapted for the Italian sample. ... 41
Table 5: pattern matrix after the oblimin rotation with Kaiser normalization. ... 44
Table 6: Descriptive statistics of the sample. ... 52
Table 7: descriptive indices and results of the paired samples Wilcoxon test. ... 56
Table 8: descriptive statistics of the sample. ... 58
Table 9: results from the Kruskall-Wallis test. ... 61
Table 10: results from the Kruskall Wallis test. ... 65
Table 11: descriptive statistics of the sample. ... 69
Table 12. mean values of answers to questionnaire items. * points at the paired data showing a difference which is statistically significant (α=0.05). ... 82
Table 13. Results from the analysis of sociometric data. * different points at the paired data showing a difference which is statistically significant (α=0.05). ... 83
Introduction
The aim of this thesis is to study and model the learning process of K12 classrooms during Educational Robotics (ER) activities. Several researchers tried to shape the learning process as a dynamical system (Abbona, Del Re and Monaco, 2008; Gattie, Kellam, Schramski and Walther, 2011; Jacobson, Levin and Kapur, 2019; Nicolescu and Petrescu, 2013; Piech, Sahami, Koller, Cooper and Blikstein, 2012; Steenbeek and van Geert, 2013; White, Smigiel and Levin, 2017 ); most of their studies does not have grounding in the experimental field, and their focus is on learning in general; models are formulated starting from a theoretical approach and end stating the need to be implemented. Acknowledging this gap several institutions are investing on the research field of education as a complex system. In Italy, for example, the national institute INVALSI created the research group on Education as a Complex System, called “E-CAS”, with the aim of collecting and analysing more information, scarce at the moment, to understand the educational system on the basis of the socio-cultural context of society and of the single student in a classroom (INVALSI, 2006).
The study of the dynamic evolution of a student’s learning is challenging because, even if the concept of “learning” is part of common knowledge, its scientific definition is still not well acknowledged. In fact, it is possible to define “learning” from several points of view - neurobiological, psychological and pedagogical for instance - but in order to measure and to quantify “learning” a more formal and unifying concept must be used. Research in education proposed some models of learning and identified some variables pertaining to learning; for example, the output of the learning process is often defined in terms of learning objectives of a certain activity. According to national and international laws, K12 education should develop knowledge, skills, behaviours and attitudes (European Union, 2006; Mazzer, 2018; MIUR, 2012). Like the educational activity, also the modelling process is required to focus on a set of aspects of reality; it is required to define the learning processes at play and which of them are taken into consideration in the model of the reality.
Another aspect to keep into consideration while building a model is the causality principle. Classical systems theory is an example of axiomatic theory of dynamic phenomena that verify the causality principle (i. e. given an input, the system produces an output). To examine whether this principle holds for the variables involved in the learning process, the causal relation needs to be proven by means of sound scientific findings. In the educational, psychological and sociological fields, tools and methods have been examined through the lens of scientific method only recently, if compared with other sciences like Physics, Astronomy, Biology, etc. . Many theories in those fields define abstract elements, like self-efficacy (Bandura, 2010) or computational thinking (Brennan and Resnick,2012; Wing, 2006, 2008); this abstract concepts are the building elements (the variables) of the experiment whose aim is to verify the causal relationship between input and output; moreover, these building elements can vary across time, increasing or decreasing.
Another element to keep into consideration while building a model of learning is the measurement itself of the accessible variables. The “observed variables” are those variables that can be accessed by means of “sensors”, while the “latent variables” are those variables that cannot be directly measured. By means of repeated observations (samples) of an accessible variable, which is a repeatable phenomenon, it is possible to have a numerical evaluation of the associated “latent variable”, which is a phenomenon comparable to the observed variable. In order to establish causal relationships among variables and to provide valid and reliable measurement of the intended constructs, research in the education field found its scientific soundness basing its claims on philosophical stances. Stating the theoretical stance a researcher can be able to derive a sound methodology of enquiry, establishing a point of view through which one can see the reality and thus defining how to measure the variables of interest (Figure 1).
The last phase of modelling learning is the one that refers to “cybernetics”, the art of controlling the system (Wiener 1948) and deals with providing the output of the “sensors” measuring learning as an input to the “actuator” of a correction strategy. Actuators are those elements in the system in charge of transforming the measures received as an input into commands to the system under control in order to make the observed variables closer to the reference objectives established. This feedback mechanism processes
information on the past/present measurements to determine the future behaviour of the systems.
Figure 1: quantitative and qualitative approaches deriving from contrasting theoretical
stances (Jacobson, Levin and Kapur, 2019).
The first phase of this study reflects on the modelling of a frontal lesson: a teacher explaining concepts to a learner. Ideally, information flows from the teacher to the learner, the teacher provides the learner with a reference (Figure 2). Subsequently, the teacher evaluates how this information has been acquired by the student through the evaluation of knowledge, skills, attitudes and competences.
The concept of providing the reference input to the system can also be explained through a block diagram as expressed in Figure 3. This simple
way of expressing the model pose some simple questions: what is r(t)? what is y(t)? Can they be related and transformed into quantitative variables? If so, which kind of instruments are capable of sensing the variable of interest and transduce it into something measurable and understandable and usable into a cybernetic system?
To answer these questions a typical measuring chain can be used to represent the sensors needed (Figure 4). Firstly, a primary sensitive element captures the variable of interest, then, the variable of interest is transduced and amplified adequately to be processed and put into a comprehensible format for a teacher. This information can be used by teachers to adjust their “control strategy”, to make his or her teaching strategy more effective. The metrology issue poses serious questions about the nature of the variables involved as well as how to represent them.
Figure 4: schematic representation of a sensor of learning.
Focusing on the ontological and epistemological basis, the approach carried out in the present thesis is the positivist/logical empiricist. The empirical scientific method is empirical, namely related to experience, and logic,
namely it is possible to consistently apply logic to make sense of the world, not trust, not authority, neither belief (Figure 5).
Figure 5: the scientific cycle.
From these stances it derives an approach to measurement in education science: tools and methods must be tested for their validity and for their reliability. Validity implies an evaluation not only of the tools but also of methodologies applied during the experiment (research design). In measuring variables, it must be clear that the results are derived only from the object of the study and that the results depend entirely on the variables of interest and not from other unwanted variables (noise). To evaluate the validity of a research it should be taken into consideration if the results are a useful model to account for reality adding new elements to understand it and represent it. Four aspects to examine the validity of a study:
• internal validity • construct validity
• external validity and ecological validity • statistical validity
Each one of these types of validity can be threatened by situation that may occur usually both in a laboratory experiment and in the real-life scenario. For this reason, to formulate a measure experiment of the variable y(t) it should be considered:
• research question • research design
• tools to measure the variable of interest, tested for validity and reliability
• statistical validation of the research hypothesis
Thus, in the present work the focus is on the variable of interest (those regarding learning) and the development of “sensors” to capture those data. Which sampling interval to choose to better represent the trajectory of learning is a fundamental question. Two approaches can be developed: a discrete and “classic” approach, based on tools like questionnaires and test, and a discrete and real-time approach (Berland, Martin, Benton, Petrick Smith and Davis, 2013; Cesaretti, Screpanti, Scaradozzi and Mangina, in
press; Jormainnen and Sutinen, 2012), based on the analysis of log files
from students’ programming (Scaradozzi, Cesaretti, Screpanti and Mangina,
in press; Scaradozzi et al., 2018). Both these two approaches are based on
an intervention in the classroom, both these approaches are discrete measurements of students’ learning trajectory. “Classic” sensors can be developed to test any variable being it knowledge, competence, skills or attitude. At the moment “real-time sensors” provide feedback on students’ learning trajectory in terms of styles of problem-solving and they can provide feedback on students’ way of programming robots or apps. “Real-time sensors” acquire data from students’ processes with a shorter sampling period than “classic sensor”. Moreover, “real-time” sensors are transparent to students while programming, while “classic” sensors can be used only with an active participation of the student. In the present thesis the focus is on classic sensors.
Capturing information from the system as described by Figure 3 can lead to two interesting outcomes: the characterisation of the system “learner” and the closed loop chain of control (Figure 6). The first will be useful because it will help understand the profile of a student while learning through Educational Robotics; the second will be useful because the information acquired with sensors can be provided back to teachers to support them in the evaluation process or in adjusting the way they teach to each student. The former aspect is the focus of the present thesis, the latter lead us to a final series of thoughts. To face the second aspect in fact it is important to assign a quantity to r(t), which is a reference signal to the system and as such it is an arbitrary choice of the modeler. It should be noted that, even if it is fundamental from the point of view of the control theory to arrive to a standard r(t), rules for the validity of tools still hold. It is right then to trust experts, namely people trained and competent to “deliver” the content.
Figure 6: block diagram of the system (learner) in the closed loop.
To better understand what it means to quantify r(t) it is possible to make an example. A single activity can be defined in terms of information passed down from teacher to student (i.e. activity on “sensor in a robotic system” has the aim to bring the classroom to a mean level of 7/10 on a scale which has been a priori validated). The teacher can start the activity and pass down the concepts, develop skills and so on (they all constitute u(t)). At the instant t* the teacher can administer the validated sensors to measure the level of the information retained by the student, which is the output of the system “learner”, namely y(t). A proper filter from y(t*+dT) should extrapolate information comparable with the dimension of r(t) and with the chosen reference level. In this design, the teacher (the controller of Figure 6) can choose the action to perform on the system: keep on adjusting its own output with corrections (u(t*+dT)) depending on e(t*+dT) or stop. The model of the process will keep on representing reality as long as the teacher will not close the temporal axis (tf) and all its sub-Phases. The choice of adopting the scheme reported Figure 6 only for t0 and tf in the activity or to give pre-eminence to single sub-phases within that period represent the sampling time of the system.
Limits to the linear dynamical model can be found in the way reality is modelled and in the emergent and nonlinear properties of the single components of the systems. It remains the problem of how to represent and quantify the variables of interest at play.
In the following sections these considerations are explored starting from Section 1, which will show the context of the present work, namely Educational Robotics and measurement of learning for modelling purposes. Section 2 will present some sensors to measure the variables of interest and their validation. Section 3 will demonstrate how these sensors were used in
the K12 classrooms during ER experiences. Finally, Conclusions will provide final remarks.
Section 1 – Context and state of the art
The context of the present work of thesis is Educational Robotics and systems theory applied to learning. The next subsection will provide details on the main features of Educational Robotics. It cannot be formulated a model of reality without observing it, thus information on relevant studies describing Educational Robotics is provided. It should be pointed out that it does not exist at the moment a unifying vision on Educational Robotics. Literature reports several different stances and advocates for a definition of Educational Robotics (Alimisis, 2013; Alimisis, Alimisi, Loukatos and Zoulias, 2019; Angel-Fernandez and Vincze, 2018; Benitti, 2012; Eguchi, 2014; Mikropoulos and Bellou, 2013; Toh, Causo, Tzuo, Chen and Yeo, 2016). The subsequent subsection will report literature on how to represent learning. Notably, no research paper was found on how to represent learning in a constructionist environment for Educational Robotics, but all of these papers mention the vital need for adequate measurements in terms of philosophical stance, methodology of research and tools for measuring intended construct (Benitti, 2012; Castro et al., 2018; López, Valenzuela, Nussbaum and Tsai, 2015).
1.1 Educational Robotics
Robots in education are increasingly used as tools to promote the acquisition of knowledge, disciplinary and cross-disciplinary competencies, attitudes and skills, including but not limited to the STEM (Science, Technology, Engineering and Mathematics) subjects. This trend can be easily linked with the recent policies of Italian and European governments aiming to reshape curricula (Eurydice, 2012). Figure 7 sums up the key competences for lifelong learning identified by the European Commission as guidance for all member states in developing national curricula. Furthermore, researchers like Dede (2010), Voogt and Roblin (2012), van Laar, van Deursen, van Dijk and de Haan (2017) reported a set of particular abilities that an
individual should develop to cope with the requirements of the society of the XXI century.
Figure 7: key competences for lifelong learning.
Amongst these skills we can find the traditional literacies like reading and computing, but more complex skills seems to be on demand. Capability to work in team, ability to express by means of digital media, ability to master technology, also to face the consequences of a digital citizenship: these are completely different skills from the traditional skills developed in the education of the XX century. The school is changing accordingly to try to provide students the best possible option, but teachers and administrative staff are having a hard time figuring out which methodology is effective in fostering these new skills and which is not.
Within innovative methods proposed to start a revolution in school, Educational Robotics (ER) has become increasingly popular because it seems to help in developing transversal skills, soft skills, attitudes toward STEM subjects and career, technical and digital skills and all the so called 21st century skills (Atmatzidou and Demetriadis, 2016; Atmatzidou, Demetriadis and Nika, 2018; Caballero-Gonzalez, Daniela and Lytras, 2019; Muñoz-Repiso and García-Holgado, 2019; Eguchi, 2015, 2016; Kandlhofer and Steinbauer, 2016).
In ER the underlying pedagogical approach is that of Constructionism, a learning theory suggested by Seymour Papert on the basis of the work of Jean Piaget (Ackermann, 2001; Papert, 1980, 1991, 1999). The learning approach is a construction and re-construction of mental representation more than a transmission of knowledge. An effective learning takes place
with the usage of manipulative materials (cognitive artefacts), by means of which students enter into a construction activity of a meaningful product. In this activity building knowledge is the natural consequence of several elements: an experience of creation, experimentation, direct observation of the effects of the actions performed and the sharing of ideas in a highly motivating context. From this point of view, technology and innovative learning environments increase the chances for students to learn.
A reference for building and carrying out activities with ER is also made to the psychological theory on multiple intelligences, especially to the US psychologist Howard Gardner (1992) and to his conceptualization, as the framework for the technical laboratory’s activities. In fact, ER activities are intended to give students the chance to discover by himself/herself his/her own main abilities. Each person is characterized by a distinctive profile given by the combination of distinct areas of our mind (logical-mathematical, linguistic, visuo-spatial, bodily kinaesthetic, interpersonal, intrapersonal). Although all these abilities are something we are endowed with, they can be developed through experience; moreover, being more conscious of his or her own areas of excellence and deficiency could really help the student to acknowledge his or her personal value, thus envisaging a path of personal growth, study or career.
The use of project-based learning in ER activities indicates an overall approach to the design of learning environments, characterized by a peculiar emphasis on the cooperative research of feasible and effective solutions to a starting problem, involving systematically new technology and trying to produce real and tangible products as an outcome of the activity. Project-based learning (PBL) is a model that organizes learning around projects. Projects are complex tasks, based on challenging questions or problems, that involve students in design, problem-solving, decision making, or investigative activities; give students the opportunity to work relatively autonomously over extended periods of time; and culminate in realistic products or presentations. Project-based learning is an educational strategy for designing learning environments, characterized by a peculiar emphasis on the cooperative research of feasible and effective solutions to a starting problem, involving systematically new technology and trying to produce real and tangible products as an outcome of the activity. This approach is based on “learning by doing” philosophy (Jones, Rasmussen and Moffitt, 1997; Papert, 1972; Resnick, 1987; Schank, 1982).
Peer tutoring is another useful technique which use technologies to teach in classroom: some students will be facilitators in the learning process to help other students of the same age or younger. Positive attitude towards social relation can be thus developed into the school, acting as a protective factor for the risk of absenteeism and preventing school dropouts (Daniela and Strods, 2019). Students learning and developing their skills are in charge of the responsibility of working with their companion in order to fill the team gaps.
In a typical, ER activity students are divided in teams composed of 3-4 people, and within the team some roles are defined: the designer (responsible for the project and coordinator of the team, the person who has the task to communicate to the others building instructions of the robot), the
warehouse worker (responsible for the robotic kit, the student who has the
task to look for the Lego/Arduino pieces inside the box), the
technical-assembler (responsible for the robot assembling, the student who has the
task to build the robot receiving instructions from the designer and Lego/Arduino pieces from the technical-assembler), and the validator (responsible for the check of the robot assembly, observing the instructions on the computer). This roles assignment is very important for student to learn to cooperate and simulate a real-life scenario where workers are building a solution out of the available resources.
All these characteristics of ER make it stand out from the crowd of possible applications of robots in the field of education. Many authors use the term Robotics in Education (RiE) as a synonym for Educational Robotics (ER), but this cannot be the case. Even if some literature uses “Robotics in Education” and “Educational Robotics” as synonyms (Benitti, 2012; Eguchi, 2017), a distinction should be made between the two labels to bring clarity in reporting such experiences and thus enhancing analytic approaches in reviewing them, which is preliminary to the synthesis of a definition for ER that could be used in further research in this field and establishing a common ground to develop sound research methods.
Robotics in Education (RiE) is a broader term referring to what Robotics can do for people in Education. For example, it can help impaired students to overcome limitations or it can help teachers to gain attention or to deliver content to pupils. Educational Robotics (ER) refers to a specific field which is the intersection of different kind of expertise like Robotics, Pedagogy and Psychology. ER builds on the work of Seymour Papert, Lev Vygotsky, Jean Piaget (Ackermann, 2001; Mevarech and Kramarski, 1993; Papert, 1980;
Vygotsky, 1968) to bring not just robotics in education, but to create meaningful experiences on Robotics since an early age (Scaradozzi, Cesaretti, Costa, Screpanti and Zingaretti, 2019; Scaradozzi, Sorbi, Pedale, Valzano, & Vergine, 2015). ER is made of robots allowing a construction/deconstruction and programming activity, teachers/experts facilitating the activity, methodologies enabling students to explore the subject, the environment, the content of the activity and their personal skills and knowledge. These key elements of ER make it an integrated approach to STEM (Brophy, Klein, Portsmore and Rogers, 2008) and an interdisciplinary and transdisciplinary subject (Eguchi, 2014).
Scaradozzi, Screpanti and Cesaretti (2019) identified four different features to describe a RiE experience or project: the learning environment, the impact on students’ school curriculum, the integration of the robotic tool in the activity, the way evaluation is carried out. Regarding how the robotic tool is integrated into the activity
we can distinguish ER as a subset of RiE (Figure 8).
Students can learn in a variety of settings (e. g. at school, at home, in an outdoor environment). Each setting is characterised by the physical location, learning context and cultures. Usually, each setting holds specific rules and ethos to defines relationships, behaviours and learning activities. It’s authors opinion that it is important to specify in a RiE activity whether the learning
environment is formal or non-formal. Formal education is usually delivered
by trained teachers in publicly recognised organisations providing structured activities and evaluation. Non-formal education can be a complement to formal education, but it may be apart from the pathway of the national education system, consisting in a shorter activity. Usually, non-formal activities lead to no qualification, but they can have recognition when they complete competences otherwise neglected. Formal environment is where formal education usually takes place (e.g schools) and non-formal environment is where non-formal education usually happens (e.g. private houses, company’s headquarters, museums). Teaching methodologies, spaces, furniture and many other variables influence the outcome of a RiE or an ER activity, but they are out of scope in this part of the classification, which intends to make a distinction at a broader level.
The way activities are integrated in education strongly impacts their design and their expected outcomes. Activities carefully designed to fit the curriculum needs, carried out regularly in the classroom to support students’ learning of a concept and whose evaluation is recognized in the final evaluation of the school on students is a curricular activity. Seldom activities organized to better support the teaching of particular concepts, both inside and outside the classroom, and that lead to no final formal recognition are non-curricular activities. There may be activities performed at school (formal learning environment) that do not account for the final evaluation of the student (non-curricular activity). On the other hand, there may be an activity performed outside the classroom environment (non-formal learning environment) that is recognised into the final evaluation of the student provided by school (curricular activity).
Robotic tools that are used into the activities should be distinguished
according to the purpose they serve in the educational context. First, they can reduce the impairments for students with physical disabilities. These tools are usually medical devices that help people in their activities of daily living, and they compensate for the lost function. This kind of robots are
Assistive Robots and they are not intentionally produced to meet the need of education, but to meet the needs of impaired people. Second, some robots can help people with a social impairment (e. g. Autistic Spectrum Disorder). This kind of robots can be defined as Socially Assistive Robots, because they are capable of assisting users through social rather than physical interaction (Matarić and Scassellati, 2016). Socially assistive robots “attempt to provide the appropriate emotional, cognitive, and social cues to encourage development, learning, or therapy for an individual” (Matarić and Scassellati, 2016, p. 1974). Third, some robots can be companions to students’ learning or to teachers’ while teaching (Belpaeme, Kennedy, Ramachandran, Scassellati and Tanaka, 2018). These robots are called Social Robots, because they are designed to interact with people in a natural, interpersonal manner to accomplish a variety of tasks, including learning (Breazeal, Dautenhahn and Kanda, 2016).
Fourth, robots can be a tool to study Robotics, STEAM subjects and to develop transversal skills. ER projects use this kind of robots. Generally, they are presented to students as disassembled kits to give the possibility to create meaningful interdisciplinary pathways, letting students be free to build original artefacts. To build an artefact with fully functioning actuators and sensors, students need to master the fundamental concepts about Robotics. Only when these concepts are reworked and absorbed by students, they can feel confident in reusing that kind of knowledge in another context. So, one of the main features of ER it’s the basic understanding of Robotics fundamentals.
Evaluation in RiE activities could be carried out by using a qualitative
method, a quantitative method or a mixed-methods approach. Qualitative methods in education pertains to research and to everyday practice. Teachers and researchers can analyse essays, focus groups, scenarios, projects, case studies, artefacts, personal experiences, portfolios, role play or simulation and many other outputs of the activities. This is a deep and rich source of information on students’ learning, but sometimes impractical in a crowded classroom and always vulnerable to personal biases or external influence. On the opposite, quantitative methods are easier to replicate and administer. They try to summarize with numbers the outcome of an activity. Common tools in quantitative methods are based on questionnaires, tests and rubrics. Anyway, experiments and empirical method should be applied to prove these methods valid, reliable and generalizable. Moreover, a quantitative evaluation in education is often deemed as poor and reductive.
Lately, researchers in education have been overcoming the historical distinction between qualitative and quantitative methods to exploit the beneficial aspects that both methods provide. Researchers have been proposing the mixed methods approach as an appropriate research method to address problems in complex environments, like education. The choice of mixed-method design is usually well motivated because it could imply a lot of work as it requires that both quantitative and qualitative data are collected. In the last years some novel real-time techniques have been introduced to monitor students during their activities. Technology and artificial intelligence seem to be promising in providing feedback on students’ learning and in integrating both qualitative and quantitative methods of assessment. Moreover, it could be deployed into classroom seamlessly and give response on the activity to support the assessment.
1.2 Measurement and modelling in ER research
As already stated in the previous subsection, evaluation of activities pertains to teachers and observer. An observer can evaluate the phenomena in front of him/her mainly by means of two methodological approaches: quantitative and qualitative (Firestone, 1987).
Quantitative methods, including experimental and quasi-experimental, are rooted in a positivist philosophical tradition and they are used in education research (Kapur, Hung, Jacobson, & Voiklis, 2007; Suthers & Hundhausen, 2003) to establish causal or quasi-causal explanations of design or intervention effects versus control or comparison conditions. Qualitative approaches have a phenomenological philosophical basis and are used to describe and to understand educational contexts and environments (Twinning et. al, 2017).
Since the late 1980s it has become increasingly common for educational researchers to use both quantitative and qualitative methods in a complementary manner (Firestone, 1987). Nonetheless Benitti (2012), Alimisis (2013) and Toh et al. (2016) report that there is a lack of quantitative studies in the literature about Educational Robotics.
Considering the target of the evaluation, evaluation can focus on performance, attitude and behaviour. Performance measurement can be a test whose aim is to evaluate the knowledge acquired on the subject and/or the ability to use it to perform a task (Blikstein, Kabayadondo, Martin and
Fields., 2017; Di Lieto et al., 2017; Screpanti et al., 2018b) or it can be based on neuropsychological measures (Di Lieto et al., 2017).
Complex task evaluation can be related also to the development of skills, not only knowledge. Moreover, written tests more often reflect theoretical knowledge, while practical exercises or tests demonstrate applied skills. Attitudes and skills are more often measured through surveys and questionnaires (Atmatzidou and Demetriadis, 2016; Cesaretti et al., 2017; Cross, Hamner, Zito and Nourbakhsh, 2017; Di Lieto et al., 2017; Goldman, Eguchi and Sklar, 2004; Lindh and Holgersson, 2007; Screpanti et al., 2018a; Weinberg, Pettibone, Thomas, Stephen and Stein, 2007), which are easy to administer and useful for triangulation. Measures of student’s behaviours in ER activities can help the design of the learning environment as well as deepen understanding of how students learn (Kucuk and Sisman, 2017).
Another distinctive feature of evaluation regards when to measure. Measurements (or evaluation of a student’s state) can be performed before the activity, iteratively during the activity and after the activity. In addition to this, stating the purpose of evaluation can help researchers and teachers to clarify how and when to perform such assessment. Summative assessment (or assessment of learning) is often related to the outcome of the activity and it is often regarded as the post-activity evaluation which relates to benchmarks. Formative assessment (or assessment for learning) is often a kind of evaluation taking place before the activity, but it can also be iterative, occurring periodically throughout the ER activity. The purpose of formative assessment is to adjust teaching and learning activities to improve student’s attainment. More recently, the field of assessment as learning brought the idea that formative assessment, feedback and metacognition should go together (Dann, 2014; Hattie and Timperley, 2007).
At the end of an ER activity it would be interesting to investigate the process that led to the resolution of a specific problem, or to the design of a software sequence. During an ER activity, students experiment and modify their sequence of instructions or robot’s hardware structure, to obtain a specific behaviour. They usually work in team in a continuous process of software and/or hardware improvement, as specified by the TMI model (Martinez and Stager, 2013). It would be very interesting for an educator to have the chance to observe and analyse this process, but it is not realistic to have one teacher per group that keeps track of the students’ development inside the classroom. New experimentations in constructionist research laid
the way into new possibilities of insights into the students’ learning processes. Evaluation can be performed using the “offline” or “online” method. The offline methods are those assessments gathering information one or more times during the activity and then usually processed later by a human evaluator. The online methods are those assessments “continuously” gathering information on students’ activity (e.g. camera recording students’ behaviour, sensors collecting physiological parameters, log system recording students’ interactions) aiming at providing an analysis of the student’s learning while the student is still exploring the activity. Online methods are usually automated and rely on Educational Data Mining (EDM) and Learning Analytics (LA).
The first applications of these technologies tried to extrapolate information from data gathered from structured online learning environments (Baker, Corbett and Koedinger, 2004; Beck and Woolf, 2000; Berland, Baker and Blikstein, 2014; Merceron and Yacef, 2004): in this type of condition it was easier to deduce relations and recognize patterns in the data. Recent studies (Asif, Merceron, Ali and Haider, 2017; Ornelas and Ordonez, 2017) tried to predict students’ success using machine learning algorithms on data gathered from closed environments.
Blikstein et al. (2014) collected the code snapshots of computer programs to investigate and identify possible states that model students’ learning process and trajectories in open-ended constructionist activities. Berland, Martin, Benton, Petrick and Davies (2013), extending the previous work by Turkle and Papert (1992), registered students’ programming actions and used clustering to study different pathways of novice programmers. This led to the identification of three general patterns: tinkering, exploring, and refining. To evaluate different aspects of constructionist activities, other works relied on external sensors (cameras, microphones, physiologic sensors), and automated techniques, like text analysis, speech analysis, handwriting analysis, and others (Blikstein and Worsley, 2016). A key for future developments and experimentations will probably be connected to the availability and cost of implementation of such technological solutions for classroom assessment. External sensors may be more expensive, whereas embedded software solutions and machine learning algorithms could be effective and reliable in extracting evidence of students’ learning process and helping teachers to provide personalised feedback to students. Anyway, as stated by Berland et al. (2014), EDM and LA in constructionist
environment aim at generating complementary data to assist teachers’ deep qualitative analysis with quantitative methods.
A first experimentation that used data mining in the field of ER was conducted by Jormanainen and Sutinen (2012). They adopted the Lego Mindstorms RCX and collected data from students' activities with the main functions of a new graphical programming environment that they designed. They created an Open Monitoring Environment (OME) for the teachers involved, obtaining promising results with decision trees algorithm (J48 implementation) for classifying students' progress in the ER setting. But probably there were some weaknesses in this experimentation: the kit chosen for the study was anachronistic, indeed in 2012 the new model of Lego Mindstorms (the NXT version) had been on the market since 2006; only 12 students and 4 teachers from primary school were involved, a very low number of participants to validate the method; a new graphic programming environment was developed, but it was without a block-based approach, maybe not so friendly for primary school pupils.
However, the existing quantitative and qualitative methodologies, whether separate or in combination, seems to be not sufficient for providing appropriate information and understandings of the dynamics of educational systems, because the commonly used in quantitative research (e.g., differential equations and statistical modeling) are linear tools that work by breaking a system into its components or parts, studying the parts individually, and then adding the parts together to form the whole. For example, studying the single relation between exposure to ER training and STEM related attitudes may fail to describe the whole picture. Attitudes, knowledge and successful learning trajectories apparently emerge from many stimuli a learner may receive during the treatment. Emergent phenomena in an educational complex system generally have nonlinear properties, which cannot be analysed by adding up the parts because the patterns at the macro-level of a complex system generally have different properties to the constituent parts at the micro-level of the system.
Furthermore, quantitative and qualitative approaches are best suited to explain and understand what has already emerged, providing explanations by analysing measure of central tendency and descriptions by structured or unstructured observation. However, the same trajectory of interactions may not have occurred, even if there had been similar initial conditions. For this reason, Jacobson, Levin and Kapur (2019) suggest that it is necessary to study and explain the patterns that actually unfolded, as well as the space of
possible trajectories that could have unfolded. Moreover, the space of possible trajectories for an educational system is very important for policy purposes.
Traditionally, science has tended to study phenomena in isolation. Today, there is a greater need to develop systemic approaches for designing and understanding the world. Thinking in levels can have considerable impact on interpreting phenomena in all fields of research and Complex systems (CS) theory is having considerable impact on the pure sciences and within many professions such as engineering, medicine, finance, law, and management. For example, the biological perspective of complex systems that highlights interdependence and co-evolution, with emergent patterns formed by self-organization, is now seen as equally important as the traditional perspective of competitive selection in understanding biological evolution (Jacobson and Wilensky, 2006; Kauffman, 1995;).
The foundation of a CS approach may be leveraged to close the gap between theory and method considering the system of a student learning as a whole and calling upon existing frameworks and philosophy in the field, the ontological framework defines the complex macro-behavior of systems, the dynamic micro-interactions of system components, and the emergent mechanisms that produce system outcomes (Mitchell, 2009).
A CS is a collection of interacting components (i.e., those that interfere, cooperate, or collaborate) that gives rise to complex behavior (Mitchell, 2009; Strogatz, 1994). System components may be a material, conceptual, or semiotic forms such as individual students, teachers, and technological objects; motivation, behavioral, affective, epistemological, and cognitive variables; or words, text, symbols, and discourses (Bunge, 2000). Components within CS interact over time to produce emergent outcomes at higher levels of analysis that are characterized by nonlinear behavior such as sudden transitions from one state to another or bifurcations in topological structure. Emergent outcomes are more than the sum of their parts, meaning the complex behavior cannot be reduced to the components that make up the system (Holland, 2006).
To preserve the complex, dynamic, and emergent ontology of interaction of CS models, research should be formulated in a way that represents the changing and interdependent relationships among individuals and observations over time, as well as interactions amongst multiple levels of analyses (Hilpert and Marchand, 2018).
Research questions leading to CS methods and analyses are focused on time-intensive, relation-intensive, or time-relation intensive processes. Questions should correspond to data collection techniques that can provide evidence for interaction dominant processes.
Research questions that reflect time-intensive processes may focus on any unit of analyses undergoing a process that is expected to unfold over time. Methods for collecting time-intensive data range from the use of experience sampling techniques such as the use of diaries and surveys to the use of sensors and video recordings. What defines the method is the microgenetic observation of variables over time.
Relation-intensive processes describe the relationships or interactions among individuals or variables in a system. Research questions about relation-intensive processes focus on identifying the structure of the relationships in a system and the purpose and weight or value of exchanges. Relation-intensive questions may focus on interpersonal relationships, or the focal unit of analysis may be relationships between organizations or psychological constructs. Methods for collecting relationship-intensive data range from observations of behaviour to analysis of existing documents and the use of surveys. Both interpersonal and intervariable relations can be targeted.
Time-relation intensive processes describe both within-and between-element changes over time. Research questions about time-relation intensive processes focus on microgenetic correspondence among social partners, individual and contextual elements, psychological constructs, or intergroup/organizational change over time. Time-relation intensive questions may focus on how individuals and their social partners reciprocally influence each other over time, how multiple psychological phenomena vary together, how group membership change over time, or how individuals influence change in group behavior, to name a few areas of inquiry. Methods for collecting time-relation intensive data range from surveys to observations, video recordings, and sensors (Hilpert and Marchand, 2018).
A range of analytic techniques can be used to investigate CS research questions and study complex, dynamic, and emergent processes. In the quantitative field, Parunak and others (1998) distinguished between equation-based modelling and agent-based modelling for CS research. In agent-based modelling, the goal is to emulate the system by programming components (or agents) that follow behavioural rules, thereby producing
emergent outcomes. In equation-based modelling, the goal is to evaluate a system using observations that are entered into equations. Both are based on the notion that two kinds of entities can be examined, individuals and observables, both with temporal resolution.
Three nonlinear equation-based techniques that can offer novel insight into interaction-dominant educational systems: nonlinear time series analysis, dynamic modelling, and network analysis. These three techniques may be attractive to educational psychologists because they can be used with data sources and data collection methods that are already widely utilized among researchers in the field (Hilpert and Marchand, 2018).
An example of students’ learning that is close enough to ER environment is to be found in Piech et al (2012) where authors focus on the modelling of how a student learns to program by means of a Hidden Markov Model (HMM) where a student is supposed to be in a “state”, or “high level milestone”, that cannot be directly observed (it is a latent variable), but can be evaluated by means of a code snapshot, which is a “noisy sensor” of the latent variable. To identify the finite set of High-level States, the transition probability and the emission probability, authors sampled 2000 snapshot from a programming exercise and clustered the sample by means of K-mediods. From the analysis of the high-level states dead end of exercises and other recognisable students’ developmental progress were found. Moreover, the model was used to predict performances of students in midterm exam with successful results from implementation. This accounts for the belief of the authors on this approach being more promising than the data-driven methodology for improving programming instruction and pedagogy, and for gaining deeper insights into learning in general.
Another example in modelling learning is provided by Stenbeek and van Geert (2013). These authors focus on learning-teaching trajectories as emergent and dynamic phenomena resulting from the interactions in the entire educational context, in particular the interaction between students and teachers. Two dynamic models are proposed in relation to the two levels of the phenomenon under investigation:
• one focusing on the short-term dynamics of learning-teaching interactions as they take place in classrooms, an agent model whose parameters depend on the preceding history of the student-teacher dyad; the short-term patterns of learning-teaching interaction will cause these parameters to change on the long-term, or to stabilize in the form of a particular attractor states. The dynamic agent model
suggested that student’s learning concerns were not fixed, but that their strengths changed during and as a consequence of the ongoing interaction. It highlighted the dynamic interplay of both student’s and teacher’s concerns and emotional appraisals in forming short-term positive or negative learning experiences. It was shown how not only the student’s, but also the teacher’s level of balance in autonomy-relatedness concern, and a sufficient level of competence concern dynamically constituted teaching-learning processes.
• one focusing on the long-term dynamics of interactions in a network of variables encompassing concerns, evaluations, actions and action effects; technically, every node in the network corresponds with a particular variable, e.g. the student’s current level of his competence concern, but mathematically, each variable is modelled by means of a logistic support equation. The support parameters link every variable to a subset of other variables in the network. The long-term model showed that there exist dynamic relationships between the student’s and teacher’s concerns, emotional appraisals, and the student’s performance level. These dynamic relationships can be supportive or competitive, competing, and symmetrical or asymmetrical, demonstrating that particular patterns of relationships act as control parameters producing emergent learning-teaching trajectories, such as “unsuccessful” or underachievement trajectories.
Another kind of representation of learning is provided by Canuto (2008), whose model assimilates a student to an accumulator and a teacher to a reference provider. This model, even if well-grounded in control systems theory, has a mere comparative purpose. The author himself states that this work is not supported by experimental data.
These few examples of models of students’ learning show that there can be several approaches to modelling learning, but all have in common the need for real data in order to be validated and therefore used to describe and predict reality. Quantitative methods are the best instruments for observing and capturing information on a quantitative level, thus providing the basis to build, evaluate and validate such models.
Section 2 – Evaluation tools
In order to study Educational Robotics learning systems with the Systems theory approach, the sub elements of the system that are of interest should be identified. To simplify this concept, four phases in modelling were identified to represent the fundamental blocks of the system:
1. How can it be studied the learning process? What is learning? Which variables should be considered to be included in the model?
2. Is it possible to establish the causality principle (i.e. given an input at a time t, we have a certain output at the time t)?
3. Metrology: how can we measure the intended variables?
4. Cybernetics: how can we transform information on the output to determine which input to provide?
To answer the first question, the dimensions of the construct learning should be identified and defined accordingly. The quantitative methodology can help to establish the causality principle and to measure the intended variables. In fact, introducing the empirical cycle (Figure 9) into pedagogical research has helped in realising studies whose conclusions are strictly drawn from empirical evidence.
Testing a hypothesis derived from a theory or from observation means that we are respecting six basic rules. First, a hypothesis is empirically testable. This means that it should be possible to collect empirical or physical evidence, or observations, that will either support or contradict the hypothesis. Second, a study and its findings should be replicable, meaning that it should be possible to consistently repeat the original study. A hypothesis is more plausible if it is repeatedly confirmed; this requires that it is possible to repeat or replicate a study. If the expected result occurs only once or in very few cases, then the result could just have been found by chance. Third, anybody should be able to get the same results based on the description of the assumptions and procedures. A researcher should therefore be as objective as possible about assumptions, concepts and procedures. This means that all these elements should be clearly and explicitly defined, leaving no room for subjective interpretation. Fourth, transparency is needed because in science anyone should be able to replicate your results for themselves. Fifth, a hypothesis should be falsifiable, it should be possible to imagine finding observations that will contradict the formulated hypothesis. Sixth, a hypothesis should be logically consistent or coherent, so there shouldn't be any internal contradiction and the conclusions based on our observations should also be logically consistent. Furthermore, in social sciences it is very important to comply with ethical requirements of respect, beneficence and justice.
Introducing the empirical cycle and the positivist/empirical philosophical stance in the present work is very important because it allows the definition of the proper sensors to capture information to solve the first three points of the modelling phase, in particular the metrology and the causality principle. Introducing the quantitative methods as a way to solve the metrological issue requires to follow the rules of the gold standard for this kind of research. Specifically, it will be necessary to demonstrate the internal and external validity of the study and of the instrument. Internal validity means that the experiment, or quasi experiment, avoids confounding (more than one possible independent variable [cause] acting at the same time). The less chance for confounding in a study, the higher its internal validity is. External validity analyses how well data and theories from one setting apply to another. Moreover, reliability should be demonstrated, because a measure is considered reliable if it would give us the same result over and over again. The objects under measurement in the present thesis are constructs: explanatory variables which are not directly observable. For example, an
object's center of mass is certainly a real thing, but it is a construct (not another object). For example, the concepts of intelligence and motivation are used to explain phenomena in psychology, but neither is directly observable. How is it possible to know whether the measure is accurate and reflects the intended construct? The validity of an instrument or manipulation method is commonly referred to as measurement or construct validity. How is it possible to assess construct validity? How is it possible to determine if this score actually reflects the property? Some criteria are available. Firstly, a test can be said to have “face validity” if it appears to measure what it is supposed to measure; typically, an expert in the field provide this kind of validity by evaluating the test. Secondly, the extent to which a measure is related to an outcome is called Criterion validity, which is often divided into concurrent and predictive validity. Concurrent validity refers to a comparison between the measure in question and an outcome assessed at the same time. Concurrent validity reflects only the status quo at a particular time. Thirdly, convergent and discriminant validity can be a proof for construct validity. They can be thought of as a combination of measures of constructs that theoretically should be related to each other are, in fact, observed to be related to each other (that is, you should be able to show a correspondence or convergence between similar constructs) and measures of constructs that theoretically should not be related to each other are, in fact, observed to not be related to each other (that is, you should be able to discriminate between dissimilar constructs).
Not only validity of measurement, but also reliability of measurement should be demonstrated to account for an instrument’s consistency or stability or precision. A reliable instrument will result in highly similar scores if we repeatedly measure a stable property in the same person. There are three types of consistency: over time (test-retest reliability), across items (internal consistency), across different researchers (inter-rater reliability) and over time for the same observer (intra-observer consistency). To visualize the relatedness of validity and reliability of a measure a shooting target can be used. Figure 10 shows four different shooting results, where the center of the target (red dot) represents the true score and the repeated shootings scattered around the center (blue dots) represent the measures taken by our sensor. A reliable measure will result in a dense cloud of blue dots around the same center. A valid measure will result in a cloud of blue dots somehow centered around the true score. A reliable and valid measure will result in a dense cloud of points around the true score.