doi: 10.17265/1934-7359/2019.02.002
Non-linear Analysis of Bridge “Guglie” in Venice:
Sensitivity to Designed and Realized Shape
Daniele Baraldi, Anna Manzato and Antonella Cecchi
Department of Architecture Construction Conservation; Università IUAV di Venezia, Dorsoduro 2206, 30123, Venice, Italy
Abstract: In this paper, numerical non-linear analyses of the “Guglie” bridge, located in the historical city of Venice (Italy), are
proposed. The focus is twofold: on the sensitivity of the realized shape of the bridge by reference to originally designed shape; and on sensitivity to mechanical parameters of constituent materials. The history of this bridge is very interesting, and the bridge actually built is different from the Marchesini’s project (1580). In fact, in the original design drawing, the shape of the arch is a perfect circle arch, while the shape of the actually built arch is not perfectly circular. Hence, in the aim to evaluate sensitivity of bridge behaviour to designed and realized shape, non-linear analyses are carried on by means of FEMs (Finite Element Models) under in-plane state hypothesis. Furthermore, parametric tests are also performed for evaluating the influence of masonry mechanical parameters on non-linear bridge behaviour.
Key words: FEM, masonry bridge, pushover analysis, parametric tests, Mohr-Coulomb yield criterion.
1. Introduction
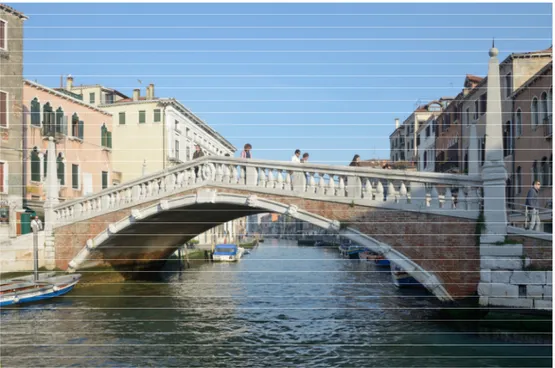
In this research, a study for the evaluation of sensitivity of mechanical behavior of historical bridges to arch shape is proposed. The case study of “Guglie” bridge (Fig. 1) in Venice is adopted for performing numerical tests.
The analysis of masonry arch bridges is an active field of research for the community of Architects and Civil Engineers. Many arch bridges made of masonry were studied both with in situ or laboratory experimentations, together with the numerical simulations of the tests [1-11].
As well known, historical buildings are often subject to different design and construction phases, furthermore structural damage due to settlements and/or external actions require subsequent restorations that may modify the original geometry of the structure and the mechanical characteristics of the materials.
This research aims to evaluate the sensitivity of arch shape in the structural non-linear behavior of
Corresponding author: Daniele Baraldi, Ph.D., Assistant
Professor of Structural Mechanics, research interests: mechanics of materials and structures, computational mechanics, masonry structures. E-mail: [email protected].
bridge. Structural pushover analyses are developed by means of Finite Element code Strand/Straus7 [12]. A numerical 2D model, under plain strain assumption, is proposed both for the designed and the actually realized bridge, also accounting for material parameters.
The non-linear behavior of the different materials of the bridge (masonry, Istrian stone, filling material) is modelled by means of a Mohr-Coulomb yield criterion. In the following, after a brief description of bridge history and its geometric characteristics, a critical analysis of numerical results is presented.
2. Historic Background and Geometric
Characteristics of the Bridge
The “Guglie” bridge (Fig. 1), located in the “Sestiere di Cannaregio” is one of the 430 bridges that connect the 121 islands of Venice; it is one of the most important and ancient of the city [13-15]. As typical of historic bridges, it is made of masonry and Istrian stone. The name “Guglie”, is due to the presence of a sort of slender stone pyramids with square base placed at the four corners of the bridge [13].
D
The Guglie bridge was built in wood in 1285; in 1580, the wooden bridge was replaced by the current arch bridge in masonry and Istrian stone, completed with parapets, on the basis of the project designed by Marchesini, as highlighted by existing inscriptions on the bridge. Important restorations were made in 1641, 1760 and 1777, and consistent interventions were realized in 1823 and 1871, related to the stairs of access. In 1987, an important restoration and static consolidation was carried out [14].
The actually built bridge is different from the Marchesini’s projects, as it can be seen by comparing Figs. 2 and 3. In the original design of the bridge, the shape of the arch is a perfect circle, while the shape of the current arch, which was surveyed during the last restorations, is not perfectly circular. Two hypotheses may be proposed to explain this difference; the former
may be referred to realization phase and technical problems: i.e. disarmament operations of the rib or possible settlement of the structure over the centuries; the latter may be referred to different choices during the realization phase.
Several materials made the arcade, most of the vault is made in brick, while the two arches of head are made of Istrian stone. The gothic texture is used, the size on average is similar to the gothic brick (27×14×6.5 (cm3)).
The bridge presents an angle from one pedestrian bank to the opposite side that measure 79° (degree). The dimensions of bridge are: span equal to 19.68 (m); rise equal to 4.45 (m); thickness in correspondence of the keystone and the crown equal to 0.38 (m); thickness in proximity of the springing equal to about 0.83 (m).
Fig. 1 Picture of “Guglie” bridge.
a b
3. Numerical FE Models
In order to evaluate the sensitivity of the actual bridge shape with respect to the designed one, several numerical tests are performed by focusing on the non-linear behavior of the bridge. For this purpose, an FE Model, under in-plane state hypothesis, already adopted for performing static and modal analysis of the bridge [16], is here extended to the non-linear field. Due to existing numerical tests and thanks to a recent structural dynamic identification of the bridge, elastic mechanical parameters do not need further calibrations, whereas several considerations will be done about non-linear parameters, namely Mohr-Coulomb parameters such as cohesion and friction angle.
3.1 Geometry of the Models and Materials
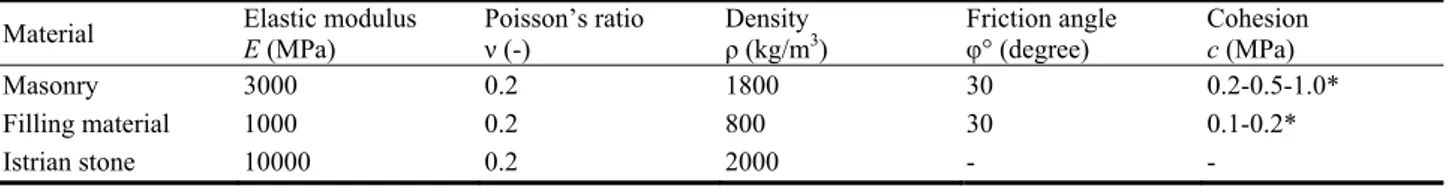
Standard isoparametric quadrilateral elements are adopted for both models (Figs. 4 and 5). Plane strain conditions are assumed. The model considers a generic longitudinal section of the bridge; hence three different materials are adopted for the FE model, listed in Table 1. For each material, an isotropic elastic-plastic behavior is assumed, with material non-linearity taken into account by means a Mohr-Coulomb yield criterion, that allows to account for tensile and shear failure of the materials, without considering failure in compression.
The first material is the masonry adopted for the load-bearing arch, depicted with color red in Figs. 4 and 5. The actual masonry texture is not taken into account and, as previously stated, an isotropic behavior is assumed for the material, by adopting an elastic modulus equal to 3,000 (MPa) that is typical
for masonry made by historical artificial clay bricks. A friction angle equal to 30° is assumed and three cohesion values equal to 0.2, 0.5, and 1 (MPa), are adopted, in order to consider masonry made with historical lime mortar. Then, the second material is the fill placed at the extrados of the masonry arch, depicted with color green in Figs. 4 and 5, and characterized by a smaller elastic modulus and density with respect to the structural arch and two different values of cohesion: 0.1 and 0.2 (MPa), which account for the low quality of the material. Finally, the third material is the Istrian stone placed on top of the fill, depicted with color orange in Figs. 4 and 5. Due to its limited thickness with respect to the other portions of the arch, the non-linear behavior of this material is not taken into account. Each model presents the following restraint conditions: horizontal displacements set equal to zero at the nodes along vertical external edges, vertical and horizontal displacements restrained at the base nodes of the arch. Both models are characterized by similar numbers of FEs, close to 500 and, consequently, degrees of freedom, close to 600. In particular, two FEs are considered along masonry arch thickness. It is worth noting that both models consider also the presence of the weight of parapets, which are made with Istrian stone and are added as nodal non-structural masses along the extrados of each arch shape (Fig. 6).
4. Numerical Experimentations and
Discussion
Numerical tests are performed by applying a non-symmetrical increasing point force at the extrados of the arch, in addition to the self-weight of the bridge,
Table 1 Mechanical parameters of the different materials adopted for the FE models.
Material Elastic modulus E (MPa) Poisson’s ratio ν (-) Density ρ (kg/m3) Friction angle φ° (degree) Cohesion c (MPa)
Masonry 3000 0.2 1800 30 0.2-0.5-1.0*
Filling material 1000 0.2 800 30 0.1-0.2*
Istrian stone 10000 0.2 2000 - -
Fig. 3 FEM of the designed bridge.
Fig. 4 FEM of the actually built bridge.
Fig. 5 Bridge with non-structural masses representing stone parapets.
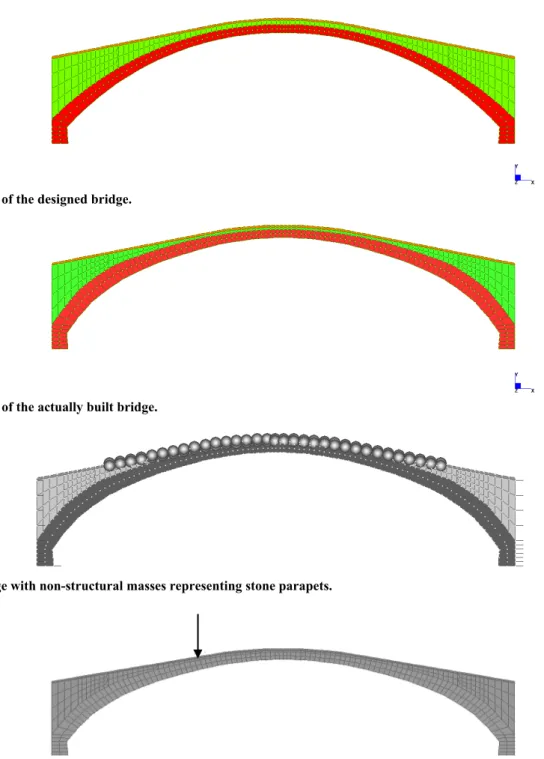
Fig. 6 Bridge subject to a non-symmetric point force.
in order to simulate a possible concentrated eccentric load over the bridge and with the aim to activate a non-symmetric collapse mechanism. Such approach was often adopted for studying masonry bridge behavior and collapse mechanism by means of both laboratory and in-situ experimentations, together with the corresponding numerical simulations [1-11]. In this case, the force is applied at 5.90 (m) from the left
edge of the arch (Fig. 7) and the corresponding vertical displacement is measured.
4.1 Pushover Analysis to Compare Designed and Actually Built Bridge Models
The first pushover analysis is performed on both bridge cases, assuming the largest cohesion values for masonry and fill (Table 1), namely c = 1 (MPa) for the
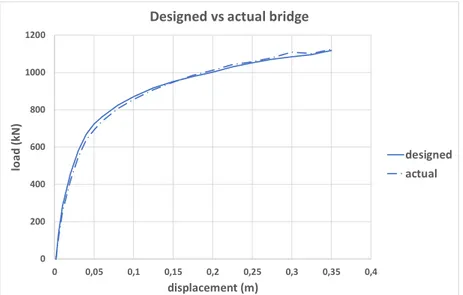
masonry and c = 0.2 (MPa) for the fill, for obtaining an upper bound for the following tests. The two bridge types—designed and actually built—turn out to behave similarly (Fig. 11), as showed by the pushover curves. Both analyses are characterized by an initial elastic behavior up to 300 (kN) and a vertical displacement close to 0.01 (m), then the stiffness of the model starts to decrease, with an important force-displacement slope reduction after 600 (kN) corresponding to a vertical displacement close to 0.04 (m). Finally, both bridge types—designed and actually built—are still able to carry an increasing load, but the analyses are stopped close to 1,100 (kN) and a vertical displacement equal to 0.35 (m).
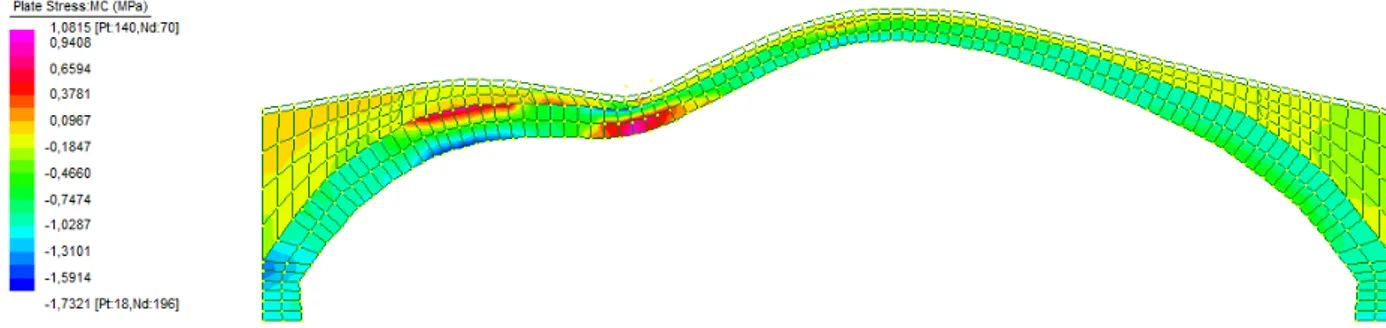
Fig. 8 shows the deformed shape and a map of
combined Mohr-Coulomb stresses of the actually built bridge subject to a concentrated force equal to 300 (kN). At this load level, damage starts to appear along the load-bearing arch below the application point of the increasing force. This condition can be simplified as the opening of a first hinge at the intrados of the arch. Then, with 600 (kN) of applied force, Fig. 9 shows the development of a second damaged zone, namely a second hinge, at the extrados of the load-bearing arch, at the left side of the applied force, at almost 2.30 (m) from the left edge of the bridge. Finally, Fig. 10 shows a third damaged zone obtained when the force approaches 1,000 (kN), along the extrados of the arch, at the right side of the applied force, at 10.35 (m) from the left edge of the bridge.
Fig. 7 Deformed shape and Mohr-Coulomb stresses for the actually built bridge with a force equal to 300 (kN).
Fig. 8 Deformed shape and Mohr-Coulomb stresses for the actually built bridge with a force equal to 600 (kN).
0 200 400 600 800 1000 1200 0 0,05 0,1 0,15 0,2 0,25 0,3 0,35 0,4 lo ad (kN) displacement (m) Designed vs actual bridge designed actual
Fig. 10 Pushover analysis of designed and actually built bridges having masonry with c = 1.0 (MPa) and fill with c = 0.2 (MPa).
Fig. 8 also shows the beginning of further damage at the right side of the intrados of the load-bearing arch, at almost 16.66 (m) from the left edge of the bridge or 3.85 (m) from the right edge. It is worth noting that due to its deformability and thanks to the self-weight, damage into the fill material is not evident and can be neglected. Hence, a mechanism characterized by three or almost four hinges along the bridge span is obtained and the position of the hinges is correctly alternated along intrados and extrados of the load-bearing masonry arch.
Similar positions of damaged areas have been found with the FE model of the designed bridge, hence the difference between the designed bridge and the actually built one does not influence significantly the behavior of the model.
The actually built bridge here studied is taken as reference for the following parametric tests.
4.2 Pushover Analyses Varying Cohesion for Masonry Load-Bearing Arch
Given that the previous analyses showed that both bridge types—designed and actually built—behave similarly, in this section only the actually built bridge is analyzed. Pushover analyses are carried on for first by setting c = 0.2 (MPa) for the fill and varying the
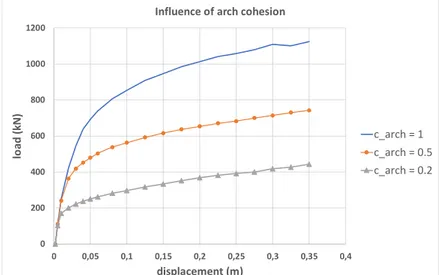
cohesion value of the load-bearing masonry arch by adopting c = 0.2 and 0.5 (MPa). Fig. 12 shows the load-displacement curves obtained with varying arch cohesion. It is evident that this parameter for the load-bearing arch is fundamental and influences significantly the load that can be supported by the model. The initial stiffness of the model does not vary significantly, however, the small cohesion values reduce the initial elastic range of the arch, given that with c = 0.5 (MPa) the slope of load-displacement curve decreases for a force close to 400 (kN) and with c = 0.2 (MPa) the non-linear behavior begins with a force close to 200 (kN). This aspect is also evident focusing on the damage along the load-bearing arch. The damaged zones that can be simplified in the formation of hinges are generally obtained with smaller displacements with respect to the previous case. In particular, with c = 0.5 (MPa), the first and second damaged zones appear almost simultaneously with a vertical displacement equal to 0.04 (m) (Fig. 13a) third damaged zone is obtained with a vertical displacement equal to 0.12 (m) and a fourth damaged zone corresponding to the fourth hinge along arch intrados is slightly more evident at the end of the analysis and it is obtained with a force close to 700 (kN) (Fig. 13b). With c = 0.2 (MPa), first and second
0 200 400 600 800 1000 1200 0 0,05 0,1 0,15 0,2 0,25 0,3 0,35 0,4 lo ad (kN) displacement (m) Influence of arch cohesion c_arch = 1 c_arch = 0.5 c_arch = 0.2
Fig. 11 Pushover analysis of actually built bridges having masonry with varying cohesion and fill material with c = 0.2 (MPa).
(a)
(b)
Fig. 12 Deformed shape and Mohr-Coulomb stresses for the actually built bridge with c = 0.5 (MPa) for masonry and a force equal to (a) 450 (kN) and (b) 700 (kN).
(b)
Fig. 13 Deformed shape and Mohr-Coulomb stresses for the actually built bridge with with c = 0.2 (MPa) for masonry and a force equal to (a) 200 (kN) and (b) 400 (kN).
Fig. 14 Pushover analysis of actually built bridges having masonry with c = 1 (MPa) and fill material with varying cohesion (MPa).
hinges are obtained with a vertical displacement equal to 0.02 (m) (Fig. 14a) and the third damaged zone is obtained with a vertical displacement equal to 0.08 (m), with a force close to 300 (kN). In this case, the fourth damaged zone in the right half of the arch is not obtained at the end of the analysis but, probably due to the small cohesion value of masonry, the size of second and third damaged zones tend to increase (Fig. 14b) with respect to the reference case considered previously.
4.3 Pushover Analyses Varying Cohesion of Arch Filling Material
The sensitivity of the filling material to behavior of
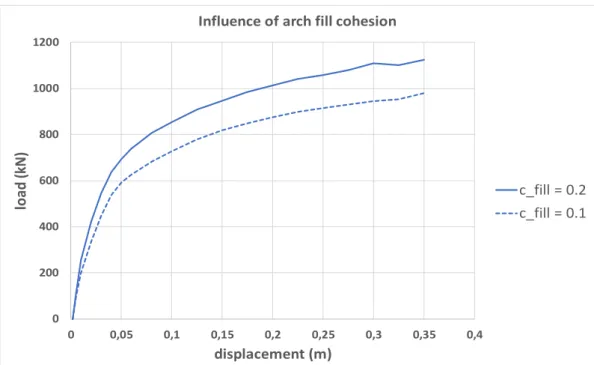
the model of the actually built bridge is evaluated by assuming a smaller cohesion value c = 0.1 (MPa). Fig. 15 shows the corresponding load-displacement curve compared with that obtained in section 4.1. The smaller cohesion of the fill material influences and reduces on one hand the initial stiffness and stiffness decay of the model, on the other hand it reduces also the load supported by the model of the arch bridge, that is generally the 87% of the load obtained with fill cohesion equal to 0.2 (MPa); in particular, a concentrated force close to 1,000 (kN) is obtained with a vertical displacement equal to 0.35 (m). Damaged zones of the arch and deformed shapes, however, turn out to be not influenced by the smaller
0 200 400 600 800 1000 1200 0 0,05 0,1 0,15 0,2 0,25 0,3 0,35 0,4 load (k N ) displacement (m) Influence of arch fill cohesion c_fill = 0.2 c_fill = 0.1
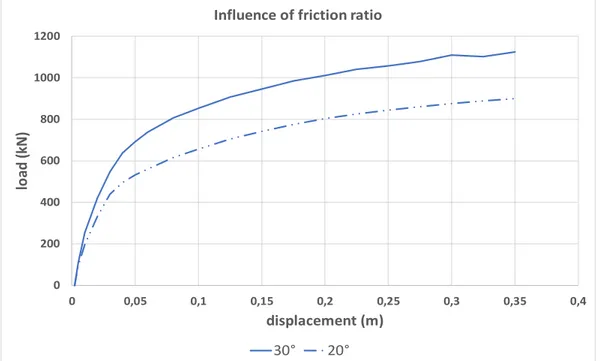
0 200 400 600 800 1000 1200 0 0,05 0,1 0,15 0,2 0,25 0,3 0,35 0,4 lo ad (k N) displacement (m) Influence of friction ratio 30° 20°
Fig. 15 Pushover analysis of actually built bridges having different values of friction angle.
cohesion of the filling material.
4.4 Pushover Analyses Varying Friction Angle of Masonry and Filling Material
A final comparison with respect to the first pushover analysis on the actually built bridge is performed by evaluating the sensitivity of friction angle, that is reduced to 20° for both masonry and fill materials, whereas cohesion values are kept equal to those adopted in section 4.1. Similarly to the previous comparison, the smaller friction angle generally reduces the initial stiffness and the stiffness decay of the model (Fig. 16). In this case, the load supported by the model is generally reduced to the 80% of that obtained in section 4.1; in particular, a concentrated force close to 900 (kN) is obtained with a vertical displacement equal to 0.35 (m). Furthermore, the damaged zones along the masonry load-bearing arch are similar to those obtained with the reference case and three clear hinges and a fourth one partially developed are obtained at the end of the analysis.
5. Final Remarks and Conclusions
In this paper, non-linear pushover analyses of a
masonry arch bridge have been performed. The “Guglie” bridge in Venice has been taken as case study, given that geometric characteristics were determined in past research activities, together with a validation of material parameters by means of structural fast and low-cost identification procedures [16]. A particular aspect of this masonry bridge is represented by the difference between the original design with respect to the actually built structure. Hence, two FE models of the bridge types have been developed by considering the longitudinal section of each arch, under in plane strain hypothesis, and by taking into account three different materials into the section, namely masonry load-bearing arch, filling material and Istrian stone. Material non-linearity has been evaluated by means of a Mohr-Coulomb yield criterion and material parameters such as cohesion and friction angle have been varied in order to account for their influence on non-linear behavior. Pushover analyses have been performed by applying an increasing non-symmetrical point force in the left portion of the bridge, together with its self-weight. The first set of analyses showed that the difference between the designed and the actually built bridge
does not influence significantly the non-linear behavior of the structure, since very small differences have been found in the pushover curves, in the deformed shapes, and in the maps of damage. The collapse of the bridge has been generally characterized by the formation of several damaged zones, which can be considered as hinges along intrados or extrados of the load-bearing part of the bridge. In particular, three clear hinges have been found, causing an evident decay of the stiffness of the structure, whereas a fourth hinge has been found almost at the end of the first set of analysis. Then, the parametric tests showed that the cohesion of the masonry of the load-bearing part of the bridge plays an important role in the overall capacity of the structure, whereas the cohesion of the filling material and the friction angles slightly reduce the stiffness and the strength of the structure.
Further developments of this work will focus on the three-dimensional behavior of the bridge by performing for first a further structural identification of the three-dimensional dynamic behavior of the structure, together with the evaluation of the linear and non-linear behavior of the structure subject to dead and live loads.
Other possible developments of this work will regard the comparison of the FE model proposed here with other analytic models commonly used for arches, vaults and domes [17], and with other numerical models, with particular attention to the DEM (discrete element method) [18, 19].
Acknowledgments
The research was carried out thanks to the financial support of PRIN 2015 (under grant 2015JW9NJT_014, project “Advanced mechanical modeling of new materials and structures for the solution of 2020 Horizon challenges”). The study has been supported by the equipment of research laboratory MIMESI—Material Investigation, Modeling, Environmental, and Structural Identification, web site: (https://sites.google.com/a/iuav.it/mimesi/home/mime
siengl).
References
[1] Pippard, A. J. S., and Ashby, E. R. J. 1936. “An Experimental Study of the Voissour Arch.” Journal of the Institution of Civil Engineers 10: 383-403.
[2] Pippard, A. J. S. 1948. “The Approximate Estimation of Safe Loads on Masonry Bridges.” Civil Engineer in War: Institution of Civil Engineers 1: 365-72.
[3] Heyman, J. 1969. “The Safety of Masonry Arches.” International Journal of Mechanical Sciences 43: 209-24. [4] Heyman, J. 1982. The Masonry Arch. Chichester, New
York: Halsted Press.
[5] Page, J. 1993. Masonry Arch Bridge—TRL State of the Art Review. London: HMSO.
[6] Boothby, T. 1995. “Collapse Modes of Masonry Arch Bridges.” Journal of the British Masonry Society 9 (2): 62-9.
[7] Cavicchi, A., and Gambarotta, L. 2005. “Collapse Analysis of Masonry Arch Bridges Taking into Account Arch-Fill Interaction.” Engineering Structures 27: 605-15.
[8] Brencich, A., and Morbiducci, R. 2007. “Masonry Arches: Historical Rules and Modern Mechanics.” International Journal of Architectural Heritage 1 (2): 165-89.
[9] Reccia, E. 2013. “Conservation of Masonry Arch Bridges. A Procedure for Modelling and Strengthening.” Unpublished PhD dissertation, ETCAEH, University of Nova Gorica.
[10] Reccia, E., Cecchi, A., and Tralli, A. 2013. “Homogenization of Masonry Vault Bridges: Sensitivity to External Stone Arch.” Civil-Comp Proceedings, 102. [11] Reccia, E., Milani, G., Cecchi, A., and Tralli, A. 2014.
“Full 3D Homogenization Approach to Investigate the Behavior of Masonry Arch Bridges: The Venice Trans-lagoon Railway Bridge.” Construction and Building Materials 66: 567-86.
[12] G+D Computing. 1999. Using Strand7 (Guida all’uso di Straus7), Sydney NSW 2000 (Australia).
[13] Resini, D. 2011. Venezia I ponti. Treviso (Italy): Vianello libri.
[14] Zucchetta, G. 1992. Venezia ponte per ponte: ...vita, morte e miracoli …, vol.1. Venezia (Italy): Stamperia di Venezia.
[15] Zucchetta, G. 1992. Venezia ponte per ponte: ...vita, morte e miracoli …, vol. 2. Venezia (Italy): Stamperia di Venezia.
[16] Manzato, A., Trevisani, S., and Cecchi, A. 2017. “Mechanical Model for Bridge ‘Guglie’ through Dynamic Identification Procedure.” In 10th International Symposium on the Conservation of Monuments in the
Mediterranean Basin, Athens, Greece.
[17] Pavlovic, M., Reccia, E., and Cecchi, A. 2016. “A Procedure to Investigate the Collapse Behavior of Masonry Domes: Some Meaningful Cases.” International Journal of Architectural Heritage 10 (1): 67-83.
[18] Reccia, E., Cecchi, A., and Milani, G. 2016. “FEM/DEM Approach for the Analysis of Masonry Arch Bridges.” Paper presented on Computational Modelling of Masonry
Structures Using the Discrete Element Method, IGI Global.
[19] Baraldi, D., de Carvalho, C., Cecchi, A., and Reccia, E. 2019. “Discrete and Finite Element Models for the Mechanics of Unreinforced and Reinforced Masonry Arches.” Paper presented on MuRiCo6, Mechanics of Masonry Structures Strengthened with Composite Materials.