Summary
Figures index ...1-4 Introduction...1-6 1 DNA hybridization sensors...1-10 1.1 The nature of genetic information ...1-10 1.2 DNA analysis areas and techniques ...1-12 1.2.1 Genetic information extraction cycle...1-14 1.2.2 Sequencing by Hybridization Mechanism ...1-16 1.2.3 DNA Microarray ...1-18 1.3 Hybridization signal detection...1-20 1.3.1 EC detection ...1-20 1.3.2 Optical detection ...1-29 1.4 Proposed solutions ...1-41 1.4.1 Chemiluminescence detection...1-43 1.4.2 Gold plus Silver precipitation photodetection ...1-44 2 PN Junction Photodiodes...2-46 2.1 Introduction...2-46 2.2 Absorption Process ...2-46 2.3 PN Photodiodes Principles...2-53 2.4 Quantum Efficiency and Responsivity ...2-55 2.5 Dark current...2-60 2.6 Equivalent Circuit ...2-64 2.7 Noise analysis and NEP...2-66 3 Device Structures Design ...3-70 3.1 Design Specifications ...3-70 3.2 Proposed Device Structures...3-72 3.2.1 Striped Cathode Structure ...3-73 3.2.2 Single Cathode Structure...3-75
3.2.3 Possible Structures Variations ...3-77 3.3 Devices Modeling and Simulations ...3-79 3.3.1 Detection Regimes ...3-79 3.3.2 Striped Structure Modeling and Simulations...3-81 3.3.3 Single Cathode Structure Modeling and Simulations...3-91 4 Final Design...4-94 4.1 Sizes and Voltages...4-94 4.1.1 NEP quantitative evaluation...4-96 4.2 Electrodes ...4-97 4.3 Final Array ...4-99 4.4 Layouts...4-100 References...4-104
Figures index
Figure 1 DNA double-helix structure...1-11 Figure 2 DNA double-helix structure...1-12 Figure 3 Polymerase Chain Reaction ...1-15 Figure 4 SBH principle...1-17 Figure 5 Steps of bridge formation...1-22 Figure 6 Schematic of DNA detection system ...1-23 Figure 7 FET type DNA sensor...1-24 Figure 8 Standard Laser induced Fluorescence detection ...1-30 Figure 9 Molecular beacons ...1-32 Figure 10 Chemiluminescent reaction...1-34 Figure 11 Ruthenium ECL cell...1-38 Figure 12 SPR technique ...1-40 Figure 13 Schematic of the DNA chip ...1-43 Figure 14 Gold plus Silver precipitation detection ...1-45 Figure 15 Photon absorption...2-47 Figure 16 Optical absorption in semiconductors...2-48 Figure 17 Absorption in heavily doped semiconductors...2-50 Figure 18 Absorption coefficient in undoped silicon...2-51 Figure 19 Schematic of a PN photodiode...2-54 Figure 20 Photodetection process of a photodiode ...2-64 Figure 21 Equivalent circuit of a PN photodiode...2-65 Figure 22 Noise equivalent circuit...2-67
Figure 23 Luminol reaction ...3-70 Figure 24 Cross section of the BCD6 process...3-72 Figure 25 Striped Cathode Structure ...3-74 Figure 26 Single Cathode Structure ...3-76 Figure 27 Equivalent Current vs Equivalent Resistance ...3-80 Figure 28 Striped Cathode Structure Cross Section...3-82 Figure 29 Internal Quantum Efficiency vs Minoritary Diffusion length for different absorption coefficient levels ...3-84 Figure 30 Internal Quantum Efficiency in Depleted Regions vs Depletion Layer Width ...3-85 Figure 31 NEP as function of cathode regions width A and distance D between cathode regions...3-88 Figure 32 NEP vs distance D between cathode regions, K parametric...3-89 Figure 33 NEP as a function of Recombination Lifetime of Minoritary in NWell...3-91 Figure 34 NEP as a function of depletion layer width for different
absorption levels ...3-92 Figure 35 NEP of single cathode structure as function of depletion layer width, K parametric ...3-93 Figure 36 Metalization of Single Cathode Structure...4-97 Figure 37 Striped Cathode Structure Metallization...4-98 Figure 38 Cross Section of n+p- single cathode-buried well structure.4-101 Figure 39 Cross Section of Structure p+n-single cathode-buried well .4-102 Figure 40 Layout of n+p, single cathode, buried well structure ...4-102 Figure 41 Detail of layout of p+n-single cathode-buried well structure....4-103
Introduction
DNA contains instructions for everything our cells do, from conception until death. Studying the human genome—all the DNA in our cells—allows us to explore fundamental details about ourselves. The Human Genome Project, the international quest to understand the genomes of humans and other organisms, will shed light on a wide range of basic questions, like how many genes we have, how cells work, how living things evolved, how single cells develop into complex creatures, and what exactly happens when we become ill. Besides answering innumerable questions about our molecular selves, a deeper understanding of the fundamental mechanisms of life promises to lead to an era of molecular medicine, with precise new ways to prevent diagnose and treat disease.
The Human Genome Project (HGP) began in the United States in 1990, when the National Institutes of Health and the Department of Energy joined forces with international partners to decipher the massive amount of information contained in our genomes. The HGP began with a set of ambitious goals but has exceeded nearly all of its
targets. Frequently ahead of schedule, HGP scientists have produced an increasingly detailed series of maps that help geneticists navigate through human DNA. They have mapped and sequenced the genomes of important experimental organisms. They completed a working draft covering 90 percent of the genome in 2000, and in 2003 they had finished the sequence with accuracy greater than 99.99 percent.
Genes are made of DNA, a long, thread-like molecule. Almost all human cells contain 23 pairs of chromosomes; each chromosome contains a molecule of DNA with hundreds to thousands of genes arrayed along it.
Genes usually code for proteins, the diverse molecules that perform a wide variety of specialized tasks. For example, proteins transmit messages between cells, fight infections, turn genes on or off, sense light and scents and flavors, and form structures, such as tendons and hair. The instructions for making proteins are written with a four-letter alphabet—A, G, C, and T—where each letter represents one of the four chemical units strung together in DNA.
A single misspelling in the DNA sequence can make a protein malfunction, which, in turn, may cause disease. Connecting a gene with a disease was a slow, arduous, painstaking, and frequently imprecise process before the advent of the HGP.
With more and more DNA sequence deposited in electronic databases, researchers spend less time collecting data with their own experiments and more time analyzing the wealth of data available to them. They can electronically scan long stretches of DNA to find genes in the sequence that may be responsible for a particular disease.
Molecular biology has long held out the promise of transforming medicine from a matter of serendipity to a rational pursuit grounded in a fundamental understanding of the mechanisms of life. Genomics will hasten the advance of molecular biology into the practice of medicine. As the molecular foundations of diseases become clearer, we may be able to prevent them in many cases and in other cases, design accurate, individualized treatments for them. Genetic tests will routinely predict individual susceptibility to disease. Diagnoses of many conditions will be much more thorough and specific than now. New drugs, derived from a detailed molecular understanding of common illnesses like diabetes and high blood pressure, will target molecules logically. Drugs like those for cancer will routinely be matched to a patient's likely response.
In these directions, there is the need for inexpensive tools that operate in a variety of environments outside the laboratory. But today the reading of DNA chips is usually based on fluorescence labeling of hybridized target molecules- as it will explained in detail in following paragraphs. Combined with the use of confocal fluorescence scanners, this approach shows very high performances in terms of accuracy and sensitivity, but remains costly and not transportable. This prevents the use of DNA chips, both for decentralized testing (point of care, air or water control, food testing . . .), and as a routine tool in the field of diagnostics, where this technique has to replace existing tests.
That’s in this direction, in an effort to reduce the size and cost of the reader, that our work takes place.
In the first chapter, after an analysis of DNA chips state-of-art, proposed solutions, which are based on optoelectronic detection mechanisms, will be explained. In the second chapter, photodiodes operation principles will be pointed out, as optoelectronic chips we will design will be based on the use of photodiodes as chemiluminescence detectors. Then, in the third chapter design of photodiodes optimized at wavelength we have to reveal will be exposed. Finally, the forth chapter will describe final design steps and layouts of proposed structures.
Decades from now, many potential diseases may be cured at the molecular level before they arise. All these changes aren't likely to come quickly. It will take a long time to understand the human genome. But access to genome sequence will increasingly shape the practice of health care over the coming decades, as well as shed light on many of the mysteries of biology.
1 DNA hybridization sensors
1.1 The nature of genetic information
Genetic information in humans is stored in the cell chromosomes. Each chromosome consists of long, compactly packed, super coiled linear polymer strands of deoxyribonucleic acid (or DNA). The chromosome information is stored as a long string of DNA fragments grouped as genes, each expressing an identifiable function or characteristic of the organism. In humans, for example, each of the 46 chromosomes is 50-400 x 10^6 units long. The units of a single DNA strand are called nucleotides. Each nucleotide consists of a base, a sugar linkage, and a phosphate bridge (P), as shown in Fig. 1. The sugar linkage gives the nucleotide directionality with two distinct ends labeled 5’ and 3’. There are four types of nucleotides corresponding to four different bases: adenine, guanine, cytosine and thymine, commonly labeled A, G, C, and T. Nucleotides can only be linked in a specific direction forming single strands of DNA. Individual bases are hydrophobic, but strands of DNA are quite soluble in water due to the polar backbone. Single-stranded DNA tends to attach (or hybridize)
through weak hydrogen bonds to another strand of complementary base pairs (G-C and A-T), forming a double strand or duplex (Figure 1). Double stranded DNA is more stable in water because the hydrophobic bases are hidden by hydrophilic backbones.
Figure 1 DNA double-helix structure
The distance between two bases is 3, 4 Ǻ, helix diameter is about 20 Ǻ, and each phosphate group brings one negative charge. Finally, Melting Temperature varies from 77 to 100 °C if %C-G couples, that have a stronger bond than A-T couples, varies from 20 to 78; that’s because C-G couple hybridizes through three hydrogen bonds, while A-T couple through two. So Melting Temperature depends by bases composition, and then it depends by bases hybridization mismatches (1°C for 1% bases mismatch).
Figure 2 DNA double-helix structure
1.2 DNA analysis areas and techniques
DNA analysis areas can be divided into three main inter-related groups, which are:
• Sequencing, that is the reading of the sequence of bases that forms a particular DNA strand; it serves for gene discovery or identification; • Expression analysis, that includes both identification of differentially expressed genes and quantification of expression levels, which are important in growth, metabolism, development, behavior and adaptation of living systems. Expression analysis, among other applications, contributes to finding correlations between the genetic profiles of patients and therapeutic response to drugs or to toxic agents, which act at the transcription level to disrupt or alter cellular
function. Consequently, it’s a powerful tool for to facilitate individualized medicine, drug discovery and toxicogenomics;
• Disease diagnosis and mutation detection, for example detection of viral infection and pathogen mutation, and identification of genes that have been upregulated or downregulated. The identification of these pathogens, infectious species and drug-resistant mutants at the molecular level can contribute to better understanding of the disease processes and to early, efficient diagnosis.
Related to these three areas is polymorphism identification, which is identification of differences in gene sequences among individuals. These variations, commonly referred as single nucleotide polymorphism (SNPs), often indicate genetic predisposition towards disease and drug response and can be linked to genotype and phenotype information of individuals.
For each of these groups what is identically required is the recognition event of a particular sequence of nucleotides. In fact, in some applications it could be needed to read a sequence (discovery), in some other to find a particular sequence among others (identification, disease diagnosis) or to quantify level of presence of a certain sequence (expression analysis); anyway, recognition of a particular sequence of bases is the basic and common idea, while the approach to the recognition event will vary depending on the analysis final goal. Thirty years ago, the best methods to sequence DNA were the Sanger method, based on the dideoxy chain termination, and the Maxam and Gilbert method based on the chemical cleavage, which were laborious
and time-consuming. Soon after those, methods of “sequencing by hybridization” (SBH) simplified the process. However, the most important advance in DNA analysis did not appear until the last decade, with the advent of DNA sensor and arrays, which overcame the problems of the previous technologies, such as low hybridization efficiency, poor sequence discrimination, long analysis time and laborious procedures.
Next paragraphs describe the entire procedure for nucleotides sequences recognition. A completed and detailed overview on DNA sensors could be found in 1.
1.2.1 Genetic information extraction cycle
Conventional genetic assay protocols use four fundamental chemical procedures for the analysis of DNA: amplification, labeling, restriction, detection.
DNA samples are often present at concentration levels that are too low for any direct test. Therefore, chemical amplification is used to increase the concentration of the sample. The amplification basically consists of a set of reactions that allow a DNA molecule or fragment to duplicate. Further amplification is hence obtained by repeating the procedure. Amplification factors as large as 2 are common, which permit detection based on single DNA molecules.
Several schemes can be used for amplification, but all of these use powerful enzymes. In particular, polymerase enzymes assemble complementary strands of DNA from a single-strand fragment. This
enzyme scans single strands of DNA and, starting from a specific location, captures matching nucleotides from solution and connects them to the single strand, assembling the complementary strand one base at a time like a zipper.
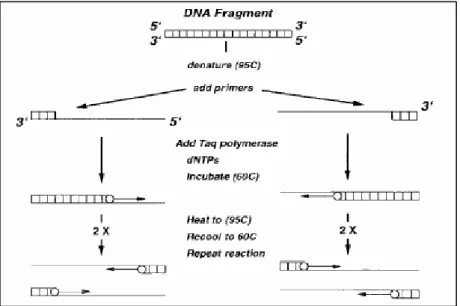
Molecular replication takes place when a double-stranded fragment is first thermally separated (or denatured) into two strands followed by the polymerase action. This procedure is known as polymerase chain reaction (PCR), shown in Figure 3.
Figure 3 Polymerase Chain Reaction
Then, usually next step is labeling of DNA. In fact, mostly used methods for reading DNA sequences are based on the detection of a particular label (“indirect” detection) and not of an effect derived from a physical property of DNA (“direct” detection).
Label-free strategies lead to short analysis times and simple operation protocols and eliminate possible undesiderable effects such as instability of label. However, the cost of instrumentation and the operational requirements of current label-free techniques tend to be greater, so label-dependent techniques are broadly used. Different labels usually used will be analyzed in the next paragraphs.
The analysis of replicated DNA then often involves fragmentation (or digestion) of the molecule. Restriction endonuclease enzymes split double-stranded DNA at specific locations. Restriction enzymes are essential for analyzing chromosome structure and sequencing very long DNA molecules.
Most enzymes recognize short DNA sequences of four to eight base pairs, cleaving the fragment at this site at a point of symmetry. Restriction enzymes are used to cleave DNA molecules into specific fragments that are more readily analyzed.
Final step is the reading of base-pair sequence of DNA fragment, which will vary according to labeling and to reading idea. Particularly, let’s understand the powerful idea of SBH as nucleotide reading method.
1.2.2 Sequencing by Hybridization Mechanism
For reading a nucleotide sequence, first approach we could think may be reading sequentially each base. But DNA double helix structure, in which each strand is complementary to the other, offers the possibility to have a specific and robust recognition event of a certain sequence,
For this reason, that is their intrinsic molecular base pairing ability, nucleic acids are a natural choice as recognition elements in DNA chip. But let’s explain better this sequences reading mechanism.
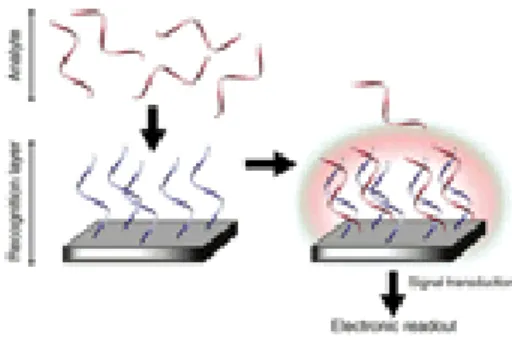
Let’s suppose to have a sensors array, and that different ssDNA n-length fragments are immobilized upon each of these sensors; these fragment are called “probes”. If we put this array in a solution containing ssDNA n-length fragment, called “target”- whose sequence is the one we want to know- that fragment will hybridize only with one of the immobilized probes. Then, target hybridization will be coupled to a signal generation scheme, and signal detected will tell exactly where hybridization event occurs and which sequence is complementary to the one we want to read.
Figure 4 SBH principle
So, the essential role of the sensor is to provide a suitable platform that facilitates formation of the probe-target complex in such a way that the binding event triggers a usable signal for electronic readout.
How the recognition event is reported depends ultimately on the method of signal transduction, whether it be optical, mechanical or electrochemical.
1.2.3 DNA Microarray
In many genomic applications, it is insufficient to analyze a single sequence. Many diseases are manifested by a multitude of genetic changes. Another area where multiple sequences must be assayed is in gene expression profiling in which hundreds to thousands of sequences must be simultaneously examined in order to observe differences between control and test samples. Ideally, such assays are conducted in a high throughput fashion.
Initial array designs incorporated macroscopic probe spots and manual array preparation. Multiplexed assays were performed in electrophoretic gels and could test for the presence of a few dozen nucleic acid target sequences simultaneously. More sophisticated fabrication protocols have allowed higher density arrays in combination with simpler interrogation designs and parallel processing methods. Simple macroarray designs have included combined multiple single core optical fibers or using manually spotted probes on glass slides. The preparation of more densely packed microarrays often requires more advanced fabrication techniques, such as robotics. Microarrays contain miniaturized sensing elements typically less than 200 µm diameter, with thousands of individual elements per centimeter. High-density microarray platforms are manufactured on
non-porous solid substrates, typically glass, silicon or nylon. Individual probe elements are synthesized either directly on the substrate or deposited after synthesis and positioned to maximize packing density while maintaining separate signal channels. While nucleic acid hybridization experiments can utilize different signal transduction schemes, fluorescence predominates in the microarray field. The most common detection protocols are performed with fluorescently-labeled target strands. The assay conditions are set to optimize complementary sequence binding and minimize non-specific interactions. Hybridizations are performed in chambers to control the assay conditions, including temperature, and are washed to remove non-specific targets. Individual probe spots are measured to quantify target-binding levels. The fluorescence signal can be measured with a simple fluorescent scanning device, but typically a confocal scanner or CCD camera are employed. The dense sensing element positioning provided by microarrays facilitates high throughput data analysis. Standard experiments include single nucleotide polymorphism detection (known and unknown), allele recognition, gene expression profiling and gene sequencing.
1.3 Hybridization signal detection
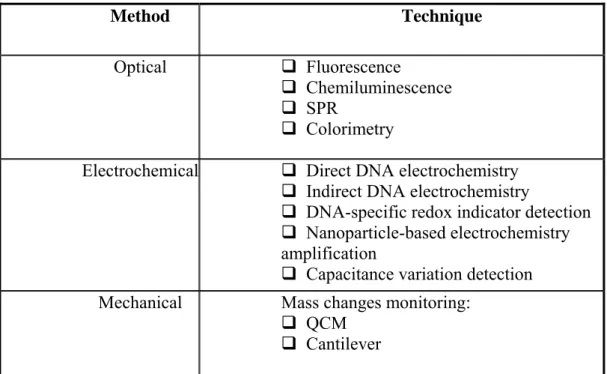
Table below shows all different techniques, which will be described in the next paragraphs.
Method Technique
Optical Fluorescence
Chemiluminescence SPR
Colorimetry
Electrochemical Direct DNA electrochemistry Indirect DNA electrochemistry
DNA-specific redox indicator detection Nanoparticle-based electrochemistry amplification
Capacitance variation detection Mechanical Mass changes monitoring:
QCM Cantilever
Table 1 DNA Hybridization detection techniques
1.3.1 EC detection
Electrochemical methods are well suited for DNA diagnostics. Because electrochemical reactions give an electronic signal directly, there is no need for expensive signal transduction equipment. Moreover, because immobilized probe sequences can be readily
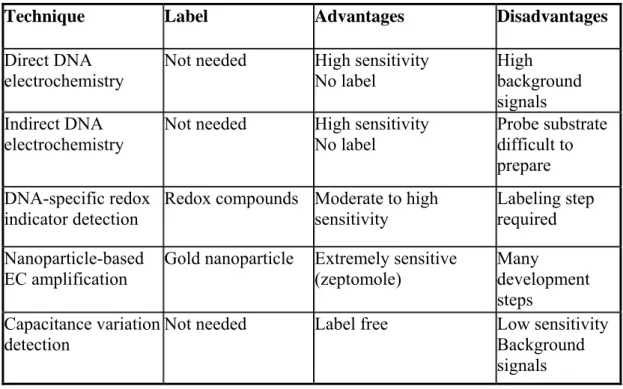
confined to a variety of electrode substrates, detection can be accomplished with an inexpensive electrochemical analyzer. Indeed, portable systems for clinical testing and on-site environmental monitoring are now being developed. Sensitive electrochemical signaling strategies based on the direct or catalyzed oxidation of DNA bases, as well as the redox reactions of reporter molecules or enzymes recruited to the electrode surface by specific DNA probe-target interactions have all been demonstrated. In the table below are shown different EC techniques for DNA hybridization detection.
Technique Label Advantages Disadvantages Direct DNA
electrochemistry
Not needed High sensitivity No label
High background signals Indirect DNA
electrochemistry Not needed High sensitivity No label Probe substrate difficult to prepare
DNA-specific redox indicator detection
Redox compounds Moderate to high sensitivity
Labeling step required Nanoparticle-based
EC amplification
Gold nanoparticle Extremely sensitive (zeptomole) Many development steps Capacitance variation detection
Not needed Label free Low sensitivity Background signals
1.3.1.1 Nanoparticles EC amplification
Li et all2 have developed an electrical DNA detection method based on a self-assembly conductive bridge by nano-metallic particles. Target DNA is labeled with gold nanoparticles, so that in cells with complementary probe strand there will be the formation of a conductive bridge (Figure 5).
Figure 5 Steps of bridge formation
The micro-DNA array can be fabricated using the last two layers of metallization in a standard CMOS process with minimal modifications. Using this method, they have fabricated a simple DNA array with the smallest cell size down to 7µmx5µm arranged in a DRAM like configuration (Figure 6). The resulting conductivity differentiation from matched and unmatched DNA molecules is more than nine orders of magnitude, which can be easily detected by a simple CMOS readout chip.
Figure 6 Schematic of DNA detection system
1.3.1.2 Capacitance variation detection
This method allows avoiding the DNA labeling step. In fact, the idea is to use intrinsic properties (charge, structure…) of DNA, that when hybridize onto a sensing surface as an electrode, causes variation of thickness and of physical property of the biochemical layer; all these things result in a change of capacitance between the electrode with sensing layer and a reference one.
Guiducci et al.3 proposed a novel methodology for the detection of capacitance changes; the test structure is composed by two gold electrodes that are facing each other across an electrolyte solution. The internal surface of one electrode is coated with a layer that can capture complementary ssDNA. The capacitance change is measured through a capacitance to current transduction that is derived from the charge based capacitive measurement circuits used to characterize on-chip wiring in deep sub-micron ICs. However, the miniaturization of this sensor has still to be realized.
Kim et al.4 also used the idea of a capacitive effect, realizing an FET-type charge sensor. Here the idea is a little different: they have fabricated a field effect transistor based on 0.5 µm standard CMOS technology which can detect the DNA probe’s- immobilized on gate- information on hybridization by sensing the variation of drain current due to DNA charge. It is a P-channel Mosfet because phosphate groups bring negative charges (Figure 7). A shift of threshold voltage was measured.
Uslu et al.5 developed a similar strategy, which is using a EOSFET (electrolyte-oxide-semiconductor FET), sensitive to electrical charge variations that occurs at the surface/electrolyte interface due to hybridization of ssDNA immobilized on the oxide surface of the transistor gate.
Finally, Moreno-Hagelsieb et al.6 presented the possibility of detecting DNA strands by measuring a change of capacitance between interdigitated electrodes made of aluminum fingers coated with a thin alumina layer and constructed over an oxidized silicon wafer.
1.3.1.3 Direct electrochemistry of DNA
The earliest electrochemical DNA sensing strategy was based on reduction and oxidation of DNA at a mercury electrode; simply, the amount of DNA reduced or oxidized would reflect the amount of DNA captured. More than 40 years ago, Palecek and co-workers developed methods to discriminate single- versus double-stranded DNA through direct DNA reduction. More recently, DNA oxidation has been carried out through adsorption stripping voltammetry (ASV). This technique achieves its high sensitivity by inducing an electrostatic buildup of analyte at the electrode surface before the detection step. The purine bases of DNA can be oxidized electrochemically, and this process can be carried out using carbon, gold, indium tin oxide (ITO) and polymer-coated electrodes.
Although this methodology is inherently quite sensitive, its application is complicated by significant background currents at the relatively high potentials required for direct DNA oxidation. Numerical methods to improve the signal-to-noise ratio have been developed, but more recent designs employ physical separation techniques to remove the sources of background interference. For example, Palecek and colleagues7 have separately reported a two-step strategy for capturing target sequences using probe DNA immobilized onto magnetic beads. After target hybridization, the beads are magnetically separated from the pool of analytes. The collected DNA is depurinated in acidic solution, and the free guanine and adenine nucleosides are collected and analyzed using ASV8. As few as 40 femtomoles ( 2 1010 molecules) of substrate have been detected by this assay.
The use of peptide nucleic acid probes affords more stringent control over hybridization, and recent studies have shown that point mutations in target DNA can be more readily discerned using this methodology.
1.3.1.4 Indirect electrochemistry of DNA
Methods to oxidize target DNA indirectly through the use of electrochemical mediators have also been explored. An especially attractive approach uses polypyridyl complexes of Ru(ii) and Os(ii) to mediate the electrochemical oxidation of guanine. For example, Yang and Thorp9 have used this method to detect trinucleotide-repeat expansions, in which catalytic currents due to the oxidation of guanine residues immobilized within the target sequence show a linear dependence on the repeat number.
Experiments with model PCR products have shown that the sensitivity of this system extends down to 550 attomoles of target DNA ( 3 108 molecules).
A noteworthy coding method has also been reported using this approach. In this strategy, chemically modified bases are incorporated into PCR products, and the resulting DNA is detected at an ITO electrode by catalytic oxidation of the modified base. Though remarkably sensitive, it is not clear whether this technique is well suited to clinical diagnostics. The ITO electrode material may or may not be amenable to microfabrication in a multiplexed configuration. Nonetheless, the methodology does provide high sensitivity without complex instrumentation through redox-mediated DNA oxidation.
1.3.1.5 DNA-specific redox indicator
By analogy to fluorescence-based methods, several strategies have been pursued in which target DNA sequences are labeled with redox-active reporter molecules. Appearance of the characteristic electrochemical response of the redox reporter therefore signals the hybridization event10. Using physical separation methods to isolate the labeled sequences, detection limits on the order of 1010 molecules have been reported.
A variation on this approach involves a three-component 'sandwich' assay, in which the redox label has been attached to a synthetic sequence specifically designed to bind an overhang portion of the probe-target complex. This dual-hybridization approach eliminates the need to modify the target strand, whose function is to bring together the probe and labeled sequences.
In an effort to improve transduction of the hybridization signal, an electrode surface may also be modified with a polymer layer that confers desirable properties, such as electrical conductivity, amenability to probe immobilization or protection of the electrode from nonspecific analyte adsorption. Heller and colleagues11 have reported an enzyme-amplified DNA sensing technique involving the electropolymerization of a polycationic redox polymer. Target DNA is captured at the electrode surface and subsequently hybridized to a
reporter strand modified with HRP. Biocatalyzed production of insoluble products has been used by
Willner and colleagues to sense DNA hybridization electrochemically at modified electrodes. Target DNA is captured at a
probe-modified gold electrode, where a redox-active DNA intercalator electrocatalytically generates peroxide, which, in turn, is oxidized by horseradish peroxidase (HRP). The product precipitates onto the electrode, providing the basis for DNA detection.
1.3.1.6 DNA-mediated charge transport electrochemistry
In an alternative approach to chemical labeling schemes, redox-active reporter molecules that intrinsically associate with the double helix noncovalently have been successfully used for electrochemically based DNA analysis. In these analyses, rather than serving as a reactant, the DNA is the mediator. These assays can provide high sensitivity and simplicity.
1.3.2 Optical detection
Generally, to use optical techniques as hybridization detection methods, it is necessary to label the oligonucleotide with an indicator dye, a fluorophore or an enzyme. Today, most used optical technique is fluorescence detection, even if it does not allows having easy to use and portable systems.
Technique Label Instrumentation Advantages Disadvantages Fluorescence Fluorophore Intercalating dyes Molecular beacons PNA Laser source Scanner Microscopes PMT Fiber optic CCD
High sensitivity and
accuracy Expensive instrumentation Not transportable system PCR needed Chemi-luminescence CL/BL substrates Ruthenium Enzymes Contact imaging systems: Photodiodes.. Excitation ≠ output signal Low QE
SPR Not needed Laser/Led Lenses CCD Label free Real time measurement Complex and costly systems Colorimetry Enzymes Gold nanoparticles Light source Microscopes, cooled CCD…
High sensitivity Expensive instrumentation
1.3.2.1 Fluorescence
Fluorescence-based indicators are employed in many nucleic acid detection methods, including cell biology oriented techniques, such as fluorescent in situ hybridization (FISH) techniques, as well as advanced detection methods, like fiber optic-based biosensors and nucleic acid microarrays. A variety of fluorescent detection schemes can be implemented for signal generation using direct fluorescence measurements through optical fibers and wave guides or by using evanescent wave methods.
Standard fluorescence techniques (Figure 8) uses lasers as excitation sources to obtain luminescence (LIF, Laser Induced Fluorescence). This reason prevents fluorescence to be a technique adapt for realizing devices compact, cheap, portable and easy to use.
Signals from fluorescently-labeled DNA molecules can be detected using fluorescence detection instrumentation, such as microscopy-coupled charge-microscopy-coupled device (CCD) cameras, PMT detectors, photosensors and confocal microscopes. Cova et al12 developed miniaturized and ultra sensitive photosensors for LIF detection (SPAD’s).
In most cases, nucleic acid amplification methods are employed before the detection assay is applied. Fluorescent label incorporation into the target can be combined with these amplification techniques.
Fluorescence is an optical technique with a high sensitivity because of the low background noise. Fluorophores, such as acridine orange (AO) and fluorescein-isothiocyanate (FITC), are attached to the target oligonucleotide, allowing detection of individual oligonucleotide hybridization. Fiber-optic sensors, based on fluorescence excitation and detection in the evanescent field of a quartz fiber, coupled to fluorescence microscopes and/or photomultipliers, detect the hybridization of oligonucleotides in real time. The complementary strand can be labeled with a fluorophore that, in the case of biorecognition, increases the emission signal, or the double helix can be recognized by an intercalating dye, such as ethidium bromide (EB), cyanine dimer YOYO or PicoGreen13.
Fluorescence techniques also use molecular beacons, scorpions and light-up probes. Molecular beacons are hairpin-forming probes with a fluorescent moiety at one end and a quenching moiety at the other. When they are not hybridized with the target, the hairpin or stem-and-loop structure maintains the termini at quenching distance. In the
presence of the target the hairpin opens because the loop portion of the molecule
is complementary to the target, the two ends are separated, resulting in a fluorescent signal (Figure 9).
Figure 9 Molecular beacons
Molecular beacons were recently immobilized onto solid supports in order to apply their advantages (mainly the possibility of label-free, real-time detection) to the DNA array format.
Scorpions and light-up probes are also used in DNA fluorescence detection in solution. Scorpions are similar to molecular beacons, but their structure promotes a unimolecular probing mechanism, instead of the common bimolecular mechanism. This probe is linked to the primer and hybridizes to its target only when the target site has been incorporated into the same oligonucleotide strand by PCR. The unimolecular mechanism makes scorpions faster and more efficient
than molecular beacons. They are also selective enough to detect single-base mutations. A light-up probe is a PNA to which a dye is tethered. Upon probe hybridization, the dye binds to the target DNA, enhancing the fluorescence signal.
1.3.2.2 Chemiluminescence
Chemiluminescence is the generation of electromagnetic radiation as light by the release of energy from a chemical reaction. Chemiluminescent reactions can be grouped into three types:
• Chemical reactions using synthetic compounds and usually involving a highly oxidized species such as peroxide are commonly termed chemiluminescent reactions.
• Light emitting reactions arising from a living organism, such as the firefly or jellyfish, are commonly termed bioluminescent reactions. • Light emitting reactions which take place by the use of electrical current are designated electrochemiluminescent reactions.
Chemiluminescent and bioluminescent reactions usually involve the cleavage or fragmentation of the O-O bond of an organic peroxide compound. Peroxides, especially cyclic peroxides, are prevalent in light emitting reactions because the relatively weak peroxide bond is easily cleaved and the resulting molecular reorganization liberates a large amount of energy.
The general scheme of a chemiluminescent reaction is illustrated in Figure 10.
Figure 10 Chemiluminescent reaction
Chemiluminescence assay techniques are divided into two general categories14. The first is direct target detection in which the photon emitting species physically interacts with the target of interest at a predetermined location. An example of this approach is luminescence-based immunoassays, which usually involve probing a protein of interest with a primary antibody that reacts with a secondary antibody. Light is produced when the enzyme bound to the secondary antibody acts upon a luminescent probe. The second category is indirect or linked detection in which the luminescent species indirectly measures the targeted characteristic, usually through an intermediate chemical process.
While multiplexing is feasible in direct target detection, indirect detection requires confinement of the photon generation process as well as physical barriers for the independent reactions. This physical isolation complicates the integration of indirect detection methods to miniaturized systems, since high density mechanical barriers (e.g.
micro-wells) as well as micro-scale solution delivery systems would be required. Since indirect detection is the more general of the two categories, it is the focus of the following analysis.
The time-dependent light generation from a typical luminescence process is a function of the underlying chemical reaction kinetics. The rate of a reaction, in general, is the speed at which reactants are converted into products. If enzyme species E (the catalyst) converts the substrate molecule S into product P, the stoichiometric formula is given by
S + E ←⎯ →Kf ,⎯Kr E + P,
Equation 1
where kf and kr are the association and disassociation rate constants. In (Equation 1) the reaction rate is defined by
Rate =d[P]/dt = -d[S]/dt = kf [S][E] - kr[E][P], Equation 2
where [E], [S], and [P] are the concentrations of the enzyme, substrate and product in the medium, respectively. Now if we suppose that the above process is a luminescence enzymatic reaction with quantum yield α, then the photon generation rate I in volume V of the reaction medium (A is Avogadro’s number) would be:
I = (aVA)d[P]/dt = (aVA)[E](kf [S] - kr[P]).
The total number of photons generated by this luminescence process
Nph (T), in the time interval T, would be: Nph(T) = (aVA)[E]
∫
T
(kf [S] - kr[P])dt.
Equation 4
In luminescence assays the experiment is typically set up in such a way that the luminescence probe (e.g. a light generating enzyme) either reports the quantity of a substrate molecule (e.g. ATP) or the molecule to which it binds (e.g. luciferase-based labels in immunoassays). The photon generation rate from the luminescence reaction, which is a function of the target concentration, is then measured and correlated to the target concentration.
1.3.2.2.1 Substrate detection kinetics
In the first group of luminescence assays, the rate at which photons are generated represents the substrate concentration given by (Equation 3). As the substrate is consumed by the catalyst, the light intensity decreases and eventually approaches zero.
If we assume that the disassociation rate is insignificant (i.e. negligible inhibition), the light intensity with initial substrate concentration [S0] becomes:
I(t) = (aVA)d[P(t)]/dt = (aVA)kf [E][S0]
e
−Kf[ E]t .Equation 5
The total amount of photons from time t = 0, the start of the process, to
t = T is:
Nph(T) = (aVA)[S0](1 -
e
−Kf[ E]t )Equation 6
.
The photon intensity in (Equation 6) is proportional to the target concentration, but the light intensity decays exponentially with a time constant, which is a function of the catalyst concentration and turnover rate kf .
1.3.2.2.2 Catalyst detection kinetics
The second approach in luminescence assays is to link the target molecule quantity to a luminescence catalyst. In this approach, excess substrate is used, making sure that its consumption does not affect the reaction kinetics. If the saturation concentration for the substrate is [Smax] and the target concentration is equal to the catalyst [E], the light intensity becomes:
I(t) = (aVA)d[P(t)]/dt = (aVA)kf [Smax][E].
Equation 7
Since the light intensity based on (Equation 7) is time independent and proportional to the target (or the catalyst) concentration, the total number of photons generated from this process is a function of the integration time:
Nph = (aVA)kf [Smax][E]T.
In such assays, the number of target molecules can be very small resulting in a low but steady light. Long integration times, however, can be used to collect a significant number of photons.
Some CMOS chips have been fabricated for revealing DNA hybridization through chemiluminescence detection (Lu et al.15, Simpson et al.16).
Mallard et al.17 used a pre-fabricated CMOS chip (for camera use) to detect bioluminescence.
1.3.2.3 ECL
Electrogenerated chemiluminescence (ECL) is a highly sensitive technique that combines both optics and electrochemistry, as a chemiluminescence reaction is initiated by an electrical stimulus generated from the label of the complementary strand, which is a ruthenium chelate, tris(2,20-bpy)ruthenium (II) (TBR).
Figure 11 Ruthenium ECL cell
This technology benefits from simplicity, short analysis times, low limits of detection (LODs), wide dynamic range for label
quantification, extremely stable labels and portability of the system (it does not require an excitation external to the chip).
Moreover, the signal resulting from electrical excitation is extremely “clean”, because the excitation source and the produced signal are of different nature- differently from what happens in fluorescence, where both excitation and signal are optical. Mainly a homogeneous technique, it has mainly been used to detect and quantify PCR products .
Fiaccabrino et al.18 proposed an ECL cell that combines both the electrode transducer and the photodetector in a single 5*6 mm² silicon chip (Figure 11).
1.3.2.4 SPR
Surface plasmon resonance (SPR) is much more sensitive; moreover, it does not require any label and allows real-time measurement, as the refractive index of the sensing layer changes depending on the amount of DNA in proximity with the surface19. The SPR system is particularly useful for the determination of binding and dissociation kinetics, and it has been demonstrated to be sensitive enough to detect the presence of mismatches.
SPR can also be combined with electrochemical techniques; e.g.,
Heaton et al.* used the electric field to control the electrostatic forces on a surface-bound oligonucleotide monolayer. They used this field in a reversible manner to increase or to decrease the rate of oligonucleotide hybridization.
Figure 12 SPR technique
They also demonstrated that a repulsive potential preferentially denatures mismatched DNA hybrids within a few minutes, while leaving the fully complementary hybrids largely intact. This sequence selectivity imparted an extremely high stringency for mutation detection based purely on electrostatic effects. However, unlike Clinical Micro Sensors, Heaton et al. used the strategy for DNA sensors and not DNA arrays. SPR imaging technology, based on the same SPR principle with the exception that the metal surface is imaged on a CCD camera via an imaging lens, can be applied to array formats.
1.3.2.5 Colorimetry
In colorimetric DNA sensors, an enzyme is directly linked to the oligonucleotide or to antibodies, which, in an affinity reaction, interact with the antigen-labeled oligonucleotides. In these assays, a washing step is necessary to remove the non-hybridized oligonucleotides or the antibody-enzyme in excess, respectively. The enzyme converts its
substrate into a colored product, giving an absorbance change directly proportional to the hybridization efficiency. It is also possible to obviate the use of enzymes by taking advantage of the absorbance of some intercalators that recognize dsDNA .
1.4 Proposed solutions
As said before, the reading of DNA chips is usually based on fluorescence labeling of hybridized target molecules. Combined with the use of confocal fluorescence scanners, this approach shows very high performances in terms of accuracy and sensitivity, with common detection limits down to 0.1–1 molecule/µm² on high-density arrays (Epstein et al., 2002). However, fluorescence readers remain costly and not transportable. This prevents the use of DNA chips, both for decentralized testing (point of care, air or water control, food testing, .
. .), and as a routine tool in the field of diagnostics, where this
technique has to replace existing, low cost tests.
That’s in this direction, in an effort to reduce the size and cost of the reader, that our solutions take place.
Other detection means- some of these have just been described in previous paragraphs- have been proposed with these goals; in these, hybridization of nucleic acids to the DNA chip can be directly related to an electric signal. Miniaturized electrochemical detection systems rely on microfabricated electrodes monitoring redox reactions generated in the presence of hybridized targets or their labels.
Applications have been reported for direct or indirect oxidation or reduction of nucleic acids, electrochemically active reporter molecules or labels, and redox reactions of molecules generated via enzyme labels (Drummond et al., 200320). Electromechanical systems, based on the use of quartz crystal microbalances (QCM), monitor the mass and viscosity changes that occur upon hybridization of targets on probes grafted onto the surface of the crystal.
Although some of these systems monitor hybridization with sensitivities compatible with molecular diagnostics (down to pM target concentrations for a 60 min hybridization, their integration in the form of multiplexed miniaturized detection systems remains challenging. Therefore, already multiplexed arrays of detectors to monitor hybridization on DNA chips with an electrical detection method are inherently most promising.
Contact imaging of DNA chips with photodetector arrays has been proposed to be one of such promising systems. In 1994, teams of the Genosensor Consortium (Genometrix Inc.) demonstrated the feasibility of such a system using a CCD chip combined to radioactive labeling of target molecules (Eggers et al., 1994; Lamture et al., 1994)21. Hybridization probes were grafted either directly onto the SiO2 surface of the CCD, or on a covers lip mounted onto the CCD.
However, such a system was far from being compatible with routine or decentralized diagnostics applications: (1) the use of radioactive labeling is now restricted to research applications, (2) the spot density being limited by spotting techniques, the achievable density was not
investigated, and (3) the cost of such a system would have been prohibitive for a disposable device.
Then, our solutions, presented in the next paragraphs, go in the direction to overcome these limitations.
1.4.1 Chemiluminescence detection
First solution proposed is to reveal DNA hybridization through chemiluminescence detection. Spots of DNA hybridization probes will be grafted directly onto the surface of a photodiodes array fabricated with ST BCD6 technological process. Hybridised targets will be labeled with enzymes that catalyze a chemiluminescence reaction. Light generated on the hybridization spots will be measured by the underlying pixels.
Figure 13 Schematic of the DNA chip
Our choice for chemiluminescence derives from two main reasons; first, chemiluminescence allows having an on single chip solution. In fact, as described in previous paragraphs, it does not require external
instrumentation to start the reaction. Second reason is chemiluminescent assays detection sensitivity. In fact, unlike colorimetric or fluorescent measurements, assay samples typically contribute little or no native background chemiluminescence.
Then, with BCD6 technological process it will be easy to integrate photosensitive region, conditioning circuits and digital signal processing functions on the same chip, potentially providing low cost, low power integrated biological testing platforms.
However, in a highly miniaturized biological testing system the photogenerated signal can be very weak and it is not clear that such a system would have high enough sensitivity and low enough noise to reliably perform the detection. And, in any case, detecting lower light levels means using less reagents, potentially yielding significant cost savings. For these reasons, our work will focus on modeling and design of the single photosensor, trying to obtain the device structure with highest sensitivity, or-better- with lowest Noise Equivalent Power.
1.4.2 Gold plus Silver precipitation photodetection
An idea to eliminate photodetectors noise could be to use chopper technique in the readout electronics. But in this case also luminous signal has to be choppered; unfortunately, light signals produced by chemiluminescence reactions cannot be modified, and their intensity/profile usually consists of an initial rise period up to a prolonged emission at a plateau level.
Then, this second solution is thought to use chopper technique to eliminate photodetectors noise.
Suppose to have a photosensors array, and that upon each sensor DNA probe sequences are immobilized.
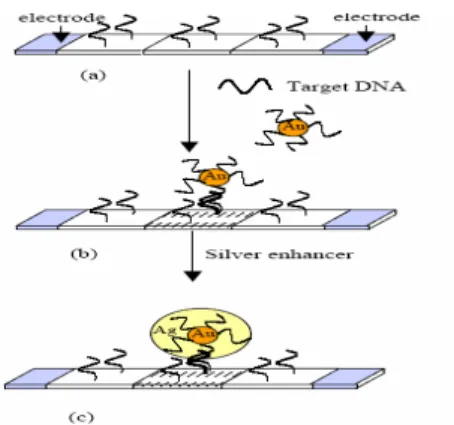
The idea is to label target DNA with gold nanoparticles plus silver enhancement so that where hybridization event occurs there will be the precipitation of gold and silver.
Figure 14 Gold plus Silver precipitation detection
So, illuminating the photosensor array, we obtain the negation of the information, that is: we will reveal light where hybridization event didn’t occur and dark where event occurred.
Now, if light illuminating the array is on-off type, chopper technique could be used.
2 PN Junction Photodiodes
2.1 Introduction
Photodetectors are semiconductor devices that can detect optical signals through electronic processes. A general photodetector has basically three processes: (1) carrier generation by incident light, (2) carrier transport and/or multiplication by current-gain mechanism and (3) interaction of current with the external circuit to provide the output signal.
Different devices are used as photodetectors: photodiodes, APD (Avalanche Photo Detectors), Photoconductors and Phototransistor (both FET and BJT). Moreover, photodiodes family includes the pn junction diode, p-i-n diode, metal-semiconductor diode and heterojunction diode.
2.2 Absorption Process
In the absorption process, a photon of a known energy excites an electron from a lower a to higher energy state (Figure 15). The possible
transitions an electron can make are different: band to band, between subbands, between impurities and bands, transition by free carriers within a band, and also the resonances due to vibrational states of the lattice and of the impurities22.
Figure 15 Photon absorption
Absorption is expressed in terms of a coefficient α(hν) which is defined as the relative rate of decrease in light intensity L(hν) along its propagation path:
( )
[
( )
x
]
h
L
h
L
∂
∂
⋅
=
ν
ν
α
1
Equation 9The fundamental absorption refers to band-to-band transitions, for example the excitation of an electron from valence band to conduction band, and the absorption coefficient α(hν) for a given photon energy hν is proportional to the probability Pif for the transition from initial state
to the final state and to the density of electrons in the initial state, ni, and also to the density of available (empty) final states, nf; this process
must be summed for all possible transitions between states separated by an energy difference equal to hν:
( )
h
ν
=
A
∑
Pif
⋅
ni
⋅
nf
α
Equation 10
So, it is evident that absorption is a material property, and that it also depends strongly from impurities, defects or particular conditions (such as presence of electric fields) which could be present in a certain material.
Because the momentum of a photon, h/λ, (λ wavelength of light, thousands of angstroms), is very small compared to the crystal momentum h/a (a lattice constant, a few angstroms), the photon-absorption process should conserve the momentum of the electron. Consider the case of semiconductors. As known, semiconductors have basically two band-structure types: direct and indirect band gap (Figure 16).
In direct band gap semiconductors such as ІІІ-V semiconductors (GaAs, InAs, InP...) the photon absorption process could be a direct process, that requires no assistance. The photon is absorbed and the electron is excited directly from the valence band to the conduction band without a change in his k-vector inasmuch as the photon momentum is very small. But when a transition requires a change in both energy and momentum, as for indirect gap semiconductors (silicon), a double, or two steps, process is required because the photon cannot provide a change in momentum. Momentum is conserved via a phonon interaction as illustrated in Figure 16. A phonon is a quantum of lattice vibration. Although a broad spectrum of phonons is available, only those with the required momentum change are usable. These are usually the longitudinal- and the transverse-acoustic phonons, and each of these has a characteristic energy Ep. Hence to complete the transition Ei to Ef, a phonon is either emitted or absorbed. In indirect transitions, all the occupied states of the valence band can connect to all the empty states of the conduction band. Then, the absorption coefficient is proportional to the product of the densities of initial states and final states integrated over all possible combinations of states separated by hν ± Ep; α is also proportional to the probability of
interacting with phonons.
If the semiconductor is heavily doped, the Fermi level is inside the band (the conduction band in an n-type semiconductor) by a quantity ξ (Figure 17).
Figure 17 Absorption in heavily doped semiconductors
Since the states below ξ are already filled, fundamental transitions to states below Eg+ξ are forbidden; hence the absorption edge should shift to higher energies by about ξ; this shift of the absorption edge due to band filling is called Burstein-Moss shift. But it’s just for this reason that in heavily doped indirect-gap semiconductors it is possible to conserve momentum by a scattering process such as electron-electron scattering or by impurity scattering, and not necessarily through a phonon interaction. In short, as it could be noticed from Figure 17, absorption process in this case does not involve a big momentum change, allowing transitions being almost direct.
This effect is important for our goals, as we will see subsequently, because it could causes absorption being greater (α increases and so
δ=1/ α= light penetration depth decreases) in doped semiconductors;
in fact now also scattering events with other electrons or with defects can give enough momentum to transit, and this leads to a greater
probability of transition; moreover, heavily doped semiconductor means that a lot of defects will be present in the material, increasing then the probability of scattering with defects and, in conclusion, again the probability of transition.
In Figure 18 is shown absorption coefficient for undoped silicon.
Figure 18 Absorption coefficient in undoped silicon
Absorption coefficient shift in doped silicon sample has been investigated by Vina et Cardona23, who reported dielectric constant shift for different doped samples; the absorption coefficient is related to dielectric constant: let the radiation be a plane wave of frequency ν propagating in x-direction with a velocity V:
( )
[
]
{
i
t
−
x
V
}
Ε
=
Ε
0exp
2
πν
Equation 11The velocity of propagation through a semiconductor having a complex index of refraction:
ik
n
n
c=
−
Equation 12
is related to the velocity propagation in vacuum, c, by:
c
n
c
V
=
Equation 13 Therefore,c
ik
c
n
V
=
−
1
Equation 14Substituting the latter in Equation 11 gives:
)
/
2
exp(
)
/
2
exp(
)
2
exp(
0i
πν
t
−
i
π
xn
c
−
πν
kx
c
Ε
=
Ε
Equation 15Last term in Equation 15 is a damping factor. The fraction of the incident power available after propagating a distance x, through a material with a conductivity σ is:
)
/
4
exp(
)
0
(
)
(
)
0
(
)
(
2 2c
kx
x
P
x
P
πν
σ
σ
−
=
Ε
Ε
=
Equation 16And then, in terms of absorption coefficient α:
c
k
πν
α
=
4
Equation 17
Where k, the imaginary part of nc, is called “extinction coefficient”.
2.3 PN Photodiodes Principles
A simplified scheme of a pn photodiode is shown in Figure 19. Consider a pn junction with a very narrow and heavily doped p-region through which there is the illumination. The photodiode is normally reverse biased and the depletion region W (or SCL, space charge layer) will extend almost entirely into the n-side and, at most, in few microns. The applied reverse bias Vr drops across the highly resistive depletion layer width W and makes the voltage across W equal to Vo + Vr where Vo is
the built-in voltage. The regions outside the depletion layer are the neutral regions in which there are majority carriers.
When a photon with energy greater than the bandgap Eg is incident, it becomes absorbed to photogenerate a free EHP (Electron-Hole-Pair). If photogeneration takes place in depletion region, then electric field present in this region separates the EHP and drift them in opposite directions until they reach the neutral regions. So, drifting carriers generate a current, called Photocurrent Iph, in the external circuit that provides the electric signal. The photocurrent lasts for the duration it takes for the electron and hole to cross the depletion layer (W) and reach the neutral regions.
When the drifting hole reaches the neutral p+-region it recombines with an electron entering the p+-side from the negative electrode, that is from the battery. Similarly, when the drifting electron reaches the neutral n-side, an electron leaves the n-side into the electrode (battery).
The photocurrent depends on the number of EHP photogenerated and the drift velocities of the carriers while they are transiting the depletion layer. Since the field is not uniform and the absorption of photons occurs over a distance that depends on the wavelength, the time dependence of the photocurrent cannot be determined in a simple fashion.
Exactly, not only carriers photogenerated in depletion layer contribute to photocurrent, but also carriers photogenerated at a diffusion-length from depletion layer edges. These carriers in fact are holes in n-side and electrons in p-side, so after being generated they’ll start diffusing. Then, if they have been generated at a distance from W edge inferior to their diffusion length, they will be able to arrive to the depletion layer, where they could be collected and separated from the electric field.
In the next paragraphs we will consider the general characteristics and parameters of merit of a photodiode: its quantum efficiency, response speed and device noise.
2.4 Quantum Efficiency and Responsivity
Not all the incident photons are absorbed to create free electron-hole pairs that can be collected and give rise to a photocurrent. The efficiency of the conversion process of received photons to free EHP is measured by the quantum efficiency (QE) η of the detector defined as:
photons incident of Number collected and generated EHP free of Number =
η
The measured photocurrent Iph in the external circuit is due to the flow of electrons per second to the terminals of the photodiode. Number of electrons collected per second is Iph/q. If Popt is the incident optical power then the number of arriving photons per second is Popt/hν. Then QE can also be defined by:
⎟ ⎠ ⎞ ⎜ ⎝ ⎛ ⎟ ⎠ ⎞ ⎜ ⎝ ⎛ = ⇒
ν
η
h Popt q Iph Equation 18More specifically it is known as external quantum efficiency (internal quantum efficiency is number of free electron pairs generated for absorbed photon). It has four components:
1. Efficiency of light transmission to the detector (fraction of incident photons that reach the Si surface);
2. Efficiency of light absorption by the detector (fraction of photons reaching the Si surface that produce electron-hole pairs);
3. Quantum yield (number of electron-hole pairs produced by each absorbed photon);
4. Charge collection efficiency of the photodetector (fraction of optically generated minority carriers that cross the pn junction before recombining).
The device QE is therefore always less than unity. It depends on the structure of the device and on the absorption coefficient α of the semiconductor at the wavelength of interest. Absorption in fact, as we have seen in previous paragraph, is a strong function of wavelength and so the range in which appreciable photocurrent can be generated is limited. The long wavelength cut-off λc is established by the energy gap of the semiconductor, so about 1.1µm for Si. For wavelengths longer than λc, the values of α are too small to give appreciable absorption. The short wavelength cutoff of the photoresponse comes about because the values of α for short wavelengths are very large (>105 cm-1) and the radiation is absorbed very near the surface where the recombination time is short. The photocarriers thus can recombine before they are collected in the p-n junction. We will see that this is an important factor to considerate in our design, in which wavelength that has to be detected is very short, around 425 nm (blue/violet).
Then, QE can be increased by reducing the reflections at the semiconductor surface, increasing absorption within the depletion layer and preventing the recombination or trapping of carriers before they are collected.
Refer to Figure 19, we consider now a modeling of internal QE (...for
absorbed photon) for a p+n photodiode. We call φ the flux of incident photons, and because we are interested in internal quantum efficiency we suppose that each absorbed photon produces a free EHP; then, the generation of carriers is:
φ
α
⋅
=
G
Equation 19 with( )
λ
,
x
=
φ
0exp(
−
α
⋅
x
)
φ
Equation 20Then, carriers that will be collected are those generated inside the depletion region or within a minority diffusion length to space charge region edge:
dx
x
p n w n p w L W L L W L i∫
+ + − −−
⋅
=
α
exp(
α
)
η
Equation 21(
)
[
w p n]
[
(
w n p)
]
i=
−
L
−
W
−
L
−
−
L
+
W
+
L
⇒
η
exp
α
exp
α
Equation 22This result can be divided into the three contributes, which are drift current, hole diffusion current and electron diffusion current:
[
w{
p n p]
[
Lw Wn{
Lw Wn Lp]
Dp W L W L Dn drift i + + + − −+
+
=
... ...η
η
η
η
Equation 23This model allows evaluating devices performances in terms of quantum efficiency, and we will use it during design step.
A related figure of merit is the responsivity, which characterizes photodiodes performances in terms of the photocurrent generated per incident optical power at a given wavelength:
0
P
I
ph=
ℜ
Equation 24From the definition of QE, it is clear that:
hc
q
h
q
η
λ
ν
η
⋅
=
⋅
=
ℜ
Equation 25From Equation 25 it is clear that Responsivity depends on the wavelength, and in fact it is also called spectral responsivity or radiant sensitivity. Ideally with a QE of 100% (η=1) responsivity should increase with λ. In practice, QE limits the responsivity to lie below the ideal photodiode line with upper and lower detectable wavelength limits.
2.5 Dark current
The analysis of pn junction currents starts from the resolution of the continuity equation (that for electrons is):
(
n n)
nG
R
x
J
q
t
n
+
−
∂
∂
=
∂
∂
1
Equation 26The analysis is based on events in the quasi-neutral region, and the space charge region is treated solely as a barrier to the diffusion of majority carriers, playing a role only in establishing minority carrier densities at its boundaries. This is a reasonable first order description of events, and the equations derived from it are called the ideal-diode equations, which lead to the known current density expression:
⎟⎟
⎠
⎞
⎜⎜
⎝
⎛
−
=
VT1
qV se
J
J
Equation 27Where Js is the inverse saturation current density, due to minoritary carriers diffusion under low reverse bias, expressed by (for short base diode, that is a diode with p and n side lengths Wb, We << diffusion length Ln, Lp):