Regional and Urban Policy
THE URBAN-RURAL
DIVIDE IN ANTI-EU
VOTE:
Social, demographic and economic
factors affecting the vote for
parties opposed to European
integration
Laura de Dominicis, Lewis Dijkstra
and Nicola Pontarollo
WORKING PAPER
A series of short papers on regional
research and indicators produced
by the Directorate-General for
Regional and Urban Policy
Disclaimer
The views expressed are purely those of the authors and may not in any circumstances be regarded as stating any official position of the European Commission.
More information on the European Union is available on the Internet (http://www.europa.eu). Luxembourg: Publications Office of the European Union, 2020
© Cover image: iStock/Meinzahn © European Union, 2020
Reproduction is authorised provided the source is acknowledged.
ACKNOWLEDGMENTS
The authors wish to thank Professor Andrés Rodríguez-Pose for comments that greatly improved this working paper, and Hugo Poelman for advice on electoral and regional data. Nicola Pontarollo wish to thank colleagues working in the JRC Team on Fairness (Unit I.1) for helpful discussions, and in particular Beatrice d’Hombres for her enthusiasm and support.
THE URBAN-RURAL
DIVIDE IN ANTI-EU
VOTE:
Social, demographic and economic
factors affecting the vote for
parties opposed to European
integration
Laura de Dominicis
a, Lewis Dijkstra
band Nicola Pontarollo
ca Economic Analyst, European Commission, Directorate-General for Regional and Urban Policy, Brussels (Belgium). Email: [email protected] b Head of the Economic Analysis Sector, European Commission, Directorate-General for Regional and Urban Policy, Brussels (Belgium). Email: lewis.dijkstra@
ec.europa.eu
ABSTRACT
In recent years, protest voting, voting for populist parties and, specifically for Europe, votes for parties opposed to European integration, have increased substantially. This has focussed the attention of researchers and policy makers on the causes behind this trend. Most of the existing research looked at voters’ characteristics, mainly values, education and age, or economic insecurity, such as rising unemployment or a declining economy more in general. This paper focuses instead on the urban-rural divide in anti-EU sentiment, and tries to explain why cities – and urban areas in general - in Europe tend to vote less for Eurosceptic parties. Using electoral data for national elections at the electoral district level for the years 2013-2018 and political parties’ orientation as assessed by the Chapel Hill Expert Survey, we find robust statistical evidence of a lower anti-EU vote in cities, towns and suburbs than in rural areas. We also find that drivers of voting for anti-EU parties differ significantly between urban and rural areas in the EU and UK, despite some similarities. We show that three factors are associated to a higher anti-EU vote in all areas: growth in unemployment, a low turnout and a higher share of people born outside the EU. A sluggish economy is associated to a higher anti-EU sentiment in rural areas, but not in cities and towns and suburbs. Higher shares of university graduates, people aged 20-64, and of people born in a different EU country reduce anti-EU voting in rural areas and towns and suburbs, but have no impact in cities.
TABLE OF CONTENTS
Introduction 5
Anti-EU voting by degree of urbanization 6
Drivers of anti-EU voting: Methodology and data 8
Results 10
Conclusions 15 References 16
Annex A - Relative importance of the explanatory variables 18
Annex B: Descriptive statistics 19
INTRODUCTION
In recent years, anti-EU voting has emerged as an electoral force in Europe. Lack of trust in the European Union (EU) passed from around 25 % in the mid-2000s, to around 45 % in the late 2010s (source: Eurobarometer Survey; see also Dijkstra et al., 2020). This growing lack of trust in the EU can also be seen in the growing votes for parties that were against EU integration. Between 2013 and 2018, around 13 % of voters in EU national elections cast their votes for parties strongly opposed or opposed to European integration. This figures increased to around 27 % if we consider also parties moderately opposed to European integration (Dijkstra et al., 2020). Against this background, a large body of research has rapidly emerged in Europe trying to explain this phenomenon, whether analysing country specific voting, as in the case of the Brexit referendum to leave the EU (Alabrese et al., 2019; Abreu and Öner, 2020) or looking at the EU as whole (Lechler, 2019; Dijkstra et al., 2020). In particular, we can distinguish between two approaches. A first approach highlights that individual characteristics, such as income, education and age, or cultural factors such as political orientation and tolerance towards immigrants, drive anti-EU sentiment (Schoene, 2019; Schraff, 2019). A more recent strand of the literature, initiated by Dijkstra et al. (2020), extends previous research by including geography as an additional driver of anti-EU sentiment, originating what is well- known as the Geography of EU discontent.
In the present work, we go one step further by trying to explain the causes behind a potential urban-rural divide in anti-EU voting in Europe, a phenomena widely studied in the context of rising populism in the United States (see for example Rodden, 2019), but which received little attention so far in Europe.1 Recent studies, mainly in the field of political science, and often based on country-specific analyses, have suggested that rural, suburban and peripheral areas are more likely to be influenced by populist parties (Scoones et al. 2018; Mamonova and Franquesa, 2020). Particularly after the great crisis, the socio-economic urban-rural divide in the EU became a focus of debate. The 2019 Eurostat Statistical Yearbook (European Commission, 2019), for instance, reports that rural areas, as well as towns and suburbs, if compared to cities, show a considerable digital skills divide. An urban-rural split is observable also in population trends, with the majority of urban regions reporting population growth, and many peripheral, rural and post-industrial regions a decline. A gap is noticeable also on health perception, with a higher proportion of people living in cities perceiving their own health as good or very good. Finally, in at least half of EU Member States self-employed persons in rural areas are not satisfied with their job, possibly because they are self-employed due to lack of other options. For the case of the United States, research has focussed on the concept of “great inversion”, referring to once prosperous rural regions and middle-to-small metropolitan areas that suffered a (relative) economic and/or employment decline (see Moretti 2012; Rodden, 2019). It has also been linked to a “populist explosion” (Judis, 2016), with small towns in rural and peripheral regions becoming reservoirs of populist resentment (Cramer, 2016). For Europe, Dijkstra et al. (2020) show that rural areas and small towns are more Eurosceptic than bigger cities, while Gordon (2018) identifies a greater support for populist parties in non-urban areas (countryside or village). On the other hand, the results of Schoene (2019) support the position of Essletzbichler et al. (2018), who posit that the geographies of the electoral rise of anti-system parties are more complex than the rural-urban differences in populist vote shares.
In what follows, we try to answer to three questions: [i] do urban areas in the EU and UK vote more or less than rural areas for parties that are opposed or strongly opposed to European integration? [ii] what are the territorial roots of anti-EU voting? and [iii] do they differ between urban and rural areas?
The paper is organised as follows. Section 1 shows that the vote share of anti-EU changes according to the place where people live, and tend to increase when we move from cities, to towns and suburbs, to rural areas. Section 2 explains the methodology and data used to analyses the drivers of anti-EU votes. Section 3 presents the econometric specification and describes the results. Section 4 concludes.
1. See for instance Schoene (2019) for the EU, and Marcinwiewicz (2018) for Poland.
1.
ANTI-EU VOTING
BY DEGREE OF
URBANIZATION
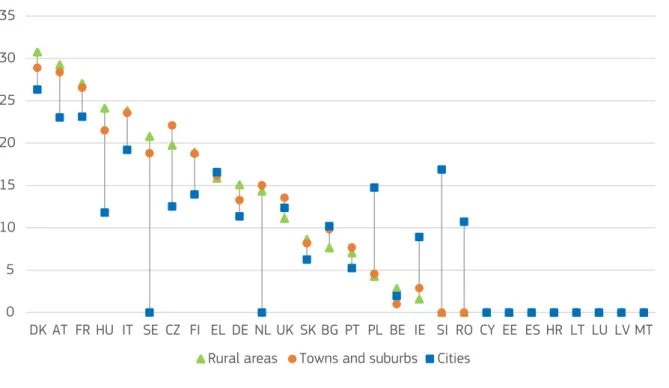
Firstly, we look at whether in Europe we can talk of an urban-rural divide when it comes to voting preferences for parties that are opposed to European integration. To do so, we first classify all 63,231 electoral districts in the EU and the UK into three categories (Dijkstra and Poelman, 2014): i) cities or large urban areas (for a total of 2,172 electoral districts), ii) towns and suburbs (9,452 electoral districts), and iii) rural areas (51,607 electoral districts). 2 When referring to urban areas, we refer to
cities plus towns and suburbs. Voting data in our analyses cover all national elections that had taken place in the EU and UK between 2013 and 2018. Party positioning on European integration comes from the assessment made in 2014 and 2017 by the Chapel Hill Expert Survey. In the survey, political parties received a score between 1 (Strongly opposed) and 7 (Strongly in favour) according to their position with respect to European integration. Following Dijkstra et al. (2020), we consider as anti-EU vote the share of votes obtained by parties opposed and strongly opposed to European integration (i.e parties receiving a score below 2.5).
Figure 1 shows, for example, that votes for anti-EU parties in the EU and UK are consistently lower in cities, with the exception of few countries.
2. Cities or large urban areas if at least 50 % of the population lives in high-density clusters. Towns and suburbs if less than 50 % of the population lives in rural
grid cells and less than 50 % lives in high-density clusters. Rural areas, if more than 50 % of the population lives in rural grid cells. The classification considers as basic units of classification 1 km² grid cells. Rural grid cells are the grid cells outside urban clusters. Urban clusters are those clusters of contiguous grid cells of 1 km2 with a density of at least 300 inhabitants per km2 and a minimum population of 5,000. High-density cluster are contiguous grid cells of 1 km2
with a density of at least 1,500 inhabitants per km2 and a minimum population of 50,000.
When considering all electoral districts, without referring to the country where the elections have taken place, we observe that in cities, and in towns and suburbs, people tend to vote less for anti-EU parties than in rural areas. The median vote for parties opposed and strongly opposed to the EU decreases with the degree of urbanization of the electoral district. The median vote for Eurosceptic parties is 23.4 % in rural areas; it declines to 20.5 % in towns and suburbs, and further decreases to 15 % in cities (Figure 2).
We also check whether there are statistically significant differences between the mean values of anti-EU votes in the three types of areas, using an Analysis of variance (ANOVA) methodology. Our (null) hypothesis is that the average vote for Eurosceptic parties is equal in urban and rural areas, meaning that there is no relationship between the type of territory (whether it is urban or rural) and the propensity of voters to support Eurosceptic parties. The alternative hypothesis is that not all the means for the three area types are equal, and that there is a relationship between the type of area and the propensity to vote for Eurosceptic parties. Results in Table 1 confirm that the variation of the share of votes for parties opposed and strongly opposed to European integration among different areas is much larger than the variation within each type of territory. This finding corroborates our initial hypothesis of a significant relationship between votes for Eurosceptic parties and whether an electoral district can be identified as rural or urban.
0
5
10
15
20
25
30
35
DK AT FR HU IT SE CZ FI EL DE NL UK SK BG PT PL BE IE SI RO CY EE ES HR LT LU LV MT
Rural areas
Towns and suburbs
Cities
0 % 20 % 40 % 60 % 80 % 100 %
Rural Towns and suburbs Cities Full sample
Country fixed effects Regional economic variables
Regional socio-demographic variables Electoral variables
Electoral district characteristics
100 75 50 25 0 outliers median median median outliers outliers
Rural areas Towns and suburbs
Share of votes for anti-EU parties
Cities
FIGURE 1: Vote share of parties opposed or strongly opposed to EU-integration in national election, 2013-2018
FIGURE 2: Boxplot of the share of the vote for parties opposed or strongly opposed to European integration
(2013-2018) by degree of urbanisation
0
5
10
15
20
25
30
35
DK AT FR HU IT SE CZ FI EL DE NL UK SK BG PT PL BE IE SI RO CY EE ES HR LT LU LV MT
Rural areas
Towns and suburbs
Cities
0 % 20 % 40 % 60 % 80 % 100 %
Rural Towns and suburbs Cities Full sample
Country fixed effects Regional economic variables
Regional socio-demographic variables Electoral variables
Electoral district characteristics
100 75 50 25 0 outliers median median median outliers outliers
Rural areas Towns and suburbs
Share of votes for anti-EU parties
Cities
Degrees of freedom Sum of Squares Mean Squares F-test
Degree of Urbanisation 2 71,67 35,83 183***
Residuals 63,23 12,377,573 196
Note: *** p-value<0.01, ** p-value <0.05, p-value *<0.10.
Percentage points difference Lower Upper
Towns and suburbs areas vs. Rural areas -1.3 -1.7 -1.0***
Cities vs. Rural areas -5.5 -6.2 -4.7***
Cities vs. Towns and suburbs -4.1 -4.9 -3.4***
Note: *** p-value<0.01, ** p-value <0.05, p-value *<0.10.
TABLE 1: ANOVA for votes for parties opposing and strong opposing European integration and degree of
urbanisation
TABLE 2: Tukey test: votes for parties opposing and strong opposing European integration by Degree of Urbanisation
One limit of the previous analysis based on a standard ANOVA is that, however, it does not show which typologies of electoral districts are different from the others. To overcome this, a Tukey test is used (Table 2). The test performs multiple pairwise-comparisons between the means of the three groups and shows significant difference in Eurosceptic vote between each pair of type of areas. Results show that the vote for Eurosceptic parties is significantly higher in rural areas than in towns and
suburbs and cities, and that in towns and suburbs it is higher than in cities. In cities, the support for anti-EU parties is around 5.5 percentage points lower than in rural areas. In towns and suburbs, the support for anti-EU parties is around 1.3 percentage points lower than in rural areas. The difference between cities and towns and suburbs corresponds to 4.1 percentage points.
2.
DRIVERS OF
ANTI-EU VOTING:
METHODOLOGY AND
DATA
As a second step, we empirically investigate the drivers of anti-EU voting, with a focus on whether there are similarities or differences across cities, towns and suburbs, and rural areas. We correlate the share of votes for anti-EU parties, at the electoral district level, with a set of potential explanatory variables. We perform the analyses for the full sample, and by looking separately at cities, towns and suburbs and rural areas. Following Dijkstra et al. (2020), we estimate the following equation:
where AEVr,2013-2018 is the share of the vote for parties opposed and strongly opposed to European integration in national legislative election that took place between 2013 and 2018. The terms r and t denote constituency (i.e. electoral district) and time, respectively. The vector Xr,t contains a set of explanatory variables identified by the literature as potential drivers of populist vote. Finally, εr,t denotes the error term.
Due to data limitation, our explanatory variables on the right-hand side of equation (1) are observed at different levels of territorial aggregation (i.e. electoral districts, NUTS3 regions and for a few indicators NUTS2 regions3). We estimate our model
via Ordinary Least Square (OLS), and we cluster the standard errors at the NUTS3 level of territorial aggregation, to correct for the fact that variables are observed at different territorial scales.4 In order to capture country dynamics, we include
country specific effects, νc. In addition, a Chow test is performed to check whether the coefficients calculated for each type of area (namely, cities, towns and suburbs, and rural areas) are significantly different from the estimates for the full sample. Based on the existing empirical literature on anti-system and populist vote, we identify four groups of drivers of Euroscepticism: Regional economic variables, regional socio-demographic variables, electoral district characteristics and electoral variables.
Recent studies based either on microdata (Jennings et al., 2016; Ramiro, 2016) or data aggregated at electoral district or regional level (Algan et al., 2017; Nicoli, 2017; Gordon, 2018; Essletzbichler et al., 2018; Dijkstra et al. 2020, Lechler, 2019; Schraff, 2019; Guiso et al., 2018) show that economic and socio-demographic factors, such as age, education, unemployment and wealth drive anti-system and anti-EU voting. Therefore, we control for:
3 The nomenclature of territorial units for statistics (NUTS) is a classification for the EU and the UK providing a harmonised hierarchy of regions. The NUTS
clas-sification subdivides each Member State into regions at three different levels, covering NUTS 1, 2 and 3 from larger to smaller areas. For more details, see: https://ec.europa.eu/eurostat/web/nuts/background.
4. As Moulton (1986) shows, when the nesting of observations within geographical units is not considered, the unobserved characteristics that individuals share
within this unit are not accounted for, leading to an underestimation of the standard errors of the dependent variables, due to the within-group (intra-class) correlation across individual units.
REGIONAL ECONOMIC VARIABLES
Ý GDP per capita and GDP per capita growth. These two variables approximate the local economic conditions and the dynamics over time, respectively. The role of GDP per capita has been highlighted by Schraff (2017) who, combining European Social Survey data (ESS) with regional level data, finds that disadvantaged poor regions and middle-income regions show significantly higher probabilities of Eurosceptic voting, a result confirmed more recently by Dijkstra et al. (2020). In addition, wealth can also be associated to a higher propensity to cast votes for anti-EU parties, in richer countries or regions where voters, for instance, may believe they do not need the EU, as their national governments are able to provide them what they need (Dijkstra et al., 2020). Average GDP per capita and GDP per capita growth are calculated over the years 2002-2014 and are defined at NUTS3 territorial level (Source: Eurostat).
Ý Unemployment rate and change in unemployment rate. The inclusion of this variable finds justification on the fact that rising unemployment is one of the main factors behind recent populist votes in Europe (Emmenegger et al, 2015; Nicoli, 2017; Guiso et al., 2018 and 2020; Algan et al., 2019). Using data from the European Social Survey (ESS), Lechler (2019) finds that regional employment growth is a causal factor for forming attitudes towards the European Union and reduces voting for Eurosceptic parties. The two variables are calculated as the average over the period 2002-2014 and are defined at NUTS2 level of territorial aggregation (Source: Eurostat).
REGIONAL SOCIO-DEMOGRAPHIC VARIABLES
Ý Age structure is proxied by including the share of the population by age group 20-39, 40-64 and 65 and over in the total population, observed in 2017, and is defined at NUTS3 level. In the empirical literature on factors driving populist vote, age is often used as a control variable, but not often by looking at different age-groups of the population. In our case, similarly to Jennings et al. (2016), we aim at checking not only for the Euroscepticism of the different cohorts, but also for the differences according to the degree of urbanisation. To avoid multicollinearity issues, as there is very strong correlation between age groups, we include each one at the time. This serves also as a robustness check with respect to the other variables.
Ý Education consists in the share of adults (25-64) with a tertiary education, observed in 2017, at the NUTS2 level. Following the recent literature (see Dijkstra et al. 2020; Lechler, 2019; Schraff, 2019, among others), highly educated voters are expected to support less anti-EU parties, as they have on average better jobs and a more cosmopolitan view, in opposition to lower educated voters that, according to Gordon (2018), are more likely to support more localist and anti-establishment parties.
AEV
r,2013-2018= α + βX
r,t+ ν
c+ ε
r,t (1) 8Ý Share of population born in a different EU Country and share of population born outside EU. The two variables are defined at NUTS3 level of territorial aggregation (reference year 2011). Barone et al. (2016) find that immigrants have a causal effect on increasing votes for the centre-right coalition and on the rising of protest votes in Italy, in particular in smaller municipalities. Harteveld et al. (2018) demonstrate that the number of asylum applications in EU Member States did affect Euroscepticism in countries where it had increased. The relevant channels are cultural diversity, native-immigrant competition in the labour market and in the access to public services (Norris and Inglehart, 2019). Nicoli and Reinl (2020) confirm the result for European regions. In our empirical setting, instead of using a single variable regarding immigration, like in Barone et al. (2016), we distinguish migrants according to their place of origin. Population born in a different EU country has a different profile than those born outside the EU. For example, people born in another EU country are more likely to be employed than those born in that country, while people born outside the EU are less likely to be employed. Countries such as Portugal, Spain, France and Italy have seen an inflow of affluent retirees from colder Western European countries. The freedom of movement within the EU also means that people can easily move back to their country of birth or to another EU country, if the economic situation changes. This is much more complicated and costly for immigrants from more distant countries or countries experiencing conflict. Given the higher economic integration of the population born in another EU country, we expect that it will reduce voting for anti-EU parties. Compared to people born in another EU country, people born outside the EU may also stand out more because a higher share of them may have a different skin colour and may adhere to a religion with a distinct dress code. In several EU countries, Muslims and/or Jews have been cast in a negative light by populist parties. As a result, a high share of population born outside EU could be linked to a higher vote share for anti-EU parties.
ELECTORAL DISTRICTS CHARACTERISTICS
We follow Rodríguez-Pose (2018) and Dijkstra et al. (2020) and control for:
Ý Neighbourhood density, calculated for each electoral district using the density (reference year 2011) of 1km2 grid
cells. For each cell, density is multiplied by the population count. The products are summed by electoral district and divided by the total population of the district, providing a measure of spatial concentration. The advantage of using this methodology compared with the simple ratio between population and area is that this measure of density is not affected by the size of the geographic units for which it is calculated and approximates the average density of neighbourhood where residents live. Indeed, given the way in which population-weighted density is constructed, two constituencies with the same size and population where the first has very sparse population and the second very concentrated, will have very different population densities: very high the first, and very low the second. This also adds a differentiation within the three Degrees of Urbanisation. It will distinguish large from small cities, towns from suburbs,
5. For more details on the methodology, see Dijkstra et al. (2019).
and villages from other rural areas. This variable has been rescaled (the original value has been divided by 100) to make the magnitude of the estimated coefficients interpretable.
Ý Road performance is measured using the indicator recently introduced by Dijkstra et al., (2019), which combines accessibility and proximity into an overall metrics of road performance. Thanks to the high spatial resolution at which it can be computed, this measure allows to analyse and compare road performance among different types of settlements (cities, rural areas and towns and suburbs). As for GDP, road performance can be a proxy of the stage of development of an economy. It may also contribute to a higher confidence in national than EU institutions, which has been shown to contribute to anti-EU votes (De Vries 2018).5
ELECTORAL VARIABLES
The last group of variables includes turnout, defined as the number of valid votes expressed as a percentage of the total number of eligible voters, and conceived as another way to express dismay or approval of the EU (Dijkstra and Rodríguez-Pose, 2020) and the share of votes going to parties not included in the waves 2014 and 2017 of the Chapel Hill Expert Survey (CHES).
3.
RESULTS
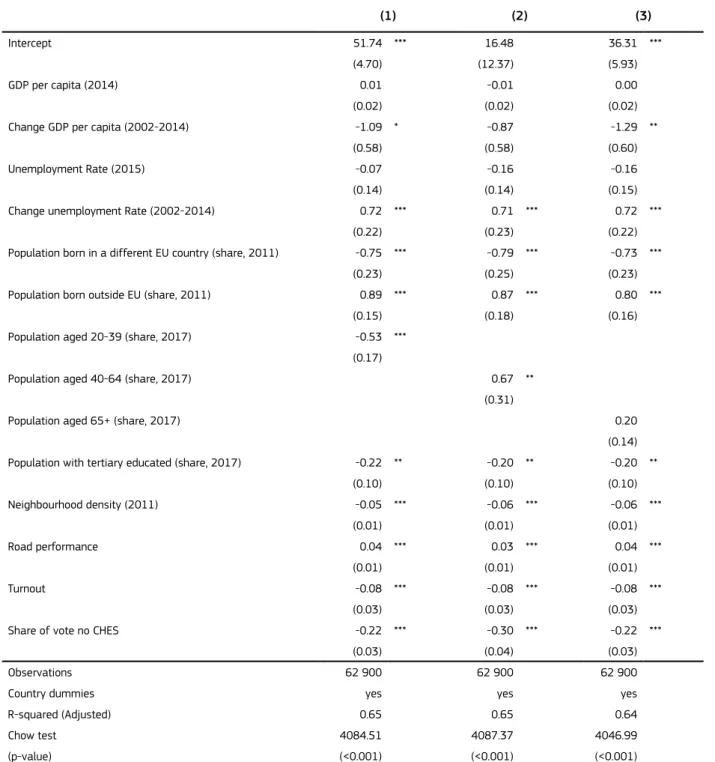
Results based on the full sample show that a combination of socio-demographic and economic factors are the main drivers of anti-EU votes in the EU and UK, which is in line with the literature (Goodwin et al. 2016). On average, electoral districts with a more educated workforce and a higher share of population aged 20 to 39 vote less for anti-EU parties in all three OLS regressions (see Table 3). In contrast, a higher share of population aged 40 to 64 increases the anti-EU vote, which suggests that the generational divide happens at an early age than retirement age. Growing unemployment rates has a highly significant link to a higher share of vote for anti-EU parties in all three regressions. A relative economic decline is also linked to a higher share of anti-EU voting, but it is not significant in one regression and less significant than changes in unemployment in the other two regressions. The level of unemployment and the level of GDP per capita both have no significant impact. Higher weighted population density (or neighbourhood density) reduces anti-EU voting and efficient, well-functioning road network increases it.
A recent study finds that the inflow of asylum seekers into the EU has increased Euroscepticism (Harteveld et al., 2018), while a number of studies conclude that concerns about immigration are the main drivers of support for radical right parties, for which a common factor is a strong aversion toward the EU (Evans and Mellon, 2016 and 2019; Hobolt and Tilley, 2016). Our results show that the presence of migrants is associated to a higher anti-EU vote, but only for migrants from outside the EU. In contrast, the presence of migrants from other EU countries leads to a lower support for anti-EU parties.
Higher neighbourhood densities lead to lower anti-EU voting in all three regressions, which fits with the significant differences found between cities, towns and suburbs, and rural areas. Better road performance, on the other hand, is linked to more anti-EU voting in all three regressions. As in Dijkstra and Rodríguez-Pose (2020), higher turnout leads to a lower share of anti-EU votes.
The Chow-White test rejects the joint null hypothesis of structural stability among areas, further corroborating our initial hypothesis that it is meaningful to analyse drivers of anti-EU voting separately for urban (cities, towns and suburbs) and rural areas. Table 4 examines how differences in the degree of urbanisation across European territories shape the level of anti-European voting at electoral district level in national elections.6
It shows that, among the economic factors, GDP per capita level has no effects on anti-EU vote, while its growth decreases anti-EU vote in rural areas. As expected, unemployment growth is positively and significantly correlated to the share of Eurosceptic vote, and this happens regardless of the type of area. On the other hand, high unemployment levels are significantly linked to lower anti-EU voting in cities and in towns and suburbs. This puzzling result is not new in literature and the possible causes are well-explained by Nicoli (2017). The author
6. Our data has a hierarchical structure, due to data availability, with variables measured at different levels of territorial aggregation. To check for the robustness
of our results, we performed additional estimates using a multilevel model (Hox, 2001). We estimated three alternative specifications of a multilevel model: [i] the first model includes country random effects, [ii] the second model is estimated at the NUTS3 level of territorial aggregation (i.e. electoral districts are ag-gregated at a larger territorial scale, the NUTS3) and country random effects, and [iii] a third model has NUTS3 nested within NUTS2 and controls for country random effects. Independently from the estimation technique used, the coefficients are found to be robust both in term of sign, magnitude and significance. For a discussion, see McNeish et al. (2017) and Primo et al. (2007). Results are available upon request.
observes that “although several northern countries have enjoyed low levels of unemployment, they have nonetheless developed strong Eurosceptic parties in opposition to bailout programmes for southern states (for example, the case of Finland's True Finns). In contrast, Southern European countries with very high levels of unemployment have seen the electoral emergence of Eurosceptic forces only some years after the beginning of the crisis (Italy after 2013; Spain in 2014). The results seem to suggest that voters attribute the responsibility in failing to address the crisis to the EU rather than blaming it for the crisis itself.” (Nicoli, 2017: page 324). Furthermore, given that he finds a positive correlation between the unemployment rate and non-zero net contributions to the financial support measures, he hypothesizes the existence of a domestic effect of economic governance.
Lechler (2019) shows that the share of EU migrants significantly and positively shapes individuals’ attitudes toward the EU, while the share of non-EU migrants does not have any significant effects. Our results show that the presence of immigrants has a significant impact in towns and suburbs and in rural areas, but not in cities. The impact in those areas is in line with our expectations. Areas with a higher share of population born in a different EU country have lower votes for Eurosceptic parties, which may be because they are more likely to have a job than the native born and tend to stand out less. Areas with a higher share of people born outside EU have higher share of anti-EU votes, which may be related to their lower employment rates and/or their visible differences. Cities have a much higher share of people born in another country (17 % of the population of 15 and older in 2019 in the EU28) than other areas do (12 % in towns and suburbs, and 6 % in rural areas). As a result, people in cities may be more accustomed to living with people born in other countries. This may explain why the share of population born in another EU country has no significant impact and the share of population born outside the EU has a weak and less significant impact. If the link between the share of people born outside the EU and anti-EU voting is primarily driven by economic concerns, then boosting employment growth and increasing the economic integration of people born outside the EU could lead to less anti-EU voting both directly, by reducing unemployment, and indirectly, by addressing economic concerns linked to immigration. If this link is primarily driven by a discomfort with visibly different populations, a purely economic policy will not address this problem.
In a recent article Lauterbach and De Vries (2020) empirically demonstrate that younger European generations are more supportive of the EU compared to older generations, and that this trend is context dependent, and varies across EU Member States. We also found that a higher share of younger people (20-39 years old) implies a lower vote share for anti-EU parties, but only in town and suburbs and in rural areas. On the other side, the share of people aged 40-64 has a significant and positive impact at 5 % level in towns and suburbs, and at 10 % in rural areas. Only in cities does the 10
share of people 65 and older have a significant positive affect on anti-EU voting. We draw from these results that in cities what matters is the share of older people, while in town and suburbs and in rural areas it is the share of younger and the middle aged. In the first case, it is possible that older age people feel uncomfortable with the rapid changes in cities and react by voting against further EU integration. On the other hand, in town and suburbs and in rural areas, youngers tend to vote pro EU, as they may perceive more directly the advantages of EU integration (for instance, in terms of travel opportunities, and study exchange programs). Population aged 40 to 64 in town and suburbs may be concerned about their income and employment prospects as technological change and trade affects some areas and industries more than others.
Following the same logic, tertiary education reduces Euroscepticism in towns and suburbs and rural areas by increasing people’s chances to secure a good job or find a new one. Cities have the highest share of tertiary educated (42 % in 2019 as a share of people aged 25-64), compared to towns and suburbs (29 %) and rural areas (24 %). Since 2012, the share of tertiary educated has been increasing in all three areas, but faster in cities. This lower growth in tertiary educated outside cities may lead to a wider gap in the perceived benefits of the EU or in the capacity to benefit from the opportunities offered by EU membership. This may explain why education has not impact on anti-EU voting in cities, but reduces it in towns, suburbs and rural areas. Significance levels are slightly lower than for other variables, but this may due to low spatial resolution of that data (NUTS2).
High population-weighted or neighbourhood density reduces anti-EU voting for all three types of areas, except in cities when controlling for the share of population aged 65 and over. This means that villages are less likely to vote anti-EU than other
rural areas, that towns are less anti-EU than suburbs and that large cities are less anti-EU than smaller cities. It is striking that not only does anti-EU voting in general decreases as densities rise, but this pattern is also found within each type of area. Road performance is also positively and highly significantly linked to anti-EU voting. This road performance indicator compares the population that can be reached in a 90 minute drive to the population within a 120 km radius. The combination
of a concentrated population with a dense road network including highways will always lead to a higher road performance. The positive impact of the road performance on anti-EU voting shows that it is not the lack of road infrastructure that leads to anti-EU voting. On the contrary, within each degree of urbanisation the lack of a performant road network is linked to less anti-EU voting. People in areas with a poor road performance may think that their area needs more public investment, which may make them more supportive to the EU and the transport investments it funds. It may also be related to a pattern found in recent papers where higher GDP is associated to higher anti-EU sentiment (see Dijkstra et al., 2020). As for GDP, road performance can be a proxy of the stage of development of an economy and may contribute to a higher confidence in national than EU institutions, which has been shown to contribute to anti-EU votes (De Vries 2018).
Finally, in contrast with Lecher (2019), turnout has a significant and negative impact on anti-EU vote shares. In other words, the higher the turnout, the lower the vote for anti-EU parties. Our finding is more in line with but in line with Rodríguez-Pose and Dijkstra (2020), who find that a higher turnout translates into less votes for populist parties.
(1) (2) (3)
Intercept 51.74 *** 16.48 36.31 *** (4.70) (12.37) (5.93) GDP per capita (2014) 0.01 -0.01 0.00 (0.02) (0.02) (0.02) Change GDP per capita (2002-2014) -1.09 * -0.87 -1.29 **
(0.58) (0.58) (0.60) Unemployment Rate (2015) -0.07 -0.16 -0.16 (0.14) (0.14) (0.15) Change unemployment Rate (2002-2014) 0.72 *** 0.71 *** 0.72 ***
(0.22) (0.23) (0.22) Population born in a different EU country (share, 2011) -0.75 *** -0.79 *** -0.73 ***
(0.23) (0.25) (0.23) Population born outside EU (share, 2011) 0.89 *** 0.87 *** 0.80 ***
(0.15) (0.18) (0.16) Population aged 20-39 (share, 2017) -0.53 ***
(0.17)
Population aged 40-64 (share, 2017) 0.67 ** (0.31)
Population aged 65+ (share, 2017) 0.20 (0.14) Population with tertiary educated (share, 2017) -0.22 ** -0.20 ** -0.20 **
(0.10) (0.10) (0.10) Neighbourhood density (2011) -0.05 *** -0.06 *** -0.06 *** (0.01) (0.01) (0.01) Road performance 0.04 *** 0.03 *** 0.04 *** (0.01) (0.01) (0.01) Turnout -0.08 *** -0.08 *** -0.08 *** (0.03) (0.03) (0.03) Share of vote no CHES -0.22 *** -0.30 *** -0.22 ***
(0.03) (0.04) (0.03)
Observations 62 900 62 900 62 900
Country dummies yes yes yes
R-squared (Adjusted) 0.65 0.65 0.64
Chow test 4084.51 4087.37 4046.99
(p-value) (<0.001) (<0.001) (<0.001)
Note: *p≤0.10; **p≤0.05; ***p≤0.01. Standard errors clustered at NUTS3 level in parenthesis.
TABLE 3: OLS Estimation results for the full sample)
Cities To wns and suburbs Rural areas (4) (5) (6) (7) (8) (9) (10) (11) (12) Intercept 52.19 *** 45.56 *** 35.46 *** 60.92 *** 13.29 44.43 *** 50.88 *** 18.75 34.36 *** (5.67) (13.05) (8.63) (6.29) (17.47) (8.73) (5.21) (13.52) (6.54) GDP per capita -0.02 -0.02 0.00 0.00 -0.01 -0.01 0.02 -0.01 0.00 (0.02) (0.02) (0.03) (0.02) (0.02) (0.03) (0.03) (0.02) (0.03)
Change GDP per capita
-0.23 -0.34 -0.37 -0.13 0.12 -0.25 -1.25 ** -1.07 -1.48 ** (0.52) (0.53) (0.52) (0.66) (0.63) (0.69) (0.64) (0.66) (0.64) Unemplo yment Rate -0.66 *** -0.72 *** -0.45 *** -0.53 *** -0.62 *** -0.72 *** 0.11 -0.02 0.02 (0.16) (0.16) (0.17) (0.18) (0.17) (0.20) (0.15) (0.14) (0.16) Change unemplo yment rate 0.68 ** 0.67 ** 0.79 *** 0.70 *** 0.63 ** 0.65 ** 0.70 *** 0.69 *** 0.70 *** (0.28) (0.28) (0.26) (0.27) (0.28) (0.28) (0.23) (0.24) (0.23) Born in diff erent EU country -0.02 -0.07 -0.15 -0.69 ** -0.75 ** -0.65 ** -0.81 *** -0.81 *** -0.77 *** (0.23) (0.22) (0.21) (0.29) (0.30) (0.28) (0.24) (0.28) (0.24) Born outside EU 0.21 * 0.18 0.27 ** 0.76 *** 0.79 *** 0.66 *** 1.00 *** 0.94 *** 0.92 *** (0.12) (0.13) (0.12) (0.21) (0.23) (0.22) (0.17) (0.19) (0.18) Population aged 20-39 -0.20 -0.66 *** -0.56 *** (0.14) (0.2324) (0.19) Population aged 40-64 0.10 0.91 ** 0.58 * (0.27) (0.42) (0.34) Population aged 65+ 0.48 ** 0.12 0.23 -0.19 -0.20 -0.14 Tertiary education -0.10 -0.12 -0.09 -0.26 ** -0.26 ** -0.24 ** -0.21 ** -0.18 * -0.18 * (0.09) (0.09) (0.09) (0.11) (0.11) (0.12) (0.10) (0.10) (0.10) Neighbourhood density -0.04 *** -0.04 *** 0.04 *** -0.06 *** -0.05 *** -0.06 *** -0.08 ** -0.09 ** -0.09 ** (0.01) (0.01) (0.01) (0.01) (0.01) (0.01) (0.03) (0.03) (0.03) Road perf ormance 0.07 *** 0.07 *** 0.07 *** 0.06 ** 0.05 ** 0.06 ** 0.04 *** 0.03 *** 0.04 *** (0.02) (0.03) (0.02) (0.02) (0.03) (0.02) (0.01) (0.01) (0.01) Turnout -0.32 *** -0.33 *** -0.34 *** -0.15 ** -0.15 ** -0.14 ** -0.08 *** -0.07 *** -0.08 *** (0.07) (0.07) (0.07) (0.07) (0.07) (0.07) (0.02) (0.03) (0.02) Share no CHES -0.11 ** -0.11 ** -0.12 ** -0.20 *** -0.20 *** -0.19 *** -0.22 *** -0.24 *** -0.23 *** (0.05) (0.05) (0.05) (0.06) (0.06) (0.06) (0.03) (0.03) (0.03) Observations 2 135 2 135 2 135 9 351 9 351 9 351 51 413 51 413 51 413 Country dummies yes yes yes yes yes yes yes yes yes R-squared (adj) 0.66 0.66 0.67 0.68 0.68 0.68 0.65 0.64 0.64
Note: *p≤0.10; **p≤0.05; ***p≤0.01. Standard errors clustered at NUTS
3 level in parenthesis.
TABLE 4: OLS Estimation results by type of area (for reference years of the variables, see Table 3)
Variable importance is a useful concept in econometric modelling. After estimating a linear regression model, quantifying the importance of each variable is often looked-for, not only for academic purposes but also to design the most effective interventions. This normally involves decomposing the variance, or, equivalently, its R-squared (Grömping, 2006 and 2015). Consequently, as a final step, we look at the relative contribution of each variable in the right hand side of equation (1) to the model's total explanatory power (that is on the total R-squared).7 See Figure 3. Overall, across the full
sample, we observe that the highest contribution (around 50 %) derives from country fixed effects, meaning that a large share of the variability is due to country-specific characteristics. Economic variables (GDP per capita level and growth, and unemployment share level and growth) have the second highest
7. See Annex I for more details on the methodology and a full description of the results, broken down by variable. Note that the relative importance of the
regressors is independent from the statistical significance of the explanatory variables. This means that we could have some regressors that explain a high share of the overall R2 in spite being not-significant, and the vice-versa. Therefore, in commenting the contribution of each variable to overall R2, we stress the
results only for variables that are found statistically different from zero.
contribution, corroborating previous findings on the drivers of anti-EU voting (Dijkstra et al., 2020), followed by socio-demographic characteristics (age, education, migrants born within and outside the EU). Without considering country fixed effects, economic variables seem to explain most of the variability in towns and suburbs and rural areas, due to significant impact of GDP change and unemployment change in rural areas and unemployment levels and change in towns and suburbs. Socio-demographic variables (education, age, share of migrants) have a significant impact in towns and suburb and rural areas, and especially in towns and suburbs, they explain a relevant share of variability. In cities only, electoral variables (turnout and share of no-CHES votes), in particular turnout, contribute substantially to the overall explanatory power of the model.
FIGURE 3: Relative contribution of the explanatory variables, based on results in columns (1), (4), (7), and (10)
0
5
10
15
20
25
30
35
DK AT FR HU IT SE CZ FI EL DE NL UK SK BG PT PL BE IE SI RO CY EE ES HR LT LU LV MT
Rural areas
Towns and suburbs
Cities
0 % 20 % 40 % 60 % 80 % 100 %
Rural Towns and suburbs Cities Full sample
Country fixed effects Regional economic variables
Regional socio-demographic variables Electoral variables
Electoral district characteristics
100 75 50 25 0 outliers median median median outliers outliers
Rural areas Towns and suburbs
Share of votes for anti-EU parties
Cities
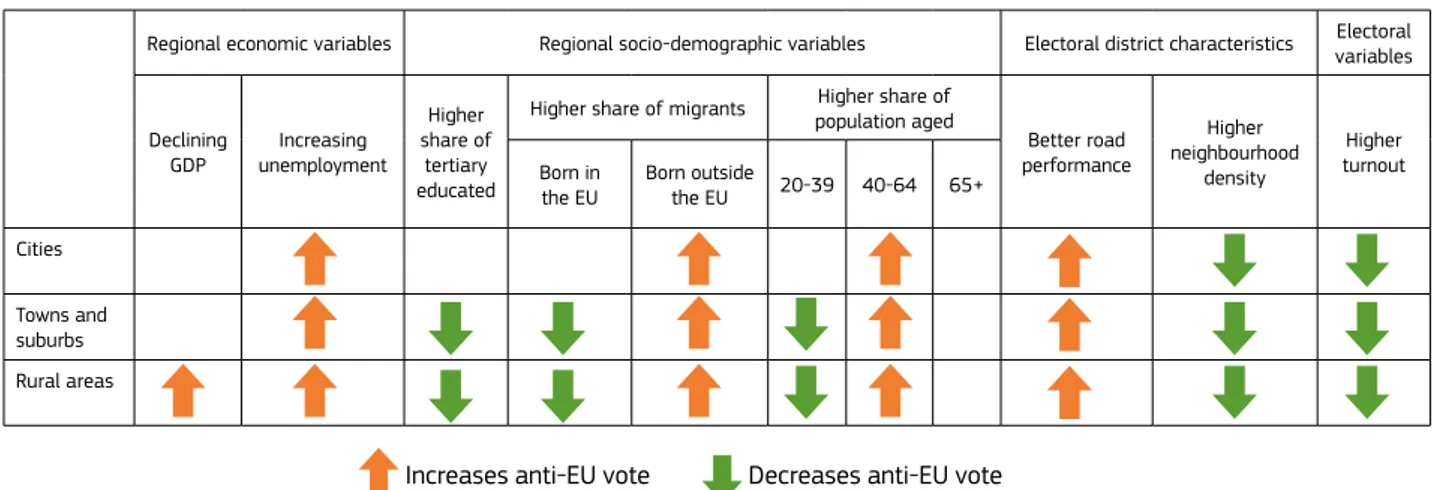
Regional economic variables Regional socio-demographic variables Electoral district characteristics Electoral variables Declining GDP unemploymentIncreasing Higher share of tertiary educated
Higher share of migrants population agedHigher share of
Better road performance Higher neighbourhood density Higher turnout Born in
the EU Born outside the EU 20-39 40-64 65+ Cities
Towns and suburbs Rural areas
Increases anti-EU vote Decreases anti-EU vote
TABLE 5: What drives Euroscepticism in cities, towns and suburbs and urban areas?
5.
CONCLUSION
This paper shows that people in rural areas are significantly more likely to vote for anti-EU parties, also after taking into account many economic, socio-demographic and local characteristics.
The issues linked to higher anti-EU voting also differ by degree of urbanisation. Economic decline leads to more anti-EU voting in rural areas, but not elsewhere. More tertiary educated reduces anti-EU voting in rural areas, towns and suburbs, but not in cities. This underlines the importance of promoting economic growth in rural areas. Increasing the share of tertiary educated outside cities depends not only on access to this type of education, but also on the employment opportunities for people with more qualifications. More remote education and employment opportunities could help to reduce this gap. The current pandemic is likely to accelerate the trend to more online learning and working remotely.
The impact of the age structure also depends on the degree of urbanisation. In rural areas, towns and suburbs a low share of people aged 20-39 and a high share of people aged 40-64 are both linked to more anti-EU voting, but not in cities. In cities, a high share of population aged 65 and over is linked to more anti-EU voting, but not elsewhere. Most studies have focussed on the elderly and the young, while this study highlights that Euroscepticism starts at middle age. More research is needed to understand how the perception of the EU changes across different age groups in the three different types of areas.
The impact of migrants depends on their country of birth and on the type of area. Migrants born outside the EU increase anti-EU voting, but not in cities. Migrants born in other EU countries reduce anti-EU voting, but this impact is smaller and less significant in cites. The right to free movement of people within the Union is an important achievement and tends to make people more supportive of the EU as well. The economic integration of people born outside the EU would benefit these migrants and the communities they live in. It may also reduce EU discontent especially in rural areas, towns and suburbs. The biggest impact on anti-EU voting, after the country effect, comes from the regional economic and socio-demographic variables. This implies that boosting economic growth, reducing unemployment, increasing education and supporting the economic integration of migrants born outside the EU have the most potential to reduce EU discontent, especially in rural areas. The key challenge is to understand what is driving this rural EU discontent. This paper provides a first indication of which factors contribute to anti-EU voting, but more research both quantitative and qualitative is needed. The public consultation launched by the European Commission in the context of the long-term vision for rural areas may provide additional insights into rural EU discontent.
6.
REFERENCES
Abreu, M., and Öner, Ö. (2020), Disentangling the Brexit vote: The role of economic, social and cultural contexts in explaining the UK’s EU referendum vote, Environment and Planning A, 52(7): 1434-56.
Alabrese, E.. Becker, S.O., Fetzer, T., and Novy, D. (2019), Who voted for Brexit? Individual and regional data combined, European Journal of Political Economy, 56: 132-50.
Algan, Y., Guriev, S., Papaioannou, E., and Passari, E. (2017). The European trust crisis and the rise of populism, Brookings Papers on Economic Activity, 2017: 309-400.
Barone G., D'Ignazio A., de Blasio G., and Naticchioni P. (2016), Mr. Rossi, Mr. Hu and politics. The role of immigration in shaping natives, voting behaviour, Journal of Public Economics 136: 1-13.
Budescu, D. V. (1993). Dominance analysis: A new approach to the problem of relative importance of predictors in multiple regression, Psychological Bulletin, 114: 542-51.
Cramer, Kathy. (2016). The politics of resentment. Rural consciousness in Wisconsin and the rise of Scott Walker. Chicago, IL: University of Chicago Press.
De Vries, Catherine (2018), Euroscepticism and the Future of European Integration, Oxford, UK: Oxford University Press. Dijkstra, L., and Poelman, H. (2014), A harmonised definition of cities and rural areas: the new degree of urbanization, DG REGIO Working Paper Series, nr. 01-2014.
Dijkstra, L., Poelman, H., & Ackermans, L. (2019). Road transport performance in Europe. Introducing a new accessibility framework, DG REGIO Working Paper Series, nr. 01-2019. Dijkstra, L., Poelman, H., & Rodríguez-Pose, A. (2020). The geography of EU discontent. Regional Studies, 54(6): 737-53. Emmenegger, P., Marx, P. and Schraff, D. (2015) Labour market disadvantage, political orientations and voting: how adverse labour market experiences translate into electoral behaviour, Socio-Economic Review, 13(2): 189–213.
Essletzbichler, J., Disslbacher, F., and Moser, M. (2018), The victims of neoliberal globalisation and the rise of the populist vote: a comparative analysis of three recent electoral decisions, Cambridge Journal of Regions, Economy and Society, 11(1): 73-94.
European Commission (2019) Eurostat regional yearbook 2020 edition. Luxembourg: Publications Office of the European Union. Evans, G, Mellon, J., (2016). The 2016 referendum, Brexit and the left behind: An aggregate-level analysis of the result, The Political Quarterly, 87(3), 323-32.
Evans, G, Mellon, J., (2019), Immigration, Euroscepticism, and the rise and fall of UKIP, Party Politics, 25(1): 76-87.
Gordon, I. R. (2018), In what sense left behind by globalisation? Looking for a less reductionist geography of the populist surge in Europe, Cambridge Journal of Regions, Economy and Society, 11(1): 95-113.
Grömping, U. (2006) Relative importance for linear regression in R: the package relaimpo. Journal of Statistica Softwares 17: 1-27.
Grömping, U. (2015), Variable Importance in Regression Models, WIREs Computational Statistics, 7:137–152.
Guiso L., Herrera H., Morelli M., and Sonno T. (2018) Demand and Supply of Populism. EIEF Working Papers Series.
Guiso L., Herrera H., Morelli M., and Sonno T. (2020), Global Crises and Populism: the Role of Eurozone Institutions, Economic Policy, 34 (97): 95-139.
Harteveld, E., Schaper, J., De Lange, S. L., and Van Der Brug, W. (2018), Blaming Brussels? The Impact of (News about) the Refugee Crisis on Attitudes towards the EU and National Politics, JCMS: Journal of Common Market Studies, 56: 157– 77.
Hobolt, S.B., and Tilley, J. (2016), ‘Fleeing the Centre: The Rise of Challenger Parties in the Aftermath of the Euro Crisis’, West European Politics, 39(5): 971–91.
Hox, J.J., (2010), Multilevel Analysis. Techniques and Applications. 2nd ed. New York, NY: Routledge.
Jennings W., Stoker G., and Twyman J. (2016), The Dimensions and Impact of Political Discontent in Britain, Parliamentary Affairs, 69(4): 876-900.
Judis, John. (2016). The populist explosion: How the great recession transformed American and European politics. New York, NY: Columbia Global Reports.
Harteveld, E., Schaper, J., de Lange, S.L., and & van der Brug, W. (2018), Blaming Brussels? The impact of (news about) the refugee crisis on attitudes towards the EU and national politics, Journal of Common Market Studies, 58(1): 157-177.
Lauterbach, F. and De Vries, C.E. (2020) Europe belongs to the young? Generational differences in public opinion towards the European Union during the Eurozone crisis, Journal of European Public Policy, 27(2): 168-87
Lechler M. (2019) Employment shocks and anti-EU sentiment. European Journal of Political Economy, 59: 266-95.
Lindeman, R. H., Merenda, P. F., & Gold, R. Z. (1980), Introduction to bivariate and multivariate analysis, Glenview, IL: Scott, Foresman and Company.
Marcinkiewicz, K. (2018), The Economy or an Urban–Rural Divide? Explaining Spatial Patterns of Voting Behaviour in Poland, East European Politics and Societies, 32(4): 693-719. Moretti, E. (2012) The New Geography of Jobs, New York, NY: Houghton Mifflin Harcourt.
McNeish, D., Stapleton L., and Silverman, R.S., (2017), On the Unnecessary Ubiquity of Hierarchical Linear Modeling, Psychological Methods, 22, 114-140.
Moulton, B.R. (1986), Random group effects and the precision of regression estimates, Journal of Econometrics, 32(3): 385–97. Nicoli F. (2017), Hard-Line Euroscepticism and the Eurocrisis: Evidence from a Panel Study of 108 Elections Across Europe, Journal of Common Market Studies, 55(2): 312-31.
Nicoli F., Reinl A.-K. (2020), A tale of two crises? A regional-level investigation of the joint effect of economic performance and migration on the voting for European disintegration. Comparative European Politics, 18: 384-419.
Norris, P., & Inglehart, R. (2019). Cultural backlash: Trump, Brexit, and authoritarian populism. Cambridge: Cambridge University Press.
Primo D.M., Jacobsmeier, M.L., and Mylio J. (2007) Estimating the Impact of State Policies and Institutions with Mixed-Level Data, State Politics and Policy Quarterly, 7: 446-59.
Ramiro L. (2016) Support for radical left parties in Western Europe: social background, ideology and political orientations, European Political Science Review, 8(1): 1-23.
Rodden, J.A. (2019), Why Cities Lose: The Deep Roots of the Urban-Rural Divide, Basic Books: New York
Rodríguez-Pose, A. (2018), The revenge of the places that don’t matter (and what to do about it), Cambridge Journal of Regions, Economy and Society, 11(1): 189–209.
Schoene M. (2019) European disintegration? Euroscepticism and Europe’s rural/urban divide, European Politics and Society, 20(3): 348-64.
Schraff, D. (2019). Regional redistribution and Eurosceptic voting, Journal of European Public Policy, 26(1): 83-105. Scoones, I., Edelman, M. and Borras, S.M. Jr (2018), Emancipatory rural politics: confronting authoritarian populism, Journal of Peasant Studies, 45(1): 1–20.
ANNEX A - RELATIVE
IMPORTANCE OF THE
EXPLANATORY VARIABLES
An interesting method to determine the relative importance of each regressor to the total variability has been proposed by Budescu (1993), Lindeman et al. (1980) and Grömping (2006). Introduced by Lindeman, Merenda, and Gold (1980), consists into a decomposition of the overall R-squared (or R2) of themodel into non-negative contributions for each predictor term. This approach is based on sequential R2’s obtained accounting
for the additional contributions of a variable towards the total R2. The additional contribution is calculated considering all
possible degrees of contribution of a variable in all subset models under the original model. The LMG removes the dependence on orderings that bias stepwise regression by averaging over orderings. It is worth mentioning that the relative importance of regressors is independent from its statistical significance. This means that we could have some regressors that explain a high share of the overall R2 in spite
being not-significant, and the vice-versa. Therefore, in commenting the contribution of each variable to overall R2, we
stress the results only for variables statistically different from zero.
The relative contribution of each predictor normalized and summed to the total R-square for models (1), (4), (7) and (10), i.e. the model for the whole sample, cities, towns and suburbs, and rural areas are described below. To simplify the discussion, we choose to report only models with the variable Population aged 20-39, given that the relative contribution of each predictor changes only marginally with the other age classes. Overall, we observe that the higher contribution to the R2,
around 50 %, comes from country fixed effects. This points to the fact that a large share of the variability is accounted from country characteristics. Among the variables defined at a lower territorial level, the most important in contributing to the R2 are
the economic ones (GDP per capita level and growth, and unemployment share level and growth), followed by the share of people aged 20-39, and by voter turnout and population weighted density. Relevant differences are observed among areas. Economic variables are relatively more important in rural areas, where they contribute for around 35 % of the R2. In those
areas, the share of people aged 20-39 has a crucial role in explaining anti-EU vote (6.6 %) too, followed by turnout (4.8 %). In towns and suburbs economic variables are also relatively important, accounting for 27.5 % of R2. However, 11.6 % is
accounted by non-significant variables (GDP per capita level and growth). Differently from rural areas, after the share of people aged 20-39 (9.3 %) there is weighted population density (4.9 %) and then the share of population born outside EU (3.5 %). In cities, between statistically significant variables there are, in order of importance, turnout (10.7 %), unemployment level and growth (9.7 % together), weighted population density (7.7 %) and the share of population born outside EU is 1.5 %. 18
ANNEX B: DESCRIPTIVE STATISTICS
Full sample Cities To wn and suburbs Rural areas Min Mean Std.dev . Max Min Mean Std.dev . Max Min Mean Std.dev . Max Min Mean Std.dev . Max Anti EU vote (2013- 2018) 0 21.13 14.02 100 0 16.11 11.42 65.08 0 20.255 13.76 77.99 0 21.49 14.12 100 GDP per capita (2014) 22.6 87.26 24.78 342.2 22.6 112.23 39.87 342.20 22.6 94.027 30.04 272.17 22.6 84.99 21.95 342.2GDP per capita (change 2002-2014)
-2.35 0.34 1.07 6.13 -2.11 0.51 1.04 6.13 -2.35 0.232 1.15 6.00 -2.35 0.36 1.05 6.00 Unemplo yment Rate (2015) -9.18 2.75 3.60 16.83 -9.18 2.86 3.86 14.07 -9.18 3.52 4.01 16.83 -9.18 2.61 3.49 16.83 Unemplo yment Rate (change, 2002-2014) 2.53 11.68 4.98 33.99 2.53 11.05 5.93 33.99 2.53 11.65 5.77 31.54 2.54 11.72 4.78 31.54 Born in diff . EU country (2011) 0.08 3.12 1.72 31.37 0.14 3.73 2.73 31.37 0.08 3.12 1.88 31.37 0.08 3.09 1.62 31.37 Born outside EU (2011) 0.03 5.19 3.26 36.19 0.17 8.95 6.29 30.53 0.06 5.96 3.51 36.19 0.03 4.89 2.89 20.04 Pop. aged 20-39 (2017) 15.1 23.85 3.22 48.60 18.44 26.64 3.64 48.60 15.12 24.73 2.73 35.30 15.12 23.58 3.20 35.30 Pop. aged 40-64 (2017) 21.0 34.54 1.56 43.37 20.96 33.57 2.33 39.40 29.3 34.83 1.79 43.37 29.75 34.53 1.46 42.11 Pop. aged 65+ (2017) 5.93 21.12 3.75 35.06 5.93 18.14 3.49 30.92 9.97 20.17 3.31 30.92 9.97 21.41 3.75 35.06 Tertiary educated (2017) 12.1 29.72 7.62 71.70 12.70 34.49 11.31 71.70 12.1 28.19 9.07 57.1 12.1 29.8 7.02 57.1 Neighbourhood density (2011) 0.01 6.99 15.16 376.2 2.40 59.73 41.89 376.52 0.89 17.61 15.09 194.36 0.01 2.86 3.75 53.15 Road perf ormance 0 70.96 25.04 291.48 26.05 95.30 15.98 256.17 0 82.80 20.59 264.79 0 67.79 24.88 291.48 Turnout (2013-2018) 4.03 59.71 11.61 141.5 6.2 61.87 12.92 90.94 20.5 62.27 12.92 95.43 4.03 59.16 11.22 141.5 Vote no CHES 0 6.07 7.88 100 0 5.05 6.20 61.62 0 5.54 5.559 67.3 0 6.20 8.29 100
ANNEX C: CORRELATION MATRIX
Anti-EU vote GDP per capita GDP per capita gro
wth
Unem- ployment Rate 2015
Gro wth unem-plo yment Rate 2002-2014
Born in different EU country Born out- side EU
Pop.
Pop.
Pop. aged 65+ Tertiary educa- tion Neighbour- hood density Road perf
or-mance
Turnout
Share vote no CHES
aged 20-39 aged 40-64
Anti-EU vote
1
GDP per capita (NUTS3)
0.19
1
GDP per capita gro
wth (NUTS3)
-0.35
-0.04
1
Unempl. Rate 2015 (NUTS2)
-0.28 0.06 -0.34 1 Gro wth unempl. Rate 2002- 2014 (NUTS2) -0.51 -0.35 0.03 0.3 1 Born in diff . EU
country (share, NUTS3)
-0.06 0.3 -0.05 0.09 0.03 1
Born outside EU (share, NUTS3)
0.07 0.54 -0.22 0.21 -0.01 0.5 1
Population aged 20-39 (share, NUTS3)
-0.38 0.12 0.52 0 0.35 0.02 0.14 1
Population aged 40-64 (share, NUTS3)
-0.09 -0.09 -0.2 0.23 -0.05 0.08 -0.19 -0.39 1
Population aged 65+ (share, NUTS3)
0.07 -0.25 -0.36 0.17 -0.12 0 -0.19 -0.83 0.52 1
Tertiary educated (share, NUTS2)
-0.03 0.44 0.05 -0.1 -0.12 0.37 0.41 -0.11 -0.27 -0.05 1 Neighbourhood density -0.16 0.17 0.03 0.07 0.13 0.07 0.24 0.27 -0.05 -0.19 0.06 1 Road perf ormance (1H5) 0.1 0.26 -0.22 0.16 0.03 0.04 0.25 0.06 -0.14 -0.18 0.15 0.22 1 Turnout -0.28 0.17 -0.03 0.29 0.21 0.18 0.09 0.11 0.37 0.1 -0.05 0.09 -0.01 1
Share of vote no CHES
0.06 -0.02 -0.06 -0.16 -0.17 0.02 0.03 -0.11 0.02 0.04 -0.02 -0.05 -0.07 -0.16 1 20
Getting in touch with the EU
IN PERSONAll over the European Union there are hundreds of Europe Direct Information Centres. You can find the address of the centre nearest you at: http://europa.eu/contact ON THE PHONE OR BY E-MAIL
Europe Direct is a service that answers your questions about the European Union. You can contact this service
– by freephone: 00 800 6 7 8 9 10 11 (certain operators may charge for these calls), – at the following standard number: +32 22999696 or
– by electronic mail via: http://europa.eu/contact
Finding information about the EU
ONLINEInformation about the European Union in all the official languages of the EU is available on the Europa website at: http://europa.eu
EU PUBLICATIONS
You can download or order free and priced EU publications from EU Bookshop at: https://bookshop.europa.eu. Multiple copies of free publications may be obtained by contacting Europe Direct or your local information centre (see http://europa.eu/contact) EU LAW AND RELATED DOCUMENTS
For access to legal information from the EU, including all EU law since 1951 in all the official language versions, go to EUR-Lex at: http://eur-lex.europa.eu
OPEN DATA FROM THE EU
The EU Open Data Portal (http://data.europa.eu/euodp/en/data) provides access to datasets from the EU. Data can be downloaded and reused for free, both for commercial and non-commercial purposes.