CONTENTS
1 INTRODUCTION... 5
2 TRANSURANUS MODELLING ... 5
3 EXPERIMENTAL FINDINGS ON SOLIDUS TEMPERATURE... 6
4 MODELS AVAILABLE IN LITERATURE ... 9
4.1 K
OMATSU MODEL... 9
4.2 A
DAMSON MODEL... 10
4.3 K
ONNO MODEL... 10
5 REFERENCE EXPERIMENTAL DATASET ... 10
6 RESULTS AND DISCUSSION... 11
7 CONCLUSIONS... 14
ACKNOWLEDGEMENTS ... 14
1 INTRODUCTION
The fuel melting temperature is one of the key properties for the design of
nuclear systems and the assessment of their safety performance under normal and
accident conditions [1]. Melting temperature, usually intended as solidus temperature,
decreases under irradiation due to the build–up of fission products in the fuel matrix.
Other parameters are of great importance in the evaluations of this physical property,
markedly: plutonium concentration, O/M ratio and the concentration of minor
actinides (MAs). In MOX fuel for fast breeder reactors (FBRs) the high content of
plutonium plays a prominent role. The report presents a review of the experimental
findings and, based on this information, an assessment of the status of
TRANSURANUS. In order to improve the code performance, the accuracy of other
models published in literature was investigated to identify promising correlations.
In the following sections, the options offered by the code and the models
discussed in the document are briefly described. Afterwards, the mentioned review
and the results of the assessment are presented. In the final section, some
conclusions are given.
2 TRANSURANUS
MODELLING
The code is capable of simulating phase changes [2]. In addition to the
thermophysical properties, the solidus temperature is one of the input parameters of
important models such as the formation/closure of central void and the thermal strain
between solid and liquid phases [2]. For FBR applications, the code offers two
correlations given in equations (1) and (2). While in the former a conservative
approach is adopted, accounting for the scatter of experimental data with a shift of 40
K, the latter is the correlation recommended for the analysis of fast reactors.
bu M O Pu Pu Pu sol m
c
c
c
T
T
T
,=
2800
−
450
−
60
⋅
(
1
−
)
+
273
.
15
−
Δ
/−
Δ
(1)
bu M O Pu sol mc
T
T
T
,=
2840
−
450
+
273
.
15
−
Δ
/−
Δ
(2)
These relationships depend on the local concentration of plutonium (c
Pu) taking
into account the impact of the O/M ratio and burn−up according to the following two
terms:
2 4 /=
10
⋅
(
/
−
2
)
Δ
T
O MO
M
(3)
bu
T
bu=
7
Δ
(4)
In (4), the value of burn−up (bu) is expressed in at.%.
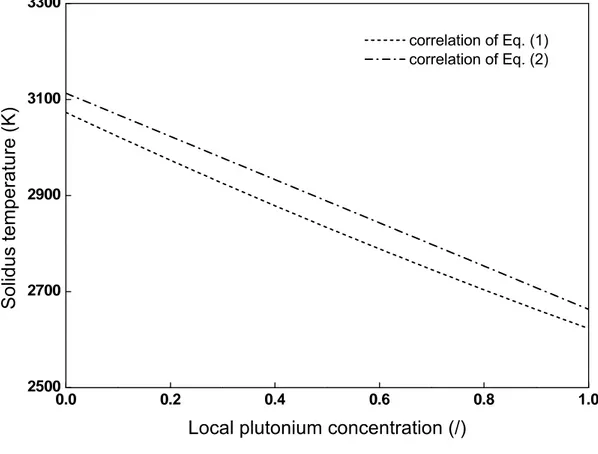
In regard to the effect due to the presence of plutonium, the code predicts the
decrease of melting point by a value of about 400 K (for a concentration of 100 wt.%
− pure PuO
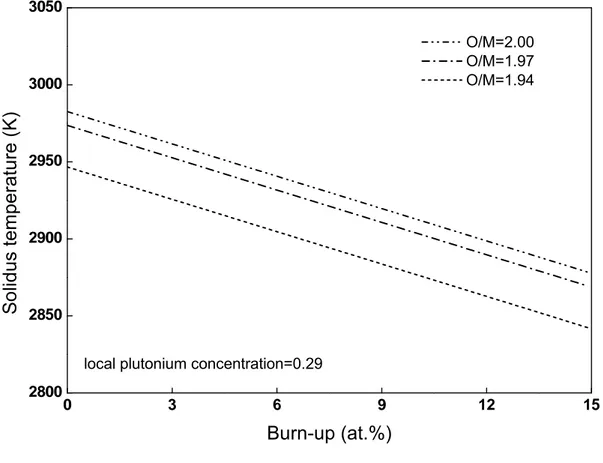
2); see Fig. 1. In the domain of burn−up and O/M ratio typical of
next−generation fast reactors (15−20 at.%, 1.94−2.00), the change in the melting
temperature predicted by the code is about 100 K for 15 at.% and 40 K for a value of
the O/M ratio of 1.94; see Fig. 2.
0.0 0.2 0.4 0.6 0.8 1.0 2500 2700 2900 3100 3300 correlation of Eq. (1) correlation of Eq. (2)
S
o
lidus
te
mperat
ure (K
)
Local plutonium concentration (/)
Figure 1: Predictions of solidus temperature for a stoichiometric MOX
3
EXPERIMENTAL FINDINGS ON SOLIDUS TEMPERATURE
The initial method used for the determination of the effect of burn−up was the
V−shaped filament technique, afterwards, most of the data was obtained by means of
the thermal arrest method [3]. In this technique, specimens are enclosed in a
tungsten capsule sealed in high vacuum to overcome the sources of inaccuracies
envisaged in the previous methods: the high oxygen pressure and the changes in
stoichiometry occurring during the measurement [3]. The results of these
experiments proved to be in agreement with the V−shaped results confirming a
negligible change in the solidus temperature up to 43 GWd/t; the concentration of
plutonium oxide was 18 wt.% [3].
5
The effect of burn−up based on the use of the V−shaped filament method had
suggested a negligible effect up to 80 GWd/t for a 20 wt.% presence of plutonium [3].
At the same values of plutonium concentration (18−20 wt.%), in a burn−up domain
extended up to 110 GWd/t, it was noted a slight decrease of the melting temperature
beyond 50 GWd/t [4]. Based on the ideal solution theory and the results of Adamson,
a model for the calculation of melting point was proposed; see § 4.1 [4,10]. The
model predicts a decrease of the solidus temperature under irradiation with a rate of
7.3 K per at.% [4].
0 3 6 9 12 1 2800 2850 2900 2950 3000 3050local plutonium concentration=0.29
S
o
lidus
temperature (K
)
Burn-up (at.%)
O/M=2.00 O/M=1.97 O/M=1.94Figure 2: Predictions of burn−up and O/M ratio effects: correlation of Eq. (2)
Measurements performed for a PuO
2concentration in the range 25–29 wt.%,
O/M 1.93–1.98 and burn–up up to 124 GWd/t were presented in [5]. In particular, for
a concentration of 29 wt.%, the solidus temperature was estimated to be linearly
decreasing at a pace of 5 K per 10 GWd/t [5]. In the same reference [5], the
negligible dependence on burn-up reported in [3,4] was questioned suggesting to
reconsider the analysis at low plutonium concentrations. The driving phenomenon of
this behaviour was argued to be not only the accumulation of fission products in the
matrix, in fact, theoretical investigations proved to underestimate the results of
experiments with an evaluation of this contribution in the term of 2 5 K per 10 GWd/t
[5]. In [5], some interactions between the capsule and the specimens were reported
as well.
Measurements on specimens irradiated up to 124 GWd/t in the JOYO reactor
were presented in [6]. The authors developed a model through a regression analysis
of the experimental data considering the actual composition of the samples at
measurement through numerical simulations [6]. The correlation predicts an effect of
burn−up on the depression of solidus temperature of about 6 K per 10 GWd/t with a
rate decreasing at high burn−up [6]. This prediction was close to the evaluation in [4]
and higher than the analytical evaluations presented in [5].
To explain the discrepancies, it was suggested that the non−ideal behaviour
was caused by the formation of eutectic phases with less soluble fission products [6].
In agreement with an ideal solution behaviour, the model accounts for the presence
of plutonium with a coefficient similar to that found by Adamson [6,10]. For minor
actinides, the model predicts a decrease of about 10 K per wt.%. The effect of the
O/M ratio was considered negligible except for un−irradiated or low burn−up fuel (<
50 GWd/t) where a nearly constant behaviour of the solidus temperature was found
[3,4]. The model was refined extending its domain of application through
measurements on SIMFUEL up to 250 GWd/t where the saturation of burn−up effect
was confirmed [7]. The correlations were further improved with new experimental
results and refined experimental data, in particular by introducing the effect of the
O/M ratio [8]. The correlations of this model are presented in § 4.3.
Lyon and Baily had investigated the effect of the concentration of PuO
2on the
values of solidus temperature in stoichiometric MOX fuel by means of the thermal
arrest method with a tungsten capsule sealed in argon atmosphere [9]. The results
they presented were markedly consistent with the hypothesis of an ideal solution; the
importance of the calibration in the high temperature region was also highlighted [9].
The correlation of the melting point recommended by the code is based on
these experimental results [2]. The model proposed in [10] is also based on a
re-evaluation of the measurements discussed in [9]. The work carefully investigated the
effect on the solidus temperature due to the accumulation of soluble fission products
under irradiation [10]. The numerical evaluations confirmed a depression of the
solidus temperature of the order of 24.5 K for 10 at.% a value based on the
hypothesis of ideal solution and plutonium concentration of 20 wt.% [10]. Insoluble
fission products, usually in small quantities, were judged to be of minor importance in
the melting of the fuel bulk assumed to be driven by the solidus temperature [10].
The dependence of the solidus temperature on the O/M ratio of MA−bearing
MOX was investigated in [11]. The studied concentration of minor actinides was 4
wt.% and 2 wt.% the concentration of fission products [11]. The study reported that,
for a concentration of plutonium of 30 wt.%, the melting temperature tends to
decrease with an increasing O/M ratio [11].
While in ref. [12] a good agreement with the data published in [9] was noted, the
experimental results for high plutonium concentration (30 and 40 wt.%) proved to be
affected by a reaction of the specimens with the W−capsule [12]. As to the effect of
stoichiometry, the temperature of the thermal arrest decreased with the increase of
the O/M ratio [12]. The following study proved the reaction of the specimens with the
tungsten capsule and proposed to overcome this limitation by using a rhenium
capsule [13]. For a concentration of plutonium of 40 wt.%, the experimental result
obtained by using the Re−capsule showed a value 100 K higher than previously
measured [13]. The fitting of the experimental data according to an ideal solution
model suggested a value of the PuO
2melting point of 2843 K, i.e. 200 K higher than
previous results, and an impact of the americium content of the order of 4 K per wt.%
[13].
As to the effect of burn–up, a comparison of Re− and W−capsule
measurements was presented in [14]. The range of the experimental data spans up
to 112.5 GWd/t for a plutonium concentration of about 30 wt.% [14]. In this domain,
the authors reported a linear decrease of the melting point at a rate in good
agreement with published models; measurements performed using a Re−capsule
showed absolute values higher by about 30 K [14]. The solubility limit of fission
products confirmed to be a possible bound in the decrease of melting point at very
high burn–up [14]. A MOX fuel initially containing 3 wt.% of americium and irradiated
at 150 GWd/t was simulated and its melting temperature measured adopting the
thermal arrest technique with a Re−capsule [15]. The obtained result was within the
uncertainties of previous published results [15]. The authors of [16], dealing with low
contaminated un−irradiated MOX fuel, suggested an impact of minor actinides on the
solidus temperature of the order of 2−4 K per wt.%. The O/M ratio proved to diminish
the value of the solidus temperature by about 30 K moving from 1.94 to stoichiometry
[16].
To overcome the problems due to the interaction of the specimens with the
capsule, the application of the laser heating technique was proposed. The
measurement of the melting point of PuO
2by means of the laser heating method
gave a value of 3017 K, much higher than previously assumed [17]. On the track of
this result, the melting temperature of MOX fuel with high plutonium concentrations
was carried out [18]. The results, consistent with the findings of [17], showed, in
general, values higher than presented in [9]. This data highlighted the need to
redefine the phase diagram of the binary system UO
2−PuO
2in the high plutonium
concentration domain [18].
4
MODELS AVAILABLE IN LITERATURE
This section briefly presents the models discussed in the report. The name
given to each model is referring to the first in the list of authors of reported
references.
4.1 Komatsu
model
The model by Komatsu calculates the value of solidus temperature according to
the following formula with a dependence on plutonium, burn−up and stoichiometry
[4]. The solidus temperature of UO
2is assumed to be 2865 °C. The X parameter is
)
(
011
.
0
1811
.
0
1
)
/
2
(
2388
.
0
1
2 2 ,T
UO
Y
Y
M
O
T
msol m−
+
−
−
=
(5)
BU X Y = +0.016(6)
4.2 Adamson
model
The model by Adamson deals with un−irradiated and stoichiometric MOX
through a polynomial expression dependent on the concentration of plutonium [9,10].
In presented results, the predictions of the model were refined through a multiple
regression of the numerical evaluations of the impact of burn−up [10]. The correlation
by Adamson (K) is:
3 2 ,sol3120
.
0
655
.
3
Pu336
.
4
Pu99
.
9
Pu mc
c
c
T
=
−
+
−
(7)
4.3 Konno
model
The model by Konno expresses the dependence of the solidus temperature on
plutonium concentration, O/M ratio, stoichiometry and americium concentration [6−8].
bu Am M O Pu Pu sol m
c
c
T
T
T
T
,=
3138
−
497
+
60
2−
Δ
/−
Δ
−
Δ
(8)
where:
)
/
2
)(
2850
1000
(
/c
O
M
T
bO M=
−
Pu−
Δ
(9)
Am Pu Amc
c
T
=
(
1206
−
782
)
Δ
(10)
2 5 . 1)
66
.
0
/
)
43
.
1
06
.
1
((
0008
.
0
)
43
.
1
06
.
1
(
c
bu
c
bu
T
bu=
−
Pu−
−
PuΔ
(11)
The model is valid in the following domains:
─
Plutonium concentration 10−40 wt.%.
─
Americium concentration <2 wt.%.
─
O/M
ratio
1.94−2.00.
─
Burn−up
0−250 GWd/t.
5 REFERENCE
EXPERIMENTAL DATASET
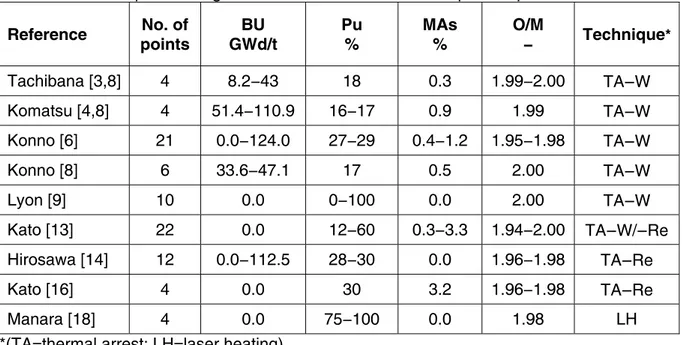
Table 1 resumes some information regarding the experimental dataset applied
in the assessment of the investigated models. Measurements on SIMFUEL
presented in [7,15] were not used in this study.
6 RESULTS
AND
DISCUSSION
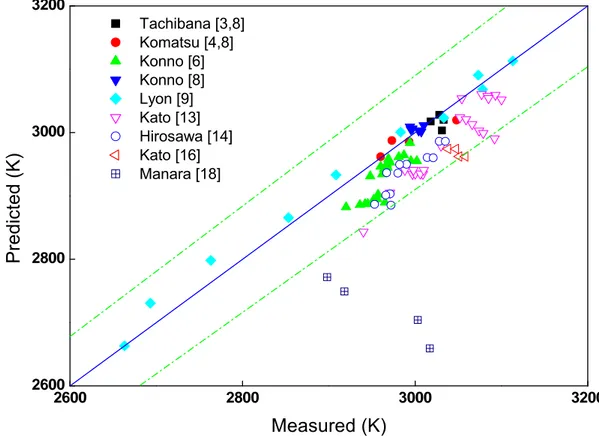
The predictions of the model recommended by the code are compared with the
related experimental data in Fig. 3. The predictions show deviations mostly of the
order of ±3%. Based on the assumption that the effect of burn−up is in good
agreement with the literature review, noting that the impact of MAs and O/M ratio
turned out to be limited in the predictions of selected experimental points, a deeper
consideration for the effect of the concentration of plutonium is needed. As shown in
Fig. 3, the accuracy of the correlation is close to the experimental uncertainties
considering the points with plutonium concentrations lower than 20 wt.%. In
agreement with the considerations leading to the use of a Re−capsule, eq. (2) in
general underestimates the measurements by Kato while the data by Hirosawa
confirms a nearly constant underestimation in the considered burn−up domain. Much
higher deviations were found for the data published in [18].
Preliminary conclusions drawn from this assessment could suggest that the
recommended code correlation shows a fairly good description of the effect of
burn-up and plutonium concentration burn-up to 20−25 wt.% thereafter the underestimation is
more significant and, in general, increasing with the concentration. The description of
the effect of the O/M ratio is not in agreement with recent results where the solidus
temperature is decreasing with the increasing of the O/M ratio.
Table 1: Description of significant information of the adopted experimental dataset
Reference points No. of GWd/t BU Pu % MAs % O/M − Technique* Tachibana [3,8] 4 8.2−43 18 0.3 1.99−2.00 TA−
W Komatsu [4,8] 4 51.4−110.9 16−17 0.9 1.99 TA−
W Konno [6] 21 0.0−124.0 27−29 0.4−1.2 1.95−1.98 TA−
W Konno [8] 6 33.6−47.1 17 0.5 2.00 TA−
W Lyon [9] 10 0.0 0−100 0.0 2.00 TA−
W Kato [13] 22 0.0 12−60 0.3−3.3 1.94−2.00 TA−
W/−
Re Hirosawa [14] 12 0.0−112.5 28−30 0.0 1.96−1.98 TA−
Re Kato [16] 4 0.0 30 3.2 1.96−1.98 TA−
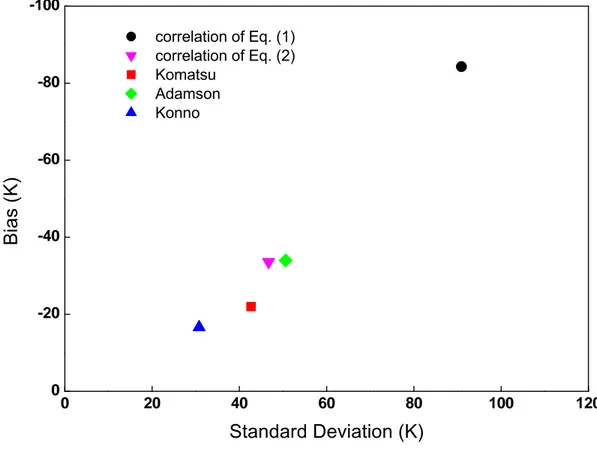
Re Manara [18] 4 0.0 75−100 0.0 1.98 LH *(TA=thermal arrest; LH=laser heating)Table 2 and Fig. 4 show standard deviation and bias of the calculated
predictions. According to the results from eq. (2), see Fig. 3, the values published in
[18] were not taken into account in the comparison. The analysis is therefore
referring to a plutonium domain with concentrations lower than 60 wt.%.
Table 2: Values of parameters selected for the comparison of models
Model points No. of Deviation Std. BiasCorrelation of Eq. (1) 83 90.9 -84.3 Correlation of Eq. (2) 83 46.7 -33.6
Komatsu 83 42.7 -22.0
Adamson 83 50.6 -34.0
Konno 70 30.8 -16.6
The comparison confirms that eq. (1) is markedly conservative with the highest
deviation where the model by Konno has the best performance with deviations of the
order of the experimental uncertainties; see Fig. 4. All models have a negative bias
with the Konno model presenting the less pronounced underestimation. Eq. (2) and
the Adamson model are in fair agreement as they were derived from the same
experimental data. Though being different, Konno and Komatsu are both well−
performing. Noting that the dependence on the plutonium concentration in eq. (2) is
similar to that of Konno, the better performance of the latter could be explained by
the high fraction of the experimental dataset used for its development.
2600 2800 3000 3200 2600 2800 3000 3200
Pred
icted
(K)
Measured (K)
Tachibana [3,8] Komatsu [4,8] Konno [6] Konno [8] Lyon [9] Kato [13] Hirosawa [14] Kato [16] Manara [18]The comparison confirms that the Konno model could be of particular interest
for the code because it considers the presence of minor actinides (americium) and
the saturation of the burn−up effect. Nevertheless, the Komatsu model achieved
results close to the Konno model without limitation in the domain of its parameters. It
could therefore be of interest in case the redistribution under irradiation leads to local
plutonium concentrations above 40 wt.%.
0 20 40 60 80 100 120 0 -20 -40 -60 -80 -100