RICERCA DI SISTEMA ELETTRICO
Valutazioni economiche con validazione-applicazione dei modelli
economico-finanziari
S. Boarin, M. Ricotti, F. Vettraino
VALUTAZIONI ECONOIMCHE CON VALIDAZIONE-APPLICAZIONE DEI MODELLI ECONOMICO-FINANZIARI
S. Boarin, M. Ricotti – CIRTEN, F. Vettraino - ENEA Settembre 2011
Report Ricerca di Sistema Elettrico
Accordo di Programma Ministero dello Sviluppo Economico – ENEA Area: Governo, Gestione e sviluppo del sistema elettrico nazionale
Progetto: Nuovo nucleare da fissione: collaborazioni internazionali e sviluppo competenze in materia nucleare
Responsabile Progetto: Paride Meloni, ENEA
°
CIRTEN
POLITECNICODIMILANO
DIPARTIMENTO DI ENERGIA, Sezione INGEGNERIA NUCLEARE-CeSNEF
*
ENEA
Agenzia Nazionale per le Nuove tecnologie, l’Energia e lo Sviluppo economico sostenibile
Valutazioni economiche con validazione-applicazione
dei modelli economico-finanziari
S.Boarin°, M.E.Ricotti°, F.Vettraino*
CERSE-POLIMI RL-1353/2011
Milano, settembre 2011
Deliverable LP1-F1 (parte “Validazione e applicazione dei modelli economico-finanziari per l’analisi di differenti parchi reattore LWR grande e medio-piccola taglia”) relativo al lavoro svolto in esecuzione della linea progettuale LP1-F1 “Studi di Scenario, valutazioni economiche e partecipazione al Gruppo Internazionale IAEA-NEA Uranium Group” del PAR 2008-09 dell’AdP
LP1-F1 - 2 - POLIMI RL-1353/2011
INDEX
EXECUTIVE SUMMARY... ‐ 3 ‐
1 I NTRODUCTION... ‐ 5 ‐
2 ECONOMY OF SCALE AND ECONOMY OF MULTIPLES... ‐ 6 ‐
2.1.1 Modularization ... - 6 -
2.1.2 Learning ... - 7 -
2.1.3 Multiple units ... - 8 -
2.1.4 Economy of Scale ... - 9 -
3 ECONOMIC CHARACTERIZATION OF SMR... ‐ 9 ‐
3.1.1 Design cost savings... - 11 -
4 R EVIEW OF EXISTING ECONOMIC MODELS AND SIMULATION TOOLS... ‐ 11 ‐
5 INTEGRATED MODEL FOR THE COMPETITIVENESS ANALYSIS OF SMALL MEDIUM SIZED REACTORS... ‐ 14 ‐
5.1 General structure... - 14 -
5.1.1 Generation Cost Model ... - 15 -
5.1.2 Revenue Model ... - 17 -
5.1.3 Financial Model ... - 18 -
5.2 Investment Model – data elaboration and output... - 19 -
5.3 Stochastic scenario simulation tool... - 21 -
6 SCENARIO TEST CASES... ‐ 22 ‐
6.1 Single site simulation: assumptions ... - 22 -
6.2 Country scenario simulation: assumptions ... - 25 -
6.3 Stochastic scenario simulation: assumptions ... - 27 -
7 MAIN RESULTS... ‐ 32 ‐
7.1 Single site simulation ... - 32 -
7.2 Country scenario simulation ... - 38 -
7.3 Stochastic scenario simulation... - 42 -
8 C ONCLUSIONS... ‐ 45 ‐
9 GLOSSARY... ‐ 48 ‐
LP1-F1 - 3 - POLIMI RL-1353/2011
E
XECUTIVES
UMMARYThis document presents the economic evaluation of investment scenarios in NPP of different sizes. The analysis is performed through scenario simulations by means of a proprietary economic and financial model developed by Politecnico di Milano.
Due to the complexity of the analysis, scenario simulations are used as an economic evaluation tool, allowing to consider the interaction of multiple input parameters and boundary conditions on the economics of a nuclear investment project.
This study considers pressurized water reactors of different size, including Small-Medium modular Reactors (SMR). In consideration of the great interest arising by utilities worldwide for SMR and of the design effort by manufacturers worldwide in these new reactor concepts, the focus of this work is on the comparative economic analysis of Large Reactor (LR) plants and SMR. The economic performance of each investment option, LR or SMR, may be evaluated either stand-alone basis or compared basis.
Several models have been developed worldwide to perform the economic analysis of nuclear power generation, but none of them approaches the issue of SMR with their own technical and economic peculiarities. Politecnico di Milano has developed an original model and simulation tool which includes in the analysis the effect of SMR specific features and allows to overcome the bias of the economy loss of the Economy of Scale paradigm.
The model, called INtegrated model for the Competitiveness Analysis of the Small-Medium sized reactors (INCAS), is at the same time a conceptual framework for a comparative economic analysis between LR and SMR and a computational code able to run scenario simulation and quantitative results about key financial performance indicators.
The analysis applies on multiples SMR, compared to a single or multiple LR with equivalent total power installed. The analysis performed provides for a comprehensive set of economic indicators of an investment in a NPP fleet of whatever size in different scenario conditions. It also allows to argue about the economic competitiveness of multiple SMR. This relies on: plant modularization, learning process in the construction and assembling, multiple-units economies on fixed costs, layout simplification and design enhancements fostered by lower output and plant’s size. The former (i.e. modularization) accounts for cost-savings by higher incidence of “serial” factory fabrication; the latter is the effect of cost savings due to smaller amount of components and more efficient layout and supply chain solutions and is synthesized in the so-called “Design saving factor”. Furthermore, shorter construction and pay back times of SMR contribute both to relieve the investment capital exposure: not only SMR are “modular” plants, but also represent a “modular” investment option, with the possibility to stagger the construction schedule of successive units and to invest the cash flows generated by the operation of early deployed units in the construction of additional NPP.
Hence smaller NPP have features that allow to partially compensate for their loss of Economy of Scale and recover economic competitiveness against larger NPP units, with the same installed power.
When deterministic scenario are considered, LR show their basically superior economic performance, based on Economy of Scale and lower overnight construction costs: static values confirm the better financial performance of LR. When scenario conditions become stochastic and uncertainty is included in the analysis, then results are reversed: multiple SMR record higher mean profitability, with more favorable data dispersion toward positive values in right tails.
LP1-F1 - 4 - POLIMI RL-1353/2011
Thus, Montecarlo scenario simulations show that multiple SMR represent a “modular” investment concept that is more able to absorb unfavorable scenario conditions than monolithic LR. On account of their competitiveness with LR in terms of project profitability and on account of their better performance to scenario uncertainty, they may represent a valuable alternative option, not only in small developing areas, but also for extension or replacement of nuclear power plants installed in mature and liberalized large markets.
LP1-F1 - 5 - POLIMI RL-1353/2011
1 I
NTRODUCTIONIn the framework of a renewed interest toward nuclear energy, first-of-a-kind as well as subsequent units of new generation Nuclear Power Plants (NPPs) are currently under construction and planned worldwide, after a break of more than two decades in the US and western Europe.
Nowadays, the issue of economic sustainability and profitability of new NPP projects is controversial mainly due to changed market conditions and liberalization, as compared to the first civil nuclear era.
The decay of experience in plant construction and technological advancements in reactor design play as two opposite factors in the success of nuclear investment projects.
In several countries, nuclear investment projects are left to the initiative of industrial players acting on a liberalized market.
Two of the main decision criteria for investment are the financial risk and the profitability, that are hardly predictable on account of a very extensive investment horizon and of numerous risk sources. The economic soundness of a nuclear investment needs to be assessed against different possible scenario conditions, as a priority step to the investment decision: project simulation may contribute to understand the boundary conditions that make a project affordable and profitable from an economic point of view.
In May 2008, the Italian government confirmed its strong support to the nuclear program and declared that it would foster the construction of first new nuclear power plant within five years, to reduce the country's great dependence on oil, gas and imported power.
The government introduced a package of nuclear legislation including, among others, measures to set up a national Nuclear Safety Agency to oversight the definition of criteria and procedures for reactor plants licensing and nuclear sites identification and licensing.
The comprehensive economic development legislation was finally approved in July 2009 making nuclear power a key component of the new energy policy, with a 25% target of electricity generation from nuclear power by 2030.
A major step in the implementation process was the establishment of the national Nuclear Safety Agency in 2010.
The outcome of June 2011 national referendum was unfavorable to the planned re-introduction of nuclear power, despite the moratorium set over the legislative and regulatory measures which have
LP1-F1 - 6 - POLIMI RL-1353/2011
been taken by the government over the last three years to allow new nuclear power plants deployment.
In line with the government energy strategy, this work has been commissioned with the purpose of exploring the economics of an investment scenario in nuclear power generation and developing an original and valuable model and tool to perform such analysis.
The economic model and simulation tool developed (INCAS) allows to investigate the economics of nuclear power, with particular focus on Small-Medium modular plants and to the comparative performance of modular PWR of different output size.
POLIMI and ENEA have contributed to the research on nuclear economic competitiveness, also within international collaborations, by exploring and modeling the Economy of Multiple paradigm. In consideration of the Italian strategy to re-open the nuclear option, scenario case studies have been already analyzed to assess different NPP deployment options.
The comparative economic performance of different NPP sizes has been approached with a twofold perspective: deterministic and stochastic analysis.
2 E
CONOMY OFS
CALE ANDE
CONOMY OFM
ULTIPLESThe share of investment in total levelized generation cost is around 75% while the other cost elements, O&M costs and fuel cycle costs, represent 15% and 9% respectively [1].
Detailed analysis of this cost category has given a broader understanding of capital costs drivers and has shaped a new concept of “Economy of Multiples”, that applies on multiple NPP deployment. This economic paradigm exploits the economy of replication, capitalizing over:
• design modularization and standardization in order to foster mini-serial factory production, • learning in the manufacturing and assembling phases,
• fixed cost sharing among multiple units deployed on the same site.
This economic paradigm is exploited by smaller NPP to counterbalance traditional “Economy of Scale” low.
2.1.1 Modularization
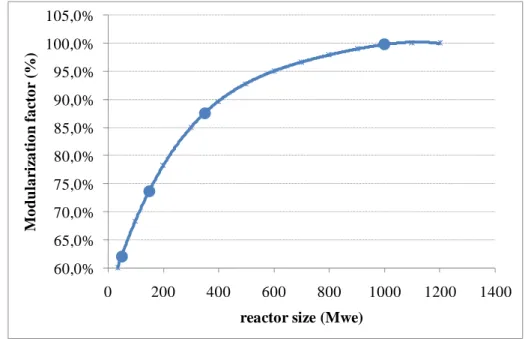
Modularization is modeled assuming capital cost reduction for modular plants, based on the reasonable assumption that the lower the NPP size, the highest is the degree of design
LP1-F1 - 7 - POLIMI RL-1353/2011
modularization; sensitivity analysis suggests to explore a curve with smoother decrease in unit cost below 200MWe (Fig. 1).
60,0% 65,0% 70,0% 75,0% 80,0% 85,0% 90,0% 95,0% 100,0% 105,0% 0 200 400 600 800 1000 1200 1400 M o dular iz a ti o n f a ct o r (% )
reactor size (Mwe)
Fig. 1. Modularization factor model.
2.1.2 Learning
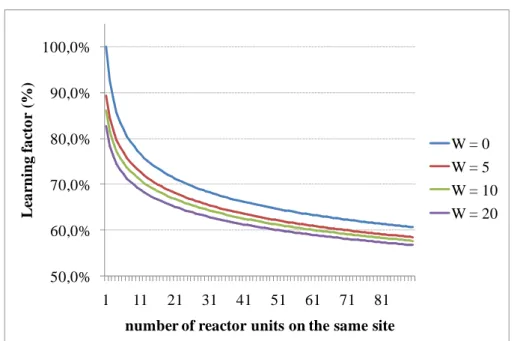
Learning is a two-variable function that calculates construction cost saving factor depending on the number of NPP units of the same type already built on the same site (on-site learning) and worldwide (extra-site learning).
Like GEN IV model for learning calculation, INCAS accounts for learning accumulation in equipment assembling, material handling and human labour.
Learning process in these areas evolves with different pace either the assembling and construction activity is run on the same site or has been previously run elsewhere in the world.
On-site learning on equipment assembling activity allows 6% cost saving at each doubling of power installed; on-site learning on material handling and labour account for 10% and 8.5% cost saving respectively, at each doubling of the power installed.
LP1-F1 - 8 - POLIMI RL-1353/2011 50,0% 60,0% 70,0% 80,0% 90,0% 100,0% 1 11 21 31 41 51 61 71 81 L ear ni ng f a ct o r (% )
number of reactor units on the same site
W = 0 W = 5 W = 10 W = 20
Fig. 2. Learning factor curve, depending on number of NPP already built worldwide (W).
2.1.3 Multiple units
Multiple units saving factor shows progressive cost reduction due to fixed cost sharing among multiple NPP on the same site, until an asymptotic value of 14% for the cost saving factor of the n-th unit. 60% 65% 70% 75% 80% 85% 90% 95% 100% 105% 1 2 3 4 5 6 7 8 9 10 11 12 13 14 15 16 17 18 19 20 C o-si ti n g s avi n g fa ct or ( % )
number of reactor units on the same site
LP1-F1 - 9 - POLIMI RL-1353/2011
2.1.4 Economy of Scale
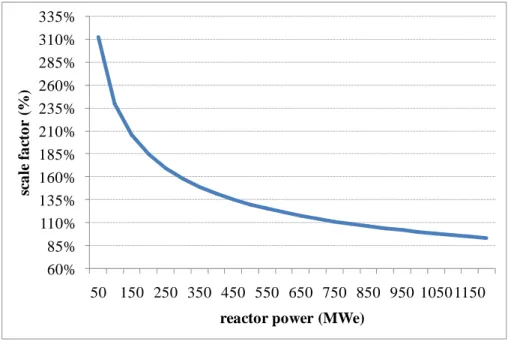
Economy of Scale (EOS, Fig. 4) consist in a decrease of the output specific cost when the plant size increase in terms of output (i.e. electricity), because of lower incidence of fixed costs over the output unit cost. The underlying assumption is that plant of different size are based on the same technology design concept. The EOS curve is modeled through the traditional Eq. (1).
Sf = (PWR2/PWR1)(x-1) (1)
Where PWR2 is the variable reactor power, in MWe, and PWR1 is the size of a reference LWR, in MWe; x = 0.62 is the scale exponent.
60% 85% 110% 135% 160% 185% 210% 235% 260% 285% 310% 335% 50 150 250 350 450 550 650 750 850 950 1050 1150 sca le f a ct o r (% )
reactor power (MWe)
Fig. 4. Economy of Scale model.
3 E
CONOMIC CHARACTERIZATION OFSMR
Small-Medium size Reactors (SMR) come to the scene where plants’ size maximization has been pursued by the nuclear industry since the beginning of the nuclear civil era [2]. “Deliberately small reactors” do not represent shift backwards to the small scale of first commercial reactors nor a mere “scale-down” of current innovative LWR designs. They are designed to foster modularization, simplification and multiple-units deployment on the same site. They are developed by designers and manufacturers worldwide (SMART, mPower, Nuscale, etc.) and are also intended to address mature electricity markets, thus competing with large scale plants.
The idea of an economic attractiveness of Small and Medium sized LWR (SMR) is counterintuitive, due to the loss of Economy of Scale on a capital intensive investment. Nevertheless by exploiting
LP1-F1 - 10 - POLIMI RL-1353/2011
the Economy of Multiples, that applies on multiple NPP deployment, they are able to smooth the loss of EOS impact. As a result, Small and Medium LWR capitalize over the operating track-record of LWR technology and exploit the economy of replication and further design enhancements available to the small scale.
SMR concepts challenge the Economy of scale paradigm, while offering innovative features in term of design modularity, passive safety and simplification [3]
Furthermore, smaller plants may represent a scalable investment with the construction of successive units diluted over a suitable timeframe. SMR shorter construction / pay back times may relieve the investment capital exposure.
When multiple, staggered NPP are built, cash flows generated by the operation of early deployed units may be invested in the construction of additional NPP. Project’s self-financing may limit the up-front investment.
In addition to the above-mentioned arguments, the strong interest for SMR may be explained by the fact that for some investors capital investment effort in big generating units may even be unaffordable: capital-at-risk and up-front investment need to be curbed either by smaller utilities in developed and liberalized markets, either by state-owned operators of emerging countries.
In USA and Europe, the so-called “nuclear renaissance” takes place in liberalized and competitive market scenarios, as compared to the first nuclear commercial era. Utilities’ management is compelled to take cost-effective decisions and comply to the laws of financial markets. Investment strategies have to be optimized with respect to limited financial resources; investment risk has to be edged by diversified investment portfolios.
Investments in nuclear power generation are very capital-intensive projects, with very long pay-back times: on account of this, they present a risky profile as compared to the short-term needs of private operators.
In this context, SMR are not only suitable for remote and isolated user communities, or small markets with smaller electricity grids; they also represent a suitable investment option for developed markets’ private utilities that are not willing to “bet the company” on a single capital intensive project.
LP1-F1 - 11 - POLIMI RL-1353/2011
3.1.1 Design cost savings
As said in par 2.1.4, EOS low assumes that plants of different size are still based on the same design technology. This is not often the case: lower plant size allows for new technology solutions and enhancements that make plant of different size not comparable on the same EOS curve.
In the case of NPP, SMR are supposed to introduce design enhancements and simplifications, smaller amount of components and more efficient layout and supply chain solutions, that translate in significant construction cost savings and are represented by a “Design saving factor” to be applied on overnight construction cost base.
Such cost savings are strictly reactor type-dependent and should be calculated through a bottom-up cost estimation to account for the specific reactor design information. When detailed information is not available, specific saving factors has to be estimated on the basis of expert elicitation.
Design saving factor is a sensitive parameter because it has a significant incidence on overnight construction costs (it might account for 5-20% of overnight cost base) and therefore on the overall economics of the investment project.
This study offers an approach to the analysis of design saving factor where it is assumed as an output variable of the model: it is estimated in order to bring the economic performance of different plant sizes in line with the profitability of a large reference 1,000MWe NPP fleet, with the same total power output.
As a consequence, this study provides a useful estimation of what design enhancement degree should be the for each SMR size to be economically competitive with the reference 1,000MWe LWR.
Then, rather than an arbitrary input, the degree of design enhancement and simplification necessary to make SMR competitive with LR represents a sort of “target” design cost-saving factor to attain in the plant concept engineering.
4 R
EVIEW OF EXISTING ECONOMIC MODELS AND SIMULATION TOOLSSeveral codes are increasingly used today for assessment studies, including some economic features, as reported in Table I. The codes usually simulate the integrated nuclear energy system of reactors and fuel cycle/waste management facilities on global, regional or national/local scale, providing the quantitative mass flow exchanges. The kernel for all analyses is based on dynamical Mass-Flow Analysis (MFA) simulation. Their capabilities in facing non-standard reactor economics is limited, in several cases.
LP1-F1 - 12 - POLIMI RL-1353/2011
The class of currently available dynamic simulation codes, more suited for economic and financial analysis of reactors deployment, as listed in Table II, cover indeed a comprehensive set of applications. Some tools devoted to market simulation, supported by IAEA (e.g. MAED, WASP, MESSAGE, GTMAX), provide energy planners with the assessment of different market penetration strategies for nuclear energy, to define the appropriate mix of fossil, renewable, and nuclear energy supply assets. Other sustainability assessment model-tools are specifically intended to address various areas, such as safety, environmental (e.g. SIMPACTS), proliferation resistance, economics (e.g. FINPLAN, SEMER) and apply to different generating technologies.
Economics is hence investigated as a “sustainability” concern and simulation tools aim to calculate both the investment needs for reactor and fuel cycle facilities and the resulting levelized electricity generation costs. The software simulation tools dealing with the economics of power generation fall into two main categories: energy supply market modelling and simulation of power generation investment projects. Among the latter, most of the available codes are traditionally focused on generation costs, with Levelized Unit Electricity Cost (LUEC) being the main output and economic indicator.
Only a few codes (DANESS11, FINPLAN12 and INCAS13) involve a dynamic cash flow analysis. An economic model (INCAS - INtegrated model for the Competitiveness Assessment of SMR) has been developed by Politecnico di Milano university able to perform an investment project simulation and evaluation and suitable to compare the economic performance of SMR with respect to Large Reactors (LR).
It was born within an international research effort fostered by IAEA on SMR competitiveness. This “pilot” version has afterward been developed in order to be able to simulate country scenarios’ investment analysis.
INCAS provides monetary indicators of financial performance (e.g. IRR, LUEC, total equity employed) and is conceived to combine them with not-monetary indicators (e.g. design robustness, required spinning reserve).
The original contribution of INCAS, in the synopsis of the economic simulation codes, is the capability to address the specific economic features of SMR deployment, capturing the so-called “Economies of Multiples” that counterbalance the loss of economies of scale when compared to Large Reactors (LR).
LP1-F1 - 13 - POLIMI RL-1353/2011 Code / Developer Capabilities COSI CEA (FRA) DA NES S ANL ( US A) DES A E UN K (Rus sia) DY M ON D ANL ( US A) NFCSim LAN L (US A ) ORI ON NEX IA ( U K) OSIR IS NNC ( U K ) PROGNOS IS K u rchatov & Min atom (Russia) Su perSta r Tepc o ( JA P ) VIS T A IAE A Equilibrium Analysis
Single Reactor 9 - all -
Reactor Park 9 - all -
Dynamic Analysis
Regional Reactor Park 9 9 9 9 9 9 9 9 9 9
Multi-Regional Reactor Park 9 9 9 9 9 9 9
Mass-flow analysis
Natural U/Th use 9 - all -
Front-end capacity needs & use 9 - all -
Reactor core loading 9 - all -
Back-end capacity needs & use 9 - all -
Separated material inventories 9 - all -
Disposal needs 9 - all -
Related functionalities
Isotopic composition 9 - all -
Decay heat 9 - all -
Reactor core management 9 9 9 9 9 9 9 9
Economics
Levelized generation cost 9 9 9 9 9 9
Investment needs 9 9 9 9 Cash-flow Analysis 9 Waste Management Repository impact 9 9 9 9 Socio-political issues Proliferation risk 9 Availability Freeware 9 9 License agreement 9 9 9 9 9 Commercial 9 9 9
Tab I. Synopsis of integrated nuclear energy systems simulation codes
Code / Developer Available models COSI CEA (FRA) DA NES S ANL ( US A) DES A E UN K (Rus sia) FIN P L AN IAE A GT MA X IAE A INC A S POL IMI (ITA) MA ED IAE A MES SA G E IAE A ORI ON Nexia ( U K ) OSIR IS NNC ( U K ) PROGNOS IS K u rchatov & Min atom (Russia ) SEMER
CEA (FRA) SIMP
ACTS
IAE
A
WASP IAE
A
Generation cost model 9 9 9 9 9 9 9 9 9
Market model 9 9 9 9
Investment model 9 9 9
LP1-F1 - 14 - POLIMI RL-1353/2011
5 IN
TEGRATED MODEL FOR THEC
OMPETITIVENESSA
NALYSIS OFS
MALLM
EDIUM SIZED REACTORS5.1 General structure
INCAS economic model is based on a Polimi’s consolidated research activity on the economic features of small-medium sized, modular reactor plants, with the participation to international consortium for the development of the IRIS (International Reactor Innovative and Secure) reactor plant concept.
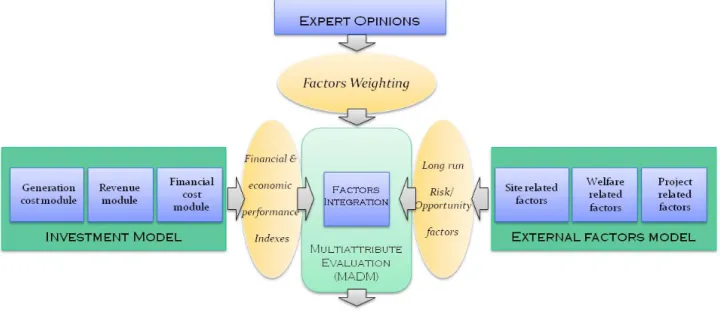
The general architecture and development strategy of INCAS code is summarized in Fig.1.
Fig. 5. General architecture of INCAS code
INCAS’ Investment Model is a simulation code developed in Matlab that is able to perform the financial simulation and analysis of an investment case in a NPP fleet on a multi-site scenario. It is based on a Discounted Cash Flow model and provides a full set of indicators of the investment’s financial performance (e.g. IRR, NPV, cash flow profile, debt duration, PBT, etc). The “External Factors Model” deals with factors usually not included within the investment evaluation (e.g. security of fuel supply, public acceptance, environmental impact), because they are not under direct control of the investor or they are hardly quantifiable. Nevertheless they strongly influence the life cycle and the feasibility of the project itself. Financial and External Factor model’s outputs are then combined through a Multi-Attribute Evaluation process in order to define the overall attractiveness’ score of an investment scenario.
LP1-F1 - 15 - POLIMI RL-1353/2011
The “External Factors Model” is currently under construction. To activate the MAE process an expert elicitation is needed in order to set the priority of attribute of different nature.
5.1.1 Generation Cost Model
Generation Cost Model calculates construction costs and operating costs, including Operation & Maintenance (O&M), fuel cycle and Decontamination & Decommissioning (D&D), for each NPP plant in each time-period of the scenario.
Unlike other simulation codes, INCAS’ Generation costs model is not a mere input section of the code: an original calculation routine allows to derive the construction costs of a specific NPP on the basis of a “top-down” estimation approach. Considering that data records on construction costs for advanced PWR are not available, the cost of a specific NPP is estimated from a reference, first-of-a-kind PWR of a given size. For a given scenario, with its specific investment schedule in terms of site collocation of plants and construction timing, INCAS calculates construction costs of each successive NPP unit of the fleet, by applying corrective factors that account for economy of scale, learning efficiency, modularization effects, co-siting economies and design-related savings. INCAS’ premise is that the cost of “n” NPP units is not equal to “n” times the cost of one NPP. Learning and co-siting economies are determined by the construction schedule and strategy, while design-based savings and modularization are related to the plant size.
In particular the code takes into account:
• learning economies, both at single site level and worldwide, with two different learning accumulation and decay laws;
• design modularization savings on construction costs;
• co-siting economies, due to fixed costs sharing by multiple units built and operated on the same site;
• economies of scale;
• design simplification and enhancements’ impact on overnight construction costs.
Reference construction cost is therefore adjusted by mean of capital cost factors that account for the above-mentioned benefits, through suitable cost saving factors.
LP1-F1 - 16 - POLIMI RL-1353/2011
Fig.6 INCAS’ top down estimation pattern for SMR overnight costs’ estimation
All of the above mentioned cost factors have been modeled on the basis of open literature values and implemented in the INCAS code, with the exception of design saving factor. As said in par 3.1.1, such saving factor account for technology simplifications and enhancements made possible by lower plant size and have to be provided to the model on the basis of expert elicitation.
Specific parameters ϑi are calculated and applied to the construction cost of a reference LR in a way
that the construction cost of a smaller size NPP is scaled from it, through the following equation:
(2)
(
(
)
)
ES l CS M D LR LR LR World LR n LR C SMR SMR SMR World SMR n SMR C D M N N S OCC D M N N S OCC ϑ ϑ ϑ ϑ ϑ δ = = × × × × , , , , , , , , , , , ,where ϑES, ϑl, ϑCS, ϑM and ϑD are the factors related to Economies of Scale, learning, co-siting,
modularity and design features, respectively; OCCC, S, Nn, NWorld, M and D are the Overnight
Construction Cost (€/kWe), the reactor size (MWe), the number of units of the same type built on the same site and built in the world, the degree of modularity and the innovative design solution
feature, characterizing the power plant. The overall construction cost scaling factor δ for the SMR
against the LR, is then obtained by multiplying the ϑi parameters.
By a special “Advanced” user-input section INCAS offers the user the option to intervene in the cost saving factors modelling, overriding the default settings with specific, proven information.
LP1-F1 - 17 - POLIMI RL-1353/2011
The overnight construction cost calculated as above, is spread over a construction schedule time period following a traditional “S-curve” for cumulated expenses.
Over this period, specific cost escalation rate is applied to overnight capital cost to account for specific inflation rate on the reactor plant construction inputs (i.e. structural materials, labour..), that might grow with annual rates different from general inflation, following specific price dynamics, usually correlated to the energy price.
Finally, construction schedule overruns are translated into cost overruns that grows linearly with time-delay.
Operation and Maintenance and fuel unit costs are given to the model as an input by the user. It might be assumed that O&M cost of different sized NPP are influenced by multiple-units economies, EOS and fuel cycle length and that fuel cost may differ depending on the enrichment level. A quantitative model of these costs will be offered by further development and refinement of INCAS code. D&D unit costs are inputed by the user as well and represent an annual cash outflow that increases a specific segregated fund. Available information on D&D expenses highlights a clear dependence on EOS and on multiple units factor. Nevertheless as of today a quantitative model for the estimation of this cost item is not provided by INCAS and will be included as well in the code’s further development.
5.1.2 Revenue Model
The purpose of the Revenue Model is to forecast electricity demand and market prices in order to estimate future annual cash in-flows. Some of the elements that could enter into such a model are:
• The electric capacity already installed;
• The degree of competitiveness among the suppliers on the market; • The mix of energy technologies for electricity production;
• The electrical grid structure and capability;
• The space-time trends of the demand for electricity; • The adopted competitive strategy for new power plants.
The output of the revenue model are total revenues at the plant level over the economic plant lifetime, i.e., estimates of the total inward cash flows. The revenues R [Euro] are a function of the country- or local-level electricity consumption Q [MW(e)-hour], the market price p
[Euro/MW(e)-LP1-F1 - 18 - POLIMI RL-1353/2011
hour] or the market structure drivers MS1, the plant size S [MW(e)], the specific reactor technology
T (e.g., whether the reactor is a large reactor or a SMR), and a set Y of other variables:
(3) R=R(Q,por MS,S,T,Y)
The Y inputs include the load factors, the national electrical grid and the front-end investments. A detailed electricity market simulation model is beyond the scope of INCAS; this input information is necessarily country-dependent, in order to acknowledge the specific market structure and players (i.e. market pools, etc.).
Built as a modular model, INCAS may be interfaced with appropriate market model and use their output (i.e. long-term forecasted electricity price and power output demand) as an input for its elaboration.
In its stand-alone version, INCAS elaborates a simple, linear Revenue Model to feed the Investment Model.
5.1.3 Financial Model
The purpose of the financial model is to evaluate the cost of invested capital. For any project, weighted average cost of capital (WACC) could be calculated by means of the well known formula:
(4)
( )
E D D t K E D E K WACC e d + − + + = 1where the necessary inputs are:
• Equity amount (E) invested in the project;
• ratio of Debt to Equity (D/E) for the company, enterprise or organization’s investment;
• rate of return required by shareholders for the equity (Ke), which is the cost of equity;
• interest rate required by debt holders (Kd);
• tax rate (t).
Because NPP projects with smaller reactors are generically more scalable2 and reversible, they may
allow for better investment timing and smaller capital outlays, resulting in lower project risk. This in turn, may account for lower debt interest rates and allow for higher use of financial leverage.
1 MS include total installed capacity, reserve margin, supply mix, concentration indexes and market shares, spot power
exchange versus long-term bilateral contracts, etc.
2
LP1-F1 - 19 - POLIMI RL-1353/2011
Cost of capital also depends on the investment model, either project financing or corporate finance: in the first case cost of capital should represent the project specific financial risk, in the second case financial risk could be endorsed and mitigated by general credit rating of the investor and granted by its overall cash-inflow portfolio. Other things being equal, project financing is generally represented by higher capital cost than corporate finance and, without particular guaranties or contractual agreement able to reduce the project risk, it may simply be unviable. Such consideration have to be included in the cost of capital assumptions.
On the basis of the cost of capital and the financing mix, the DCF model accounts for the time value of money, calculating the Interest During Construction (IDC) on financial debt: IDC represent a relevant part of total capital investment. Interest expenses during construction period are capitalized in the amount of loan outstanding; thus, construction period is assumed to be a sort of “grace period” and IDC do not represent an actual cash outflow, but they are due to lenders and increase the debt stock amount. Actual interest payment starts with commercial operation of the plant.
5.2 Investment Model – data elaboration and output
The INCAS code is able to calculate the full set of accounting values for each reactor plant at each time-step: the accounting values are classified in the three main financial prospects indicated in the following table: PROFIT&LOSS revenues O&M costs fuel costs D&D depreciation EBIT interest expenses interest earnings tax NET PROFIT
CASH FLOW STATEMENT
(-) EQUITY INVESTMENT (+) EBIT (+) DEPRECIATION (-) TAX (+) INTEREST EARNINGS (-) INTEREST EXPENSES
(-) DEBT PRINCIPAL AMORTIZATION FREE CASH FLOWS
BALANCE SHEET: NET ASSETS
CASH EQUITY DEBT
Tab.III Financial prospects elaborated by INCAS
Profit&Loss (P&L) and Cash Flow (CF) statements refer to the current period values, while Balance Sheet (BS) deals with cumulated stocks of values.
P&L considers costs and revenues that are of competence of current fiscal period, while Cash Flow statement considers actual and effective cash outflows and inflows
LP1-F1 - 20 - POLIMI RL-1353/2011
INCAS calculates the set of three financial statements (Profit & Loss statement, Cash Flow statement and Balance Sheet) at each NPP level; then, all the financial statements of the whole NPP fleet are consolidated to calculate global key financial indicators. Thus, these indicators are representative of the whole investment case:
• Internal Rate of Return • Net Present Value • LUEC
• PBT
Each of the above mentioned output will refer to the NPP fleet investment project as a whole.
Net Present Value is the sum of all cash out-flows and in-flows, discounted by an appropriate rate that represent the cost-opportunity of the capital employed. Thus NPV is a decreasing function of the discount rate. If a discount rate is set, the corresponding NPV is to be considered as the excess value earned above the capital remuneration represented by the discount rate itself.
It means that if a 10% discount rate is assumed and 100M€ NPV is calculated, the investment project is able to generate 100M€ on top of 10% remuneration rate on the investment costs.
As far as shareholders’ NPV is considered, the cumulated value of all the free cash flows is actualized with the cost of equity and represents the excess value generated by the investment project on top of the remuneration set by the user as the “cost of equity”.
An NPV = 0 does not mean that the investment is not profitable, but it means that the capital investment remuneration is exactly equal to the discount rate applied in the cash flow actualisation. Internal Rate of Return (IRR) is the key parameter that measures an investment profitability and is defined as the discount rate that breaks even the NPV.
IRR is the discount rate that balance all actualised cash out-flows (capital investments, operating, financial costs…) and in-flows (revenues...) and represents the specific rate of return of the investment project. It means that if a 12% IRR is calculated, the project is able to generate a 12% remuneration on capital investment.
Similarly, Levelized Unit Electricity Cost (LUEC) is the electricity price that breaks even NPV calculation, meaning the minimum sale price that allow investors to recover their capital invested + a capital remuneration represented by the discount rate applied to the NPV calculation. Thus the LUEC is a function of the discount rate, with a positive correlation: the higher the capital investment remuneration required , the higher is the electricity sale price that allow to earn such remuneration.
LP1-F1 - 21 - POLIMI RL-1353/2011
IRR and LUEC are calculated iteratively as the discount rate and electricity sale price, respectively, that break even the NPV of the investment project:
(5)
∑
(
(
)
)
+ = = t t price t IRR ee CF NPV 1 0 (6) = =∑
(
+(
)
)
t e t t K LCOE CF NPV 1 0where CFt is the cash flow of year t, which is function of the electricity price eeprice, while Ke is the
cost of capital (Equity).
In addition to the above mentioned indicators, INCAS provides information for an holistic investment financial appraisal, such as: capital at risk, capital structure ratios (e.g. Debt-to Equity, maximum debt outstanding, debt cover ratio, debt duration), cash flow profile, interest cover ratio, etc.
INCAS is particularly devoted to the assessment of the nuclear investment project risk and profitability, as a feasibility requirement for the nuclear investment. It is therefore conceived as a dynamic simulation tool to test the boundary conditions allowing to meet a target project profitability; LUEC is then calculated with respect to the scenario input settings. Sensitivity analysis may be performed on each input variable.
Moreover, the Investment Model’s dynamic cash flow analysis is able to capture the “self-financing” feature, a financial phenomenon typical of modular investments. It represents the capability of the project to finance itself, by re-investing the cash inflows from the early deployed NPP’s operations into the later NPP units’ construction.
If any positive free cash flow exists for a NPP, after covering debt obligations, it is diverted to cash-deficit NPPs under construction, at an extent defined by the user (from 0% to 100%), the rest being earned as "shareholders’ dividends”. That gives the shareholders the option to reduce the up-front equity investment effort, re-investing self-generated equity resources in the project, at an appropriate IRR.
Self-financing may represent a relevant financing source for staggered, modular investments in multiple NPP, that makes a project financially affordable by investors with limited up-front investment capabilities.
5.3 Stochastic scenario simulation tool
INCAS Matlab code is currently based on a deterministic approach to data input and elaboration. In order to simulate stochastic investment scenarios, an Excel-based version of INCAS has been
LP1-F1 - 22 - POLIMI RL-1353/2011
generated, which reproduces the same data processing rules of the Matlab code. Then Excel code is combined with @RISK5.5 software for Montecarlo simulation. Nevertheless, due to PC data processing constraints face to the complexity of calculations and iterations, the Excel version of INCAS is able to run a Montecarlo simulations in an acceptable time-frame on a single site scenario deployment only. To bypass this limitation the Matlab version of the code is being upgraded in order to account for stochastic distribution of input and run Montecarlo simulation on NPP fleet at multi-site level.
6 S
CENARIO TEST CASES6.1 Single site simulation: assumptions
Nuclear investment presents very high risk profile that relates to the exceptionally extended time horizon of the project and to possible changes in investment environment conditions during this time horizon. Cash flows expectation is potentially undermined by possible regulation changes, reactor operation underperformance, electricity market downturn. If risk allocation countermeasures are undertaken, a nuclear investment project may enhance its level of dependability for receipt by a bank, financial attractiveness hence global viability.
Investment environment conditions may play a relevant role in the investment economic performance. In particular public support may intervene to relieve financial pressure through financial backing of debt or tariff support mechanism, caps on D&D liabilities, etc. These support mechanism are sensitive in a liberalized market environment and more easily implemented in emerging market state-controlled economies.
The level of risk allocation and the main economic features of the energy market environment may affect in a significant way a nuclear investment. To investigate different scenario conditions for nuclear power plant deployment, simulation scenarios have been set related to a “Merchant” business case, based on the rules of the liberalised electricity and capital markets, and a “Supported” business case, where special risk-mitigation policies and conditions are set in place.
These scenarios case studies are defined and tested with INCAS, at single site level on a single LR or 4 equivalent SMR, with same total power output. These test cases allow to investigate the specific performances of LR and SMR under the two different economic scenario environments. The scenario key features are summarised in Table IV.
Oilkiluoto3 South Texas
Project INCAS “Supported” business case INCAS “Merchant” business case
LP1-F1 - 23 - POLIMI RL-1353/2011
Debt interest rate
(Kd) 2.6% 5% 5% 7%
State guarantees 28% on total debtI up to 80% of total construction costII
up to 50% of total
construction cost no
Financing mix 20% equity
80% debt 20% equity 80% debt 20% equity 80% debt 50% equity 50% debt[4-6]
Market risk long-term electricity sale contracts at fixed priceIII
89% of power output sold through
long-term contracts
long-term electricity
sale contracts sale at spot price
Cost of equity
capital (Ke) 0% not disclosed 10% 15%
EPC type of contract Turn-key No target price with
incentives on cost basis
Tax rate 0% (non-profit) 18 $/MWh tax credit
on first 8y operation 30% 30% Financing scheme 20% equity; 5% corporate financing; 75% project financing Na Project Financing Corporate Financing
Tab.IV Financing data from case studies and for INCAS test cases.
I - € 610M export credit from French State-COFACE to TVO; € 100M by AB Svensk Exportkredit-SEK. II - on bank loans, standby insurance for regulatory delays.
III - at cost-price basis, estimated to be less than 25 €/MWh.
The “Supported” case is derived from the analysis of two case studies: Olkiluoto3[7] in Finland and South Texas Project[8-11] in the USA.
Both deployments have been structured in project financing, with TVO electric utility being the special purpose vehicle of the NPP investment in Olkiluoto.
The Olkiluoto case study represents a non-profit power generation business case, where a shareholders’ cooperative consortium will off-take the power output through long-term electricity sale contracts at cost-price.
This configuration is able to offset long-term market risk. Although capital remuneration and project profitability are not strictly required by shareholders in this business case, but mainly invested capital recovery, nevertheless they still represent key economic factors in the scope of the analysis, with nuclear electricity being either a production input for energy-intensive industry or an intermediate good to be sold to local municipalities by the shareholders.
In the South Texas Project, market risk mitigation and public guarantee on banks’ loans allow for low capital costs.
LP1-F1 - 24 - POLIMI RL-1353/2011
In the “Supported” case, a target 10% shareholders’ capital remuneration rate is assumed to justify a lower entrepreneurial business risk, while in the “Merchant” case the nuclear investment project is left to the laws of the free market of capital and power generation.
Hence both shareholders and lenders will require much higher capital remuneration to cover long-term business risk and banks will ask for tighter loan covenants.
This might increase, in turn, the probability of financial default, while decreasing shareholders’ profitability to an extent that project financing scheme would not be viable.
For this reason the financing nuclear project in “Merchant” environment is assumed to be possible only through corporate financing, with nuclear business risk being diluted on a diversified business portfolio of shareholders and with shareholders’ assets to guarantee bank loans.
On the basis of a recent study[12] assuming 8% interest rate on debt for “Merchant” case project financing, a conservative 7% interest rate on-balance sheet financing is assumed for INCAS test case, for corporates with less than 50% of nuclear power business.
As far as construction and operating costs are concerned, the assumptions for LR and SMRs deployment to be used in INCAS test cases are based on the latest literature reported in Table V.
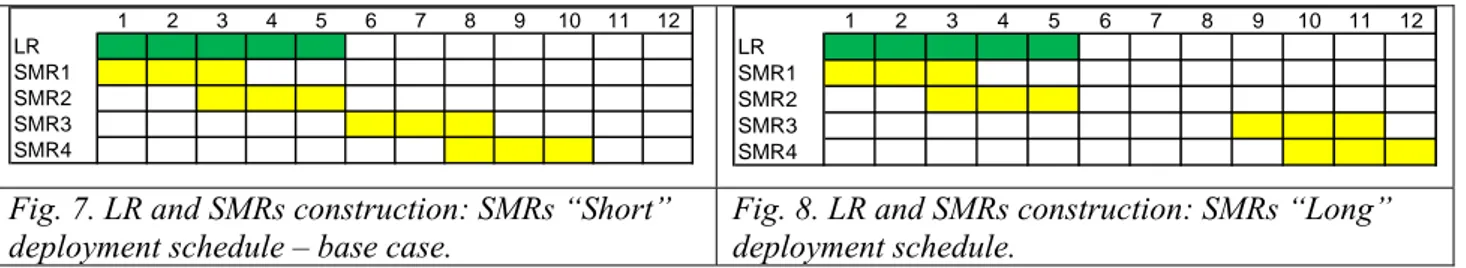
Deployment schedule are illustrated in Figure 7 and 8, the financial data (Table IV) and the scenario data (Table IV) have been identified, the test cases involving alternative LR and SMRs investment projects are simulated with INCAS and compared.
To investigate the calculation output sensitivity, a parametric analysis has been carried out, with values ranging on a (-10%; +10%) basis with respect to base values.
1 2 3 4 5 6 7 8 9 10 11 12 LR SMR1 SMR2 SMR3 SMR4 1 2 3 4 5 6 7 8 9 10 11 12 LR SMR1 SMR2 SMR3 SMR4
Fig. 7. LR and SMRs construction: SMRs “Short” deployment schedule – base case.
Fig. 8. LR and SMRs construction: SMRs “Long” deployment schedule.
LP1-F1 - 25 - POLIMI RL-1353/2011 Input LR base value SMRs base value
Rationale and Bibliographic ref.
Plant operating
lifetime (years) 60 60
Same technology enhancement and reliability19 assumed for LR and SMRs.
Estimated
construction period (years)
5 3
LR total construction time considering the most common LR design installed worldwide.23-28 Reduced construction time for deliberately SMRs due to reduced size and assuming design simplification [13-15]. Overnight construction cost ($/kWe) 4000 4284 (average)
LR value [12] assumed as conservative with respect to recent estimations [13, 16-20], while as optimistic with respect to recent contracts [21]. SMRs capital cost estimated from LR capital costs [3].
Operation and Maintenance cost ($/MWh)
9 10.8
LR cost assumed considering a deep investigation for US reactors [22] (conservative value since O&M cost for new NPP should be lower than previous generation reactors, due to design simplification and passive safety features [23]). SMRs O&M cost estimated from LR cost [24] (SMRs to LR ratio = 1.2x).
Fuel cycle cost
($/MWh) 6.7 6.7
Conservative estimation [4] assumed, as compared with other studies [5,6,25-28]. Decontamination & Decommissioning sinking fund ($/MWh) 3 5.9
A fee of 2 €/MWh is assumed as reasonable for LR, according to a thorough survey on decommissioning cost [29]. SMRs
decommissioning cost estimated from LR cost [30,31] (SMRs to LR ratio = 2x).
Inflation (yearly %) 2% 2% Average inflation rate for developed countries assumed [32].
Wholesale eeprice
USA ($/MWh) 57.2 57.2
Average wholesale electricity price by NERC Region, 2001-2007 assumed [33].
Plant availability 93% 95% Assumptions based on estimations for GenIII/GenIII+, LR [34] and SMR [35] examples.
Tab V Scenario reference data for INCAS test cases.
6.2 Country scenario simulation: assumptions
Multiple site scenario simulations have been run to assess economic performances of different NPP plant sizes. The same total power output is deployed by means of NPP fleets of different size:
• Very Large Reactors (VLR, 1500MWe) • Large Reactors (LR, 1000MWe)
• Medium Reactors (MR, 350MWe) • Small Reactors (SR, 150MWe) • Very Small Reactors (VSR, 50MWe)
LP1-F1 - 26 - POLIMI RL-1353/2011
Total nominal power of 9GWe (8,100MWe generation capacity) is assumed to be deployed in 15 years on 3 sites, by mean of multiple NPP of different LWR sizes.
We consider a site maximum size of total 4,500MWe and a “small site” of 1,000MWe to represent the situation of a country with large availability of land, resources for site-cooling and power grid capacity, and an emerging power market or a country with a high density of population and limited grid capacity, like Italy.
It has to be highlighted that VLR may not be deployed on small 1,000MWe site scenario.
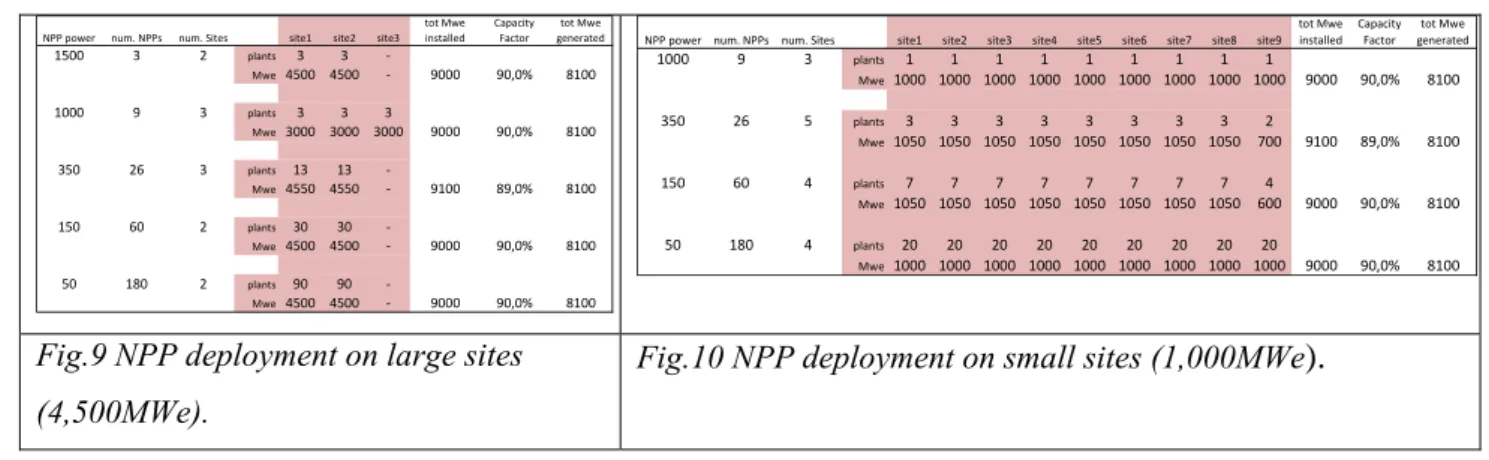
Total power installed is attained through the deployment of a different number of NPP on a different number of sites, depending on the plant size (Fig. 9 and Fig. 10).
NPP power num. NPPs num. Sites site1 site2 site3 tot Mwe installed Capacity Factor tot Mwe generated 1500 3 2 plants 3 3 ‐ Mwe4500 4500 ‐ 9000 90,0% 8100 1000 9 3 plants 3 3 3 Mwe3000 3000 3000 9000 90,0% 8100 350 26 3 plants 13 13 ‐ Mwe4550 4550 ‐ 9100 89,0% 8100 150 60 2 plants 30 30 ‐ Mwe4500 4500 ‐ 9000 90,0% 8100 50 180 2 plants 90 90 ‐ Mwe4500 4500 ‐ 9000 90,0% 8100
NPP power num. NPPs num. Sites site1 site2 site3 site4 site5 site6 site7 site8 site9 tot Mwe installed Capacity Factor tot Mwe generated 1000 9 3 plants 1 1 1 1 1 1 1 1 1 Mwe1000 1000 1000 1000 1000 1000 1000 1000 1000 9000 90,0% 8100 350 26 5 plants 3 3 3 3 3 3 3 3 2 Mwe1050 1050 1050 1050 1050 1050 1050 1050 700 9100 89,0% 8100 150 60 4 plants 7 7 7 7 7 7 7 7 4 Mwe1050 1050 1050 1050 1050 1050 1050 1050 600 9000 90,0% 8100 50 180 4 plants 20 20 20 20 20 20 20 20 20 Mwe1000 1000 1000 1000 1000 1000 1000 1000 1000 9000 90,0% 8100
Fig.9 NPP deployment on large sites (4,500MWe).
Fig.10 NPP deployment on small sites (1,000MWe).
Deployment schedule is simulated to attain a uniform power installed rate over the period on each site.
SR and VSR units are considered as stand-alone NPP able to operate individually and independently each other: this assumption is questionable if the need of common civil work infrastructures is considered and the option to serve with the same turbine generator a block of multiple nuclear islands.
Electric power installed rate results as in Fig. 11 and Fig. 12.
Fig. 11 Electric power installed rate on large sites (4,500MWe)
Fig. 12 Electric power installed rate on small sites (1,000MWe)
LP1-F1 - 27 - POLIMI RL-1353/2011
Overnight construction costs are assumed in the range of 3,000-5,000€/kWe for a FOAK LR of 1,000MWe and scaled for SMR through the application of appropriate capital cost factors (par.5.1.1). Design saving factors have been considered as output results, in order to appreciate the target degree of design enhancement to put SMR economic performance in line with LR.
Assumptions on specific reactor data and on investment scenarios are summarized in Tab. VI and Tab. VII. Reactor VLR LR MR SR VSR Power [MWe] 1,500 1,000 350 150 50 O&M [€/MWh] 9.5 9.5 11.4 11.4 11.4 Fuel [€/MWh] 5.5 5.5 5.5 5.5 5.5 D&D [€/MWh] 1.4 1.4 2.8 3 3
Constr. duration [y] 5 4 3 3 2
Cost of Equity [Ke, %] 15
Financing mix [E/(E+D), %] 50
Debt amortization period [y] 15
Cost of Debt [Kd, %] 8
Constr. costs escalation [%/y]
2
Inflation [%/y] 1.6
Electricity price [€/MWh] 70
Electricity price increase [%/y]
2
Depreciation fixed assets [y] 12.5
Tab VI Reactor-specific assumptions Tab VII Investment-specific
assumptions
6.3 Stochastic scenario simulation: assumptions
Nuclear investments may represent a relevant industrial, economic and financial risk for investors, especially for those acting in liberalized markets of energy and capital. Main risks for industrial operators and merchant banks may be summarised in unpredictable cash flows over exceptionally extended project lifetime, on account of the lack of consolidated information and experience on both construction costs and operating performance and economics of new generation reactors.
Scenario conditions and input parameters to the economic evaluation of a nuclear investment project are affected by uncertainty.
Some of them are able to produce a relevant impact on project profitability. Among these most sensitive parameters, there are construction costs.
Construction costs may be heavily affected by delay in the construction period. Construction costs and time overruns are an upmost feared event that is able to undermine the investment financial performance. Wide literature [36;37] approaches the impact of such delays on the economics of nuclear investment; construction costs show a significant cost escalation during construction delay. The scale of the impact is particularly evident in Olkiluoto and in Flamanville projects [7;38;39].
LP1-F1 - 28 - POLIMI RL-1353/2011
Construction duration of successive SMR modules normally reduces on account of improved assembling, construction and supply chain practice: this is the effect of learning accumulation that is accounted by INCAS model’s “learning” curve and applied to successive NPP units as a cost saving factor.
Longer construction schedule due to lack of learning in first units does not represent unexpected delay events, which deal more with external factors, independent from fabrication, logistic and assembling usual practice.
Delays may come from unexpected supply-chain drawbacks or unplanned intervention of Regulator or external events of political nature or even natural catastrophes.
In this simulation work the effects of unexpected delay on construction costs are analyzed.
The uncertainty over other relevant input variable is taken into account assuming suitable stochastic distribution of values between in a reasonable range.
Stochastic uncertainty of inputs combines randomly through a MonteCarlo simulation to produce stochastic distribution of output parameters (i.e. profitability indicators).
Results obtained from this simulation work are useful as considered on a stand-alone basis and also as indicators of a comparative performance of SMR and LR categories.
Interesting considerations may arise from the analysis of the output distribution, concerning the concept of investment risk.
If the expected value of profitability accounts for the financial performance of a nuclear investment, its distribution shape may be related to the risk for the investors of not meeting the expected profitability rate; in other word, the investment risk.
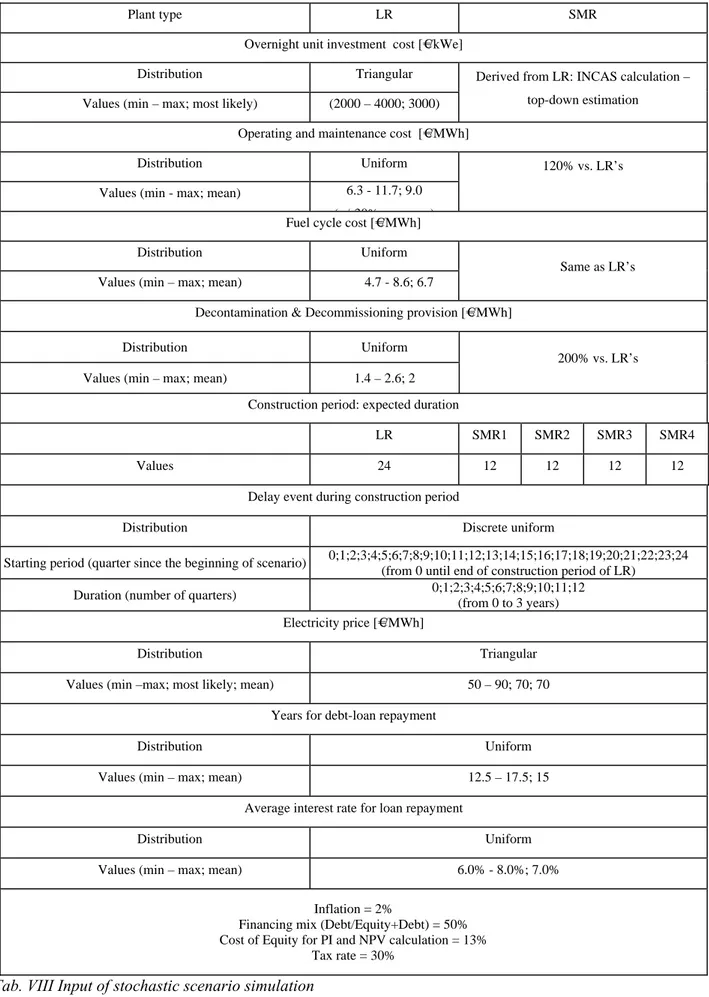
Input values to the INCAs model are summarized in the following Table VIII.
Unit overnight construction cost for LR is a key assumption due to its impact on economic performance indicators [40].
According to the more recent and conservative information [4;41;42], mean value of unit overnight cost for LR has been set at 3,000 €/kWe. It has been assumed a triangular distribution [43] as in Figure 13.
Costs for each SMR unit are scaled from this data, accounting for dis-economies of scale, modularization cost savings, site-related cost sharing by multiple units, design saving factor. The average overnight costs of the 4 SMR units (i.e. mean value) is higher than LR (Fig.14).
LP1-F1 - 29 - POLIMI RL-1353/2011
Plant type LR SMR
Overnight unit investment cost [€/kWe]
Distribution Triangular Values (min – max; most likely) (2000 – 4000; 3000)
Derived from LR: INCAS calculation – top-down estimation
Operating and maintenance cost [€/MWh]
Distribution Uniform Values (min - max; mean) 6.3 - 11.7; 9.0
(+/ 30% )
120% vs. LR’s
Fuel cycle cost [€/MWh]
Distribution Uniform Values (min – max; mean) 4.7 - 8.6; 6.7
Same as LR’s
Decontamination & Decommissioning provision [€/MWh]
Distribution Uniform Values (min – max; mean) 1.4 – 2.6; 2
200% vs. LR’s
Construction period: expected duration
LR SMR1 SMR2 SMR3 SMR4
Values 24 12 12 12 12
Delay event during construction period
Distribution Discrete uniform
Starting period (quarter since the beginning of scenario) 0;1;2;3;4;5;6;7;8;9;10;11;12;13;14;15;16;17;18;19;20;21;22;23;24 (from 0 until end of construction period of LR)
Duration (number of quarters) 0;1;2;3;4;5;6;7;8;9;10;11;12 (from 0 to 3 years) Electricity price [€/MWh]
Distribution Triangular Values (min –max; most likely; mean) 50 – 90; 70; 70
Years for debt-loan repayment
Distribution Uniform Values (min – max; mean) 12.5 – 17.5; 15
Average interest rate for loan repayment
Distribution Uniform Values (min – max; mean) 6.0% - 8.0%; 7.0%
Inflation = 2%
Financing mix (Debt/Equity+Debt) = 50% Cost of Equity for PI and NPV calculation = 13%
Tax rate = 30%
LP1-F1 - 30 - POLIMI RL-1353/2011
Fig.13 Unit overnight cost distribution of 1,000MWe LWR (€/kWe)
0 500 1000 1500 2000 2500 3000 3500 4000 LR SMR1 SMR2 SMR3 SMR4 LR SMR1 SMR2 SMR3 SMR4
Fig.14 Unit overnight construction costs for LR and SMR (mean values; €/kWe)
At the purpose of studying delay impact on construction costs, it is considered that one of such delay events may happen randomly during the construction period.
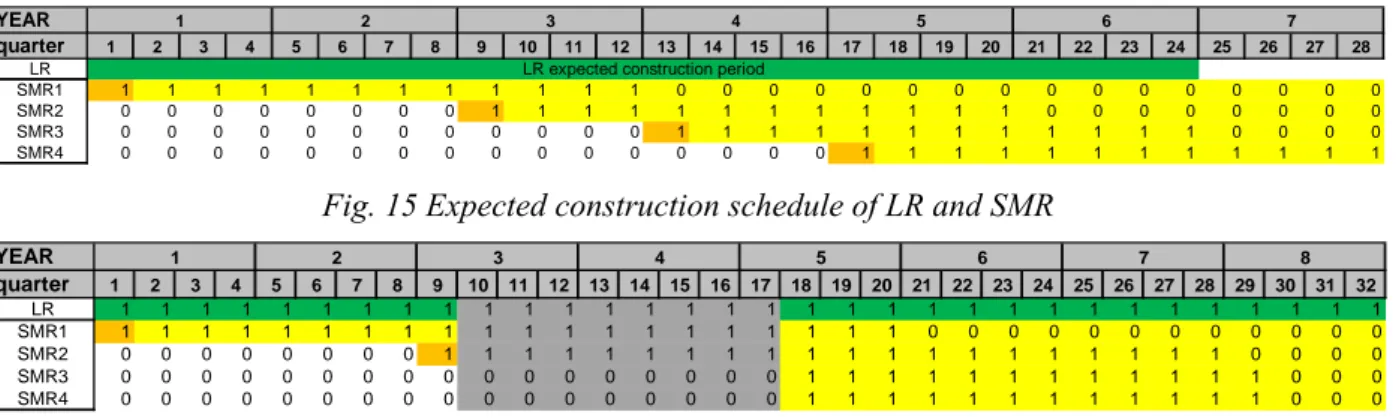
This event produces a delay in the construction schedule of NPP affected and postpones NPP whose construction is not yet started until the end of the unfavorable event. For the purpose of simulation, such delay-event may take place during the construction period of LR (quarters from 0 to 24) and, whenever it starts, it affects one or more SMR units. As an example, Figure 15 shows a case where a 2-year delay-event starts in quarter n.10, thus prolonging the construction of SMR 1 and 2 (just started) and deferring the construction of SMR 2 and 4. Figure 16 shows a more severe case for
LP1-F1 - 31 - POLIMI RL-1353/2011
SMR, where delay starts in quarter 17 and jeopardize the construction schedule of SMR 1,2 and 3; SMR 4 construction is postponed until the end of the delay-event.
Given the modular nature of the SMR investment project and assuming staggered construction schedule, it is not possible that all SMR units are affected by the delay-event.
A priori, only a part of the SMR investment project will be vulnerable to the unexpected delay event.
YEAR quarter 1 2 3 4 5 6 7 8 9 10 11 12 13 14 15 16 17 18 19 20 21 22 23 24 25 26 27 28 LR SMR1 1 1 1 1 1 1 1 1 1 1 1 1 0 0 0 0 0 0 0 0 0 0 0 0 0 0 0 SMR2 0 0 0 0 0 0 0 0 1 1 1 1 1 1 1 1 1 1 1 1 0 0 0 0 0 0 0 SMR3 0 0 0 0 0 0 0 0 0 0 0 0 1 1 1 1 1 1 1 1 1 1 1 1 0 0 0 SMR4 0 0 0 0 0 0 0 0 0 0 0 0 0 0 0 0 1 1 1 1 1 1 1 1 1 1 1 1 2 3 4 5 6 7
LR expected construction period
0 0 0 1
Fig. 15 Expected construction schedule of LR and SMR
YEAR quarter 1 2 3 4 5 6 7 8 9 10 11 12 13 14 15 16 17 18 19 20 21 22 23 24 25 26 27 28 29 30 31 32 LR 1 1 1 1 1 1 1 1 1 1 1 1 1 1 1 1 1 1 1 1 1 1 1 1 1 1 1 1 1 1 1 1 SMR1 1 1 1 1 1 1 1 1 1 1 1 1 1 1 1 1 1 1 1 1 0 0 0 0 0 0 0 0 0 0 0 0 SMR2 0 0 0 0 0 0 0 0 1 1 1 1 1 1 1 1 1 1 1 1 1 1 1 1 1 1 1 1 0 0 0 0 SMR3 0 0 0 0 0 0 0 0 0 0 0 0 0 0 0 0 0 1 1 1 1 1 1 1 1 1 1 1 1 0 0 0 SMR4 0 0 0 0 0 0 0 0 0 0 0 0 0 0 0 0 0 1 1 1 1 1 1 1 1 1 1 1 1 0 0 0 1 2 3 4 5 6 7 8
Fig. 16 Construction schedule of LR and SMR with 2-year delay-event in quarters 10-17
YEAR quarter 1 2 3 4 5 6 7 8 9 10 11 12 13 14 15 16 17 18 19 20 21 22 23 24 25 26 27 28 29 30 31 32 33 34 35 36 LR 1 1 1 1 1 1 1 1 1 1 1 1 1 1 1 1 1 1 1 1 1 1 1 1 1 1 1 1 1 1 1 1 SMR1 1 1 1 1 1 1 1 1 1 1 1 1 1 1 1 1 1 1 1 1 0 0 0 0 0 0 0 0 0 0 0 0 0 0 0 0 SMR2 0 0 0 0 0 0 0 0 1 1 1 1 1 1 1 1 1 1 1 1 1 1 1 1 1 1 1 1 0 0 0 0 0 0 0 0 SMR3 0 0 0 0 0 0 0 0 0 0 0 0 1 1 1 1 1 1 1 1 1 1 1 1 1 1 1 1 1 1 1 1 0 0 0 0 SMR4 0 0 0 0 0 0 0 0 0 0 0 0 0 0 0 0 0 0 0 0 0 0 0 0 1 1 1 1 1 1 1 1 1 1 1 1 1 2 3 4 5 6 7 8 9
Fig. 17 Construction schedule of LR and SMR with 2-year delay-event in quarters 17-24
Due to the delay event, construction schedule of LR and SMR may last 6 to 9 years and 3 to 6 years
respectively (4 to 7 years for 1st SMR).
Literature demonstrates that planned and intentional delays’ cost may be absorbed or accounted in the initial cost estimate; on the contrary, unexpected delay events always result in significant cost overruns, far beyond the initial cost estimates.
According to [36] a delay in the construction schedule produces 17.5% annual rate of increase in overnight construction costs (4.1% on a quarterly basis).
These values are consistent with Olkiluoto and Flamanville cost information.
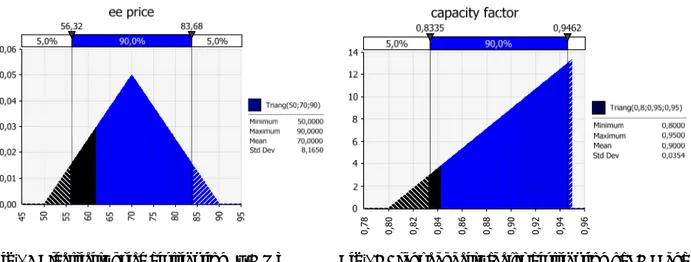
Revenues depend on an electricity price distribution which ranges from a minimum of 50 to 100 €/MWh, with most likely value of 70 €/MWh.
The same plant capacity factor for LR and SMR is assumed, ranging from a minimum of 80% to 95%, with most likely value of 95% and mean at 95%.
LP1-F1 - 32 - POLIMI RL-1353/2011
0,78 0,80 0,82 0,84 0,86 0,88 0,90 0,92 0,94 0,96
Fig.18 Electricity price distribution (€/MWh) Fig.19 Plant capacity factor distribution of SMR and LR
The model is expressed in nominal terms and all costs and revenues increase with an annual inflation rate of 2%.
7 M
AIN RESULTS7.1 Single site simulation
LUEC of LR and SMR alternative investments has been calculated in “Supported” and “Merchant” business cases as the minimum electricity sale price that covers all the project life-cycle costs. In particular, LUEC allows for the invested capital remuneration on the basis of the cost of
equity (Ke) and cost of debt (Kd): no extra-profit is left to shareholders on top of the cost of equity.
Hence the cost of equity exactly equalizes the IRR of the free cash flows and represents the shareholders’ capital remuneration.
As showed in Table IX, SMRs deployment has to set higher LUEC (+7% in the “Supported” case) to grant the same capital remuneration between LR and SMRs, on account of its higher construction costs. The calculation procedure sets the required capital remuneration (IRR) and
considers the eeprice as an output: LUEC is the minimum sale eeprice needed to cover capital
remuneration. Case “Supported” Case “Merchant” Case Reactor size LR SMRs LR SMRs LUEC ($/MWh) 55.0 59.1 96.1 96.3 Shareholders’ capital remuneration Ke = IRR = 10% Ke = IRR = 15%
LP1-F1 - 33 - POLIMI RL-1353/2011
INCAS shows that SMRs deployment is less cost-effective than LR (higher LUEC) in the “Supported” case: lower power installed rate implies later revenues whose time value is penalised by actualisation.
The use of self-financing mitigates the up-front capital investment, but represents a higher recourse to equity funds, i.e. a more expensive capital source than debt, a less efficient financial leverage.
Moreover, the model is based on higher operating costs for SMRs than LR.
Nevertheless, as already mentioned, absolute value of output indicators has to be cautiously appreciated, given the high uncertainty on input data.
That means LUEC of SMRs and LR are substantially comparable, despite the loss of economies of scale on overnight cost for SMRs.
Moreover, the investment simulation of the two business cases highlights that SMRs are able to better cope with higher capital costs.
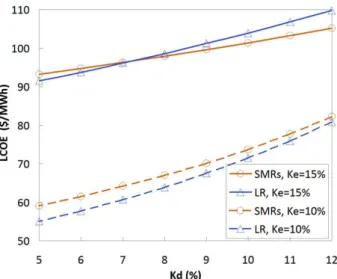
Fig. 20 shows the trend of LUEC as a measure of the economic performance of SMRs deployment, that improves on LR’s with the cost of debt increasing.
Fig. 20. LUEC trend at increasing cost of debt Kd, at different cost of equity Ke (i.e. for “Merchant” case – solid lines– and “Supported” case –dotted lines)
SMRs reveals to be a more suitable option to “Merchant” case’s capital remuneration requirements: when financial leverage and/or cost of debt are higher, SMRs are able to limit interests capitalization and debt accumulation, due to shorter Pay Back Time for each NPP module.
Their financial behavior is more suitable and less sensitive to high cost of capital.
Table X itemizes the results related to the Overnight Construction Costs for the SMRs, according to the INCAS model and adopted in the simulation of the different deployment scenario.