R E S E A R C H A R T I C L E
Open Access
Evaluating the effect of pupil dilation on
spectral-domain optical coherence
tomography measurements and their
quality score
Lucia Tanga
1, Gloria Roberti
1*, Francesco Oddone
1, Luciano Quaranta
2, Manuela Ferrazza
1, Francesca Berardo
1,
Gianluca Manni
3and Marco Centofanti
1,3Abstract
Background: Spectral-domain optical coherence tomography (SD-OCT) provides fast scan speed and high scan resolution improving its diagnostic accuracy. The purpose of this study was to evaluate if SD-OCT measurements and their quality score are influenced by pupil dilation.
Methods: Retinal nerve fiber layer thickness (RNFL), ganglion cell complex (GCC) and optic nerve head (ONH) were measured in one eye of 57 glaucoma patients and 36 healthy subjects using spectral domain optical coherence tomography (SD-OCT) before and after pupil dilation. Comparisons were made between measurements and their quality score pre- and post dilation (Signal Strength Index, SSI). Overall RNFL, average GCC and ONH rim volume were considered in the analysis.
Results: No statistically significant differences were found between pre- and post-dilation measurements in both groups (glaucoma: RNFL 80 ± 15μm vs 80 ± 16 μm, p = 0.87; GCC 81.35 ± 13.4 μm vs 81.10 ± 13.14 μm, p = 0.92; ONH 0.05 ± 0.11 mm3vs 0.04 ± 0.07 mm3,p = 0.74; controls RNFL 99 ± 12 μm vs 98 ± 14 μm, p = 0.70; GCC 92.12 ± 6.7μm vs 91.54 ± 7.05 μm, p = 0.72; ONH 0.11 ± 0.1 mm3vs 0.04 ± 0.07 mm3,p = 0.36) nor between pre- and post-dilation quality score (glaucoma SSI RNFL 54.3 ± 10.3 vs 51.7 ± 18.1,p = 0.12; SSI GCC 58 ± 9.5 vs 57 ± 8.09, p = 0.55; SSI ONH 48.5 ± 7.6 vs 46.6 ± 7.2,p = 0.16; controls SSI RNFL 57 ± 10.3 vs 54 ± 9.31, p = 0.2; SSI GCC 60.9 ± 8.1 vs 58.8 ± 7.3,p = 0.3; SSI ONH 51.5 ± 8.9 vs 50.4 ± 8.3, p = 0.59).
Conclusion: Pupil dilation doesn’t affect SD-OCT measurements and their quality score. Background
Optical coherence tomography (OCT) is a non-invasive method of imaging the optic nerve head (ONH) and ret-ina and it has been shown to provide reproducible mea-sures of both ONH morphometry and retinal nerve fibre layer (RNFL) thickness, playing a growing role in the diagnosis and monitoring of glaucoma [1–8].
The spectral-domain OCT technology (SD-OCT), has replaced the time-domain OCT (TD-OCT) providing faster scan speed, improving scan resolution and poten-tially increased diagnostic accuracy [9, 10]. The
RTVue-100 SD-OCT (Optovue Inc., Fremont, California, USA) is a commercially available SD-OCT with an axial reso-lution of 5 μm in tissue and a scan speed of 26000 A-scans/s. RTVue OCT is also equipped with a proprietary segmentation algorithm aimed at measuring the ganglio-nar cell complex (GCC) thickness within the macular region [11]. When introducing a device in the clinical practice, it is important to assess its reproducibility, its diagnostic accuracy and the factors that might influence these two features, like media opacities and pupil dila-tion. Although the manufacturer of the RTVue-100 indicates the quality score limit to accept the images (the Signal Strenght Index, SSI), there is no study in lit-erature investigating the effects of pupil dilation on it. * Correspondence:[email protected]
1IRCCS-Fondazione GB Bietti, Via Livenza 3, 00198 Rome, Italy
Full list of author information is available at the end of the article
© 2015 Tanga et al. Open Access This article is distributed under the terms of the Creative Commons Attribution 4.0 International License (http://creativecommons.org/licenses/by/4.0/), which permits unrestricted use, distribution, and reproduction in any medium, provided you give appropriate credit to the original author(s) and the source, provide a link to the Creative Commons license, and indicate if changes were made. The Creative Commons Public Domain Dedication waiver (http://creativecommons.org/publicdomain/zero/1.0/) applies to the data made available in this article, unless otherwise stated.
Low signal strength can result in poor image resolution, lack of retinal detail, and an increase in segmentation errors (because there is little image structure for the al-gorithms to use in segmenting the various layers). Thus, the purpose of this study was to evaluate the influence of pupil dilation on RTVue-100 RNFL, ONH and GCC measurements and their quality in glaucoma patients and healthy subjects.
Methods
The study was conducted at the IRCCS-Fondazione GB Bietti, Rome (Italy) according to the principles of the Declaration of Helsinki and the ethics committee of the institution that approved the protocol. Written informed consent was obtained from all enrolled subjects.
Two groups of people were involved, glaucoma pa-tients and healthy subjects as control group.
Glaucoma was defined as the presence of a repeatable visual field (VF) defect, commensurate with optic nerve damage. A glaucomatous VF change was defined as the consistent presence of a cluster of three or more non-edge points on the pattern deviation plot with a prob-ability of occurring in <5 % of the normal population with one of these points having the probability of occur-ring in <1 % of the normal population, a pattern stand-ard deviation withp < 5 %, or a glaucoma hemifield test result outside normal limits. VF defects had to be reli-able (false positive <15 %; fixation losses and false-negative responses <25 %) and confirmed in at least two tests no more recent than one month.
Healthy subjects had to have intraocular pressure of less than 22 mmHg, normal-appearing optic disc and normal VF test result.
Participants in both groups were excluded if they had spherical refractive error greater than ±6 diopters, astigmatism greater ±3 diopters, any active or past ret-inal pathologies (including diabetic retinopathy or age-related macular degeneration), opacities of optic media that could bias functional and structural testing, history of ocular surgery (except for uncomplicated cataract or glaucoma surgery), use of miotic drugs as well as pupils smaller than 3 mm.
People were selected among patients and their rela-tives or partners referring at glaucoma department of IRCCS-Fondazione GB Bietti and matched by age.
All patients underwent a complete ophthalmological examination including visual acuity measurement, slit lamp examination, tonometry with the Goldmann applanation tonometer, gonioscopy, indirect ophthal-moscopy assessment of the optic nerve head with a 90D lens and automated perimetry (24–2 SITA Standard on Humphrey Visual Field Analyzer; Carl Zeiss Meditec Inc., Dublin, CA, USA) to determine eligibility.
Pupil size was then automatically measured by OPD-Scan II Nidek Optical Path Difference OPD-Scanning System (Fremont, California) before and 30 min after pupil dilation obtained by one drop of tropicamide 1 %. It is important to highlight that RTVue-100 doesn’t give enough light to cause significant constriction during scan acquisition. Infact, it uses a scanning laser diode to emit a scan beam with a wavelength of 840 ± 10 nm to provide images of ocular microstructures.
All subjects underwent RNFL, ONH and GCC assess-ment with the RTVue-100 OCT before and after pupil dilation. Subjects were seated with the chin comfortably positioned on a chin rest and the machine properly aligned. The subject was then instructed to look at the internal fixation target to bring the optic nerve head or the macula (for GCC scan protocol) within view of the examiner. The position of the aiming circle was adjusted by the operator to match the optic nerve head best focus and centralization. For all scan sections we have per-formed an automatic Axial length (“Auto Z”), Focus (“Auto F”) and to offset the refractive condition, and “Polarization (“Auto P”) as recommended by the manu-facturer [11]. The same experienced operator performed all the measurements before and after pupil dilation.
RNFL overall, GCC average and ONH rim volume measurements were collected for this study.
Image quality on the RTVue-100 is determined by SSI parameter which is a measure of the average signal strength across the scan, so that the stronger the OCT signal, the higher the SSI value.
The SSI range from near 0 (no signal) to approxi-mately 90 (very strong signal). The general guidelines from the manufacturer are as follows: SSI of less than 30 is a very poor quality scan that cannot be analyzed, SSI between 30 and 40 is a poor quality scan that can be analyzed but should be retaken to improve if possible, SSI of more than 40 but less than 50 is an adequate quality scan that can be analyzed, SSI of more than 50 but less than 60 is a good quality scan, and SSI of more than 60 is a very good quality scan [11].
All images acquired were included and SSI RNFL, SSI GCC and SSI ONH values were collected for this study.
Statistical analysis
Continuous data were expressed by mean and standard deviation (SD) and paired t-test or Wilcoxon sign rank test were used to evaluate differences between measure-ments and between SSI pre- and post- dilation.
To investigate the possible influence of the quality score on the variability between pre- and post-dilation measurements, we evaluated the correlation between this variability and the mean quality score of the two measurements, using Pearson’s correlation coefficient.
The analysis was performed using JMP 7.0 (SAS Insti-tute Inc. Cary, NC, USA).
Results
Fifty-seven eyes of 57 glaucoma patients and 36 eyes of 36 age matched healthy subjects were included in the study (55 ± 14.2 years versus 57 ± 14.9 years,p = 0.63).
As expected, patients had worse VF defect compared to healthy subjects (MD −7.35 ± 8 dB versus −0.9 ± 1.2 dB, p < 0,001 and PSD 5.11 ± 3.52 dB versus 1.56 ± 0.36 dB,p < 0.001), while refraction didn’t differ between the two groups (−1.43 ± 3.5 diopters versus −1.37 ± 3.18 diopters, p = 0.94). BCVA was very good in both groups (0.0 logMAR).
Patients had average pupil size of 4.38 ± 0.92 mm be-fore pupil dilation and 6.96 ± 0.80 mm after pharmaco-logically induced mydriasis, while healthy subjects had average pupil size of 4.50 ± 0.70 mm pre-dilation and 7.01 ± 0.80 mm post-dilation (P = 0.95).
RNFL overall, GCC average and ONH rim volume measurements in both groups didn’t differ statistically, as presented in Table 1.
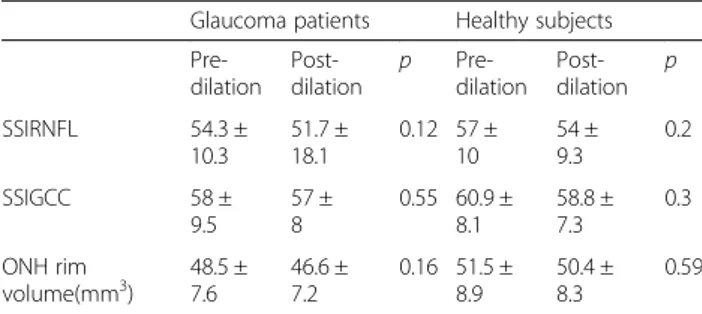
Mean quality scores (SSI RNFL, SSI GCC and SSI ONH) pre- and post-dilation are shown in Table 2. SSI tended to decrease after dilation but the difference wasn’t statistically significant.
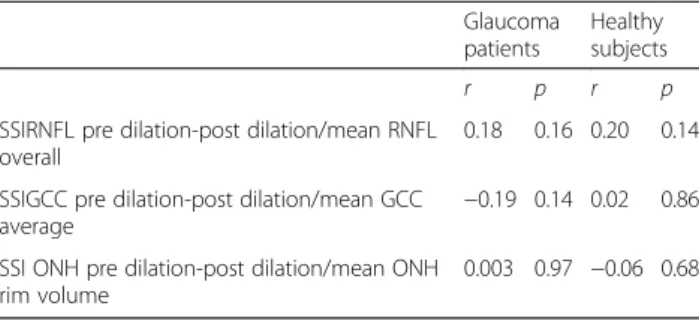
There was not a statistically significant correlation between the measurements variability pre and post dila-tion and the quality score neither for the glaucoma group nor for the control group, as shown in Table 3. Discussion
In this study the influence of pupil dilation on SD-OCT measurements and quality score has been investigated in glaucoma patients and healthy subjects.
The parameters considered in the analysis were RNFL overall, GCC average and ONH rim volume.
None of these measurements differed before and after pupil dilation either in glaucoma patients or healthy individuals.
The quality score tended to get slightly worst in both
groups but the worsening was not statistically
significant.
As expected, the measurements variability of all pa-rameters pre- and post-dilation was not related to the quality score as shown by the Pearson’s coefficient.
While studies about the influence of pupil dilation on TD-OCT measurements gave opposing results [12–15], the few reports focused on the influence of pupil dila-tion on measurements performed by SD-OCTs and especially by the SD-OCT RTVue-100 give similar re-sults concluding that measurements are not affected by pupil size [16].
For example, Garas et al. [17] investigated the influ-ence of several factors, including pupil dilation, on the reproducibility of RNFL thickness and ONH measure-ments as performed with the SD-OCT RTVue-100 in healthy, ocular hypertensive and glaucomatous patients. Even if the authors discarded all poor quality images and included in the analysis only images with SSI > 45, their results agree with those of our study.
Massa et al. [18] compared the RNFL measurements in glaucoma patients and healthy subjects before and after dilation using a different SD-OCT, Cirrus HD-OCT Model 4000 (Carl Zeiss Meditec Inc.). Average thickness, quadrant thickness, and clock hour thickness measurements were compared as well as the quality score and no differences were found. Same results were obtained by Savini et al. [19].
We decided to compare only RNFL overall, GCC aver-age and ONH rim volume because these parameters are commonly used in clinical practice.
Mwanza et al. [20] showed that also macular chor-oidal thickness measured by enhanced depth imaging optical coherence tomography acquisition mode on a
Spectralis OCT device (Heidelberg Engineering,
Heidelberg, Germany) didn’t show statistically differ-ence pre- and post- dilation in healthy individuals and glaucoma patients.
Therefore, these studies confirm that the spectral-domain technology provides faster acquisition, better
Table 1 Studentt-test to compare RNFL overall, GCC average and ONH rim volume measurements pre-and post-dilation between groups
Glaucoma patients Healthy subjects Pre-dilation Post-dilation p Pre-dilation Post-dilation p RNFL overall (μm) 80 ± 15 80 ± 16 0.87 99 ± 12 98 ± 14 0.70 GCC average(μm) 81.3 ± 13.4 81.1 ± 13.1 0.92 92.1 ± 6.7 91.5 ± 7 0.72 ONH rim volume(mm3) 0.05 ± 0.11 0.04 ± 0.07 0.74 0.11 ± 0.1 0.04 ± 0.07 0.36 RNFL = retinal nerve fibre layer; GCC = ganglion cell complex; ONH = optic nerve head
Table 2 Studentt test to compare SSI RNFL, SSI GCC and SSI ONH values pre- and post-dilation between groups
Glaucoma patients Healthy subjects Pre-dilation Post-dilation p Pre-dilation Post-dilation p SSIRNFL 54.3 ± 10.3 51.7 ± 18.1 0.12 57 ± 10 54 ± 9.3 0.2 SSIGCC 58 ± 9.5 57 ± 8 0.55 60.9 ± 8.1 58.8 ± 7.3 0.3 ONH rim volume(mm3) 48.5 ±7.6 46.6 ±7.2 0.16 51.5 ±8.9 50.4 ±8.3 0.59
RNFL = retinal nerve fibre layer; GCC = ganglion cell complex; ONH = optic nerve head
resolution, and improved visualization of retinal morphology as well as high quality scan, regardless the pupil size.
The main advantage of this technology is due to the use of an on-axis line camera to scan across the fundus and to construct the image from the respective lines taken, while the time domain uses an offaxis CCD cam-era, and, therefore, needs a wider pupil to allow the rays from the retina to pass.
The finding that both the quality of the scans and the measurements are similar before and after pupil dilation may represent an important advantage in clinical practice considering also that pupil dilation is time consuming, induces visual complaints, and may not be achievable in some patients.
Our study has important limitations: we included rela-tively young patients, without media opacities, very good BCVA and not taking miotics.
Conclusions
In conclusion, our findings confirm that RNFL, GCC and ONH measurements as performed by the SD-OCT RTVue-100 are similar with undilated pupil and after pharmacological mydriasis, and that high quality images can be obtained without pupil dilation.
Abbreviations
BCVA:best corrected visual acuity; GCC: ganglion cell complex; MD: mean deviation; OCT: optical coherence tomography; ONH: optic nerve head; PSD: pattern standard deviation; RNFL: retinal nerve fibre layer; SD-OCT: spectral-domain optical coherence tomography; SSI: signal strength index; TD-OCT: time-domain optical coherence tomography; VF: visual field.
Competing interests
The authors declare that they have no competing interests.
Authors’ contributions
LT designed the study and wrote the manuscript. GR performed the statistical analysis and wrote the manuscript. FO performed the statistical analysis. LQ reviewed the design of the study. MF collected the data. FB collected the data. GM reviewed the draft of the manuscript. MC reviewed the draft of the manuscript. All authors read and approved the final manuscript.
Acknowledgments
The research for this paper was financially supported by Ministry of Health and Fondazione Roma.
Author details
1IRCCS-Fondazione GB Bietti, Via Livenza 3, 00198 Rome, Italy.2DSMC,
Università degli studi di Brescia USVD“Centro per lo studio del Glaucoma”, P.le Spedali Civili, 1 - 25123, Brescia, Italy.3DSCMT, Università di Roma Tor Vergata, Viale Oxford 81, 00133 Rome, Italy.
Received: 3 September 2014 Accepted: 7 December 2015
References
1. Schuman JS, Pedut-Kloizman T, Hertzmark E, Hee MR, Wilkins JR, Coker JG, et al. Reproducibility of nerve fiber layer thickness measurements using optical coherence tomography. Ophthalmology. 1996;103:1889–98. 2. Paunescu LA, Schuman JS, Price LL, Stark PC, Beaton S, Ishikawa H, et
al. Reproducibility of nerve fiber thickness, macular thickness, and optic nerve head measurements using StratusOCT. Invest Ophthalmol Vis Sci. 2004;45:1716–24.
3. Bowd C, Weinreb RN, Williams JM, Zangwill LM. The retinal nerve fiber layer thickness in ocular hypertensive, normal, and glaucomatous eyes with optical coherence tomography. Arch Ophthalmol. 2000;118:22–6. 4. Medeiros FA, Zangwill LM, Bowd C, Vessani RM, Susanna Jr R, Weinreb RN.
Evaluation of retinal nerve fiber layer, optic nerve head, and macular thickness measurements for glaucoma detection using optical coherence tomography. Am J Ophthalmol. 2005;139:44–55.
5. Wollstein G, Ishikawa H, Wang J, Beaton SA, Schuman JS. Comparison of three optical coherence tomography scanning areas for detection of glaucomatous damage. Am J Ophthalmol. 2005;139:39–43.
6. Wollstein G, Schuman JS, Price LL, Aydin A, Stark PC, Hertzmark E, et al. Optical coherence tomography longitudinal evaluation of retinal nerve fiber layer thickness in glaucoma. Arch Ophthalmol. 2005;123:464–70.
7. Jeoung JW1, Park KH, Kim TW, Khwarg SI, Kim DM. Diagnostic ability of optical coherence tomography with a normative database to detect localized retinal nerve fiber layer defects. Ophthalmology. 2005;112:2157–63. 8. Carpineto P, Ciancaglini M, Zuppardi E, Falconio G, Doronzo E,
Mastropasqua L. Reliability of nerve fiber layer thickness measurements using optical coherence tomography in normal and glaucomatous eyes. Ophthalmology. 2003;110:190–5.
9. Kim NR, Kim JH, Kim CH, Jun I, Seong GJ, Lee ES. Cmparison of the optic nerve imaging by time-domain coherence tomography and Fourier-domain optical coherence tomography in distinguishing normal eyes from those with glaucoma. J Glacuoma. 2013;22:36–43.
10. Shei M, Grewal DS, Sheets CW, Greenfield DS. Diagnostic ability of Fourier-domain vs time-Fourier-domain optical coherence tomography for glaucoma detection. Am J Ophthalmol. 2009;148:597–605.
11. Optovue Inc. Fremont CA. User's Manual. RTVue Version 1.2.6 Optovue. 2007 Part number 500–24034 Rev.A.
12. Savini G, Zanini M, Barboni P. Influence of pupil size and cataract on retinal nerve fiber layer thickness measurements by stratus OCT. J Glaucoma. 2006;15:336–40.
13. Smith M, Frost A, Graham CM, Shaw S. Effect of pupillary dilation on glaucoma assessments using optical coherence tomography. Br J Ophthalmol. 2007;91:1686–90.
14. Zafar S, Gurses-Ozden R, Vessani R, Makornwattana M, Liebmann JM, Tello C, et al. Effect of pupillary dilation on retinal nerve fiber layer thickness measurements using optical coherence tomography. J Glaucoma. 2004;13:34–7.
15. Hsu SY, Tsai RK. Analysis of retinal nerve fiber layer and macular thickness measurements in healthy Taiwanese individuals using optical coherence tomography (Stratus OCT). J Glaucoma. 2008;17:30–5.
16. Cheng CS, Natividad MG, Earnest A, Yong V, Lim BA, Wong HT, et al. Comparison of the influence of cataract and pupil size on retinal nerve fibre layer thickness measurements with time-domain and spectral-domain optical coherence tomography. Clin Experiment Ophthalmol. 2011;39:215–21.
17. Garas A, Vargha P, Holló G. Reproducibility of Retinal Nerve Fiber Layer and Macular Thickness Measurement with the RTVue-100 Optical Coherence Tomograph. Ophthalmology. 2010;117:738–46.
Table 3 Pearson’s correlation coefficient (r) between the variability of pre- and post-dilation of all measurements and the mean quality score of the two measurements
Glaucoma patients
Healthy subjects
r p r p
SSIRNFL pre dilation-post dilation/mean RNFL overall
0.18 0.16 0.20 0.14 SSIGCC pre dilation-post dilation/mean GCC
average −0.19 0.14 0.02
0.86 SSI ONH pre dilation-post dilation/mean ONH
rim volume
0.003 0.97 −0.06 0.68 RNFL = retinal nerve fibre layer; GCC = ganglion cell complex; ONH = optic nerve head
18. Massa GC, Vidotti VG, Cremasco F, Lupinacci AP, Costa VP. Influence of pupil dilation on retinal nerve fiber layer measurements with spectral domain OCT. Eye (Lond). 2010;24:1498–502.
19. Savini G, Carbonelli M, Parisi V, Barboni P. Effect of pupil dilation on retinal nerve fiber layer thickness measurements and their repeatability with Cirrus HD-OCT. Eye (Lond). 2010;24:1503–8.
20. Mwanza JC, Sayyad FE, Banitt MR, Budenz DL. Effect of pupil dilation on macular choroidal thicknessmeasured with spectral domain optical coherence tomography in normal and glaucomatous eyes. Int Ophthalmol. 2013;33:335–41.
• We accept pre-submission inquiries
• Our selector tool helps you to find the most relevant journal • We provide round the clock customer support
• Convenient online submission • Thorough peer review
• Inclusion in PubMed and all major indexing services • Maximum visibility for your research
Submit your manuscript at www.biomedcentral.com/submit