Giovanni Chessa – MECHATRONICS APPLICATIONS AND PROTOTYPING SENSORS FOR THE PRECISION
MECHATRONICS APPLICATIONS AND PROTOTYPING SENSORS FOR THE
PRECISION LIVESTOCK FARMING
Dr. Giovanni Chessa
Coordinatore del Corso Prof. A. Cannas
Referente di Curriculum Prof. G. Battacone
Giovanni Chessa – MECHATRONICS APPLICATIONS AND PROTOTYPING SENSORS FOR THE PRECISION LIVESTOCK FARMING – Tesi di Dottorato in Scienze Agrarie –
Giovanni Chessa – MECHATRONICS APPLICATIONS AND PROTOTYPING SENSORS FOR THE PRECISION
La presente tesi è stata prodotta durante la frequenza del corso di dottorato in Scienze Agrarie dell’Università degli Studi di Sassari, a.a. 2015/2016 - XXIX ciclo, con il sostegno di una borsa di studio cofinanziata con le risorse del P.O.R. SARDEGNA F.S.E. 2007-2013 - Obiettivo competitività regionale e occupazione, Asse IV Capitale umano, Linea di Attività l.3.1 “Finanziamento di corsi di dottorato finalizzati alla formazione di capitale umano altamente specializzato, in particolare per i settori dell’ICT, delle nanotecnologie e delle biotecnologie, dell'energia e dello sviluppo sostenibile, dell'agroalimentare e dei materiali tradizionali”.
La tesi è stata prodotta, altresì, grazie al contributo della Fondazione di Sardegna.
Giovanni Chessa presents its sincere thanks to the Sardinian Regional Government for the financial support of her PhD scholarship (P.O.R. Sardegna F.S.E. Operational Programme of the Autonomous Region of Sardinia, European Social Fund 2007-2013 - Axis IV Human Resources, Objective l.3, Line of Activity l.3.1.).
Giovanni Chessa – MECHATRONICS APPLICATIONS AND PROTOTYPING SENSORS FOR THE PRECISION LIVESTOCK FARMING – Tesi di Dottorato in Scienze Agrarie –
Sommario
INTRODUCTION ... 7 1. PLF REVIEW ... 15 1.1 Hardware review ... 15 1.1.1 Sensors ... 15 1.1.2 Microcontroller ... 16 1.2 Software review ... 191.2.1 Commercial VS open-source software ... 19
1.2.2 Mathematical model ... 21
1.3 Plf sensors review ... 22
1.4 Sound analysis ... 23
1.5 Image analysis in livestock farm... 23
1.6 Hardware modularity & commercial software problems ... 26
2. MILK ELECTRICAL CONDUCTIVITY IN SARDA BREED SHEEP: A PROTOTYPE OF A PORTABLE DEVICE FOR ESTIMATING THE SOMATIC CELL COUNT ... 2
2.1 Introduction ... 2
2 Materials and methods ... 3
2.2.1 Ewe milk characteristics ... 3
Giovanni Chessa – MECHATRONICS APPLICATIONS AND PROTOTYPING SENSORS FOR THE PRECISION
2.2.3 Evaluation of the prototype ... 7
2.2.4 Statistical analysis ... 8
2.3 Results and discussion... 9
2.4 Conclusion ... 14
3. ANIMAL BODY TEMPERATURE MONITORING: A PRECISION LIVESTOCK FARMING PROTOTYPE APPLICATION ... 15
3.1 Introduction ... 15
3.2 Materials and methods ... 16
3.2.1 Selection of materials ... 17
3.2.2 Microcontroller programming ... 18
3.2.3 Android Application animal_temp ... 19
3.3 Results and discussion... 19
3.3.1 Microcontroller Firmware ... 19
3.3.2 Testing of the system in laboratory ... 20
4. DEVELOPMENT OF A SOFTWARE PLATFORM, DESKTOP APPLICATION AND ANDROID APP FOR THE OPTIMIZATION OF COLLECTION ROUTES OF GOAT’S MILK ... 23
4.1 Introduction ... 23
4.1.1 The mathematical models of logistics ... 26
4.1.2 The mathematical models applied to transportation ... 32
Giovanni Chessa – MECHATRONICS APPLICATIONS AND PROTOTYPING SENSORS FOR THE PRECISION LIVESTOCK FARMING – Tesi di Dottorato in Scienze Agrarie –
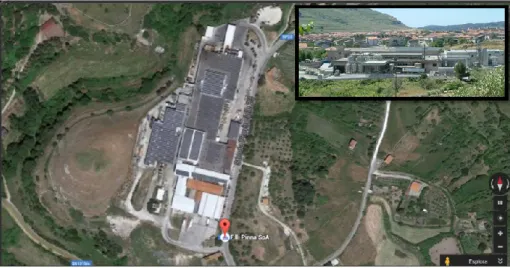
4.2.1 Cooperativa 3A Arborea ... 39
4.2.2 Choice of routes ... 40
4.2.3 GPS Application - Logger for GPS tracks recording ... 43
4.3.4 Software MilkTour for the management of the milk collection ... 47
4.3 Results and Discussion ... 53
4.4 Conclusions ... 62
5. DESIGN OF A PORTABLE INSTRUMENT FOR THE ESTIMATE OF SOMATIC CELLS BY Na+ ... 63
5.1 Introduction ... 63
5.2 MATERIALS AND METHODS ... 66
5.3 Description of the prototype ... 67
5.4 Results and discussion... 71
5.5 Conclusions ... 94
Giovanni Chessa – MECHATRONICS APPLICATIONS AND PROTOTYPING SENSORS FOR THE PRECISION
INTRODUCTION
The challenges facing agricultural and livestock sciences are summarized in a FAO
report with the deliberately explanatory title ‘Can we feed the world in 2050?'
(FAOSTAT, 2009). The projections in this report indicate that by 2050 the world
population will be over 9 billion - currently we are just over 7 billion - of which over
70% will settle in urbanized areas - compared to 49% in 2009 - and the greatest
contribution to global population growth will be given by developing countries. A
later report, ‘World Livestock’ (FAOSTAT, 2011), estimated an increase in meat
consumption of 73% by 2050, while dairy products consumption will rise by about
58%. To meet such a demand for animal proteins in line with the present state of
efficiency of the livestock sector, the increase in breeding of poultry should be by
100%, that of small ruminants by 80%, cattle farming by 50% and pig rearing by
40%, without changing the current level of exploitation of natural resources.
Several authors (Avery, 2001; Reilly and Willenbockel, 2010; Pulina et al., 2011)
have drawn attention to the constant reduction in the available and edible area
per capita as a result of population growth and, to a greater extent, of the different
land uses (nature reserves, urban, energy production). In a globalized world food
security must also be addressed under the qualitative aspect and the Directorate
General for the health of EU consumers, being well aware of this, expressed deep
concern in the EU 2011 report about the diseases that may be transmitted by
Giovanni Chessa – MECHATRONICS APPLICATIONS AND PROTOTYPING SENSORS FOR THE PRECISION LIVESTOCK FARMING – Tesi di Dottorato in Scienze Agrarie –
The average consumer is increasingly concerned with the quality and origin of food
products and if in the past products from systems guaranteeing high animal
welfare levels did not exceed 10% of the market share (Webster, 1999), today this
percentage is on the increase. Significant to that effect is the result of a study
(Furnols et al., 2011) indicating how consumers would not purchase lamb meat if
of dubious origin. Terms such as aflatoxin, dioxin and Escherichia coli are beginning
to be part of the average consumer language, resulting in a more careful and
refined purchase.
In line with the current scientific knowledge, and given the great diversification in
technological and managerial progress of animal farms, there is still significant
scope for increasing the efficiency of the whole agricultural and livestock sector.
Scientific research has employed various types of sensors and data transmission
technologies in order to increase the efficiency of the animal farms. The
miniaturization of these technologies and the reduction of their manufacturing
costs enable real-time monitoring of the environmental and biological parameters
of the livestock sector. More specifically, the sensors that can measure both
environmental parameters (dust, CO, CO2, NO2, O3, CH4, H2S, NH3, temperature
and radiation), and biological ones (such as breathing rate, body temperature,
animal position, muscle and heart activity) are nowadays processed by a single
microcontroller and available at affordable rates.
Precision livestock farming (Plf) is the discipline that encompasses this approach
Giovanni Chessa – MECHATRONICS APPLICATIONS AND PROTOTYPING SENSORS FOR THE PRECISION
numerous biological and environmental parameters concerning each individual
animal of the herd. A Plf system is always made up by three components: a
physical element, i.e. the hardware; an element for data processing and
presentation, known as the software; and an element for the transmission of data,
i.e. the network. The hardware comprises the sensors, the computers and/or
microcontrollers, the data transmission and acquisition systems and the actuators.
Mathematical models for data processing and the data presentation interface are
included in the software loaded into the microcontroller. Table 1 shows the wide
range of application of Plf and their possible monitoring frequency (Durack, 2002;
Berckmans, 2014).
Table 1. Summary of the possible environmental and operational variables that can be measured, recorded and analyzed in Plf (Durack, 2002 and Berckmans, 2014).
Plf application areas Sampling
frequency Biological parameters
Daily weight gain (IPG) Daily
Food conversion index (ICA) Daily
Feed consumption (CM) Hourly
Body mass index Daily
Normal/nervous behavior Daily
Estrus activity detection Hourly
Environmental conditions
Outdoor and indoor climatic conditions
(sheds, rooms) Hourly
Floor temperature and humidity Hourly Air speed and ventilation rate Hourly Gas levels, such as CO2 and NH3 Hourly
Dust levels Hourly
Traceability and transport
Electronic product code -
Environmental conditions during transport Hourly Animal feed and medicines unique codes -
Giovanni Chessa – MECHATRONICS APPLICATIONS AND PROTOTYPING SENSORS FOR THE PRECISION LIVESTOCK FARMING – Tesi di Dottorato in Scienze Agrarie –
Several authors have contributed to the development of the fields of
application of Plf, such as advanced systems for controlling environmental
parameters (Banhazi et al., 2008), sensors for the assessment of animal welfare
and behavior (Shao and Xin, 2008), systems for real-time appraisal of animal
body weight (Kollis et al., 2007), real-time monitoring of water and feed
consumption (Madsen and Kristensen, 2005; Madsen et al., 2005), employment
of sensors in the diagnosis and monitoring of diseases (Maatje et al., 1997;
Eradus and Jansen, 1999), electronic identification (Naas, 2001; 2002), recording
and interpretation of animal verses (Holst, 1999). The incessant technological
development constantly offers potential improvements and opportunities to
implemented systems, even to the most advanced ones.
During the three years of my doctorate study I have sought to develop
different issues concerning Plf, from the point of view of animal welfare as well
as the application of new technologies in order to optimize business
performance.
The study, subdivided into 5 chapters, comprises a review of the
advancements of the main components of Plf, the development of a prototype
for EC monitoring in ewe milk, a prototype for monitoring animals body
temperature, the optimization of collection rounds of goat milk and the
development of a prototype for somatic cell count (SCC) through the
Giovanni Chessa – MECHATRONICS APPLICATIONS AND PROTOTYPING SENSORS FOR THE PRECISION
The first chapter is a review of the advancements of the main components of
Plf, i.e. software, hardware and data transmission, focusing on issues related to
hardware modularity and differences between licensed and unlicensed
software. From the review it emerges that image processing is one of the most
used techniques in Plf systems, in that it allows the detection of behavioral,
biological and pathological parameters without interfering with the animals
routine activities. In this regard the area occupied by a lamb carcass was
calculated by using an image analysis open source software, CellProfiler (Jones
et al., 2008).
The second chapter deals with the realization of an innovative portable tool
for somatic cells count in ewe milk by measuring its electrical conductivity.
There are over 15,000 dairy sheep farms in Sardinia, which represent both
historically and economically the most important agricultural and livestock
sector in the island. Indeed, Sardinia holds more than 40% of the national sheep
population thanks to more than 3 million sheep heads that provide about 60%
of the total national milk production. One of the most common problems in
sheep farms is mastitis, an intramammary infection which may cause a
quantitative reduction up to 50% in milk production and a qualitative drop, in
particular of lactose and casein. One of the indirect methods for the assessment
Giovanni Chessa – MECHATRONICS APPLICATIONS AND PROTOTYPING SENSORS FOR THE PRECISION LIVESTOCK FARMING – Tesi di Dottorato in Scienze Agrarie –
electrical conductivity (EC). In small ruminants, EC has a reasonable correlation
R2 = 0.35 with somatic cells but to date there is still not a portable tool that can
estimate SCC based on the milk’s EC reading. The prototype was calibrated on
Sarda ewe milk.
The aim of Chapter 3 was to develop a system using a open source sensors,
actuators and micro-controller. The system is able to monitoring the rectal
temperature of the animals, sending data via Bluetooth to a smart phone. The
micro-controller used was an ATmega32U4, the temperature was read using the
LM35 analogic sensor and a Class 1 Bluetooth serial module was connected to
Arduino creating a wireless serial link between an Android phone and the
Arduino board. The application for receiving data on an android smart phone
was created using App Inventor that is an innovative Android application
creation software developed by Massachusetts Institute of Technology (MIT).
This app is free available on Google Play Store under the name animal_temp.
The costs of sheep milk collection rounds in Sardinia have been analysed in
chapter fourth. The escalating costs incurred by the dairy processing industries
for milk collection from individual farms have focused the attention on the
rationalization of milk collection and transport systems. In this regard, the case
of the Sardinian goat sector has characteristics that make it unique and not
Giovanni Chessa – MECHATRONICS APPLICATIONS AND PROTOTYPING SENSORS FOR THE PRECISION
are mainly represented by the particular conditions of the rural road network
and the fragmented nature of livestock farms.
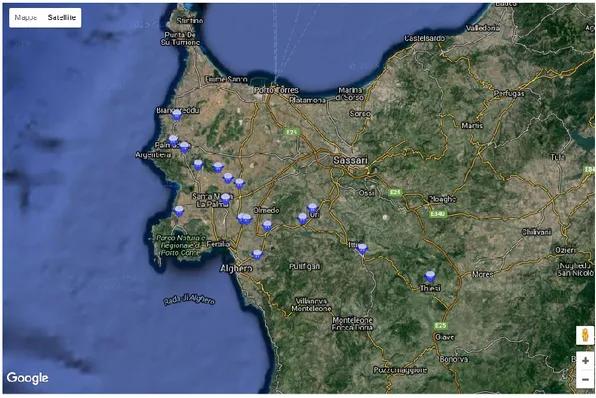
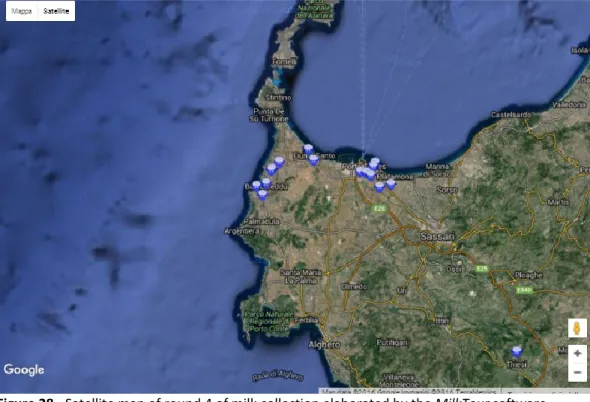
The aim of the present study was to test a milk collection route optimization
software, MilkTour, in the collection rounds of a sample cheese dairy. The
software has been developed by the Land Engineering Section of the Agriculture
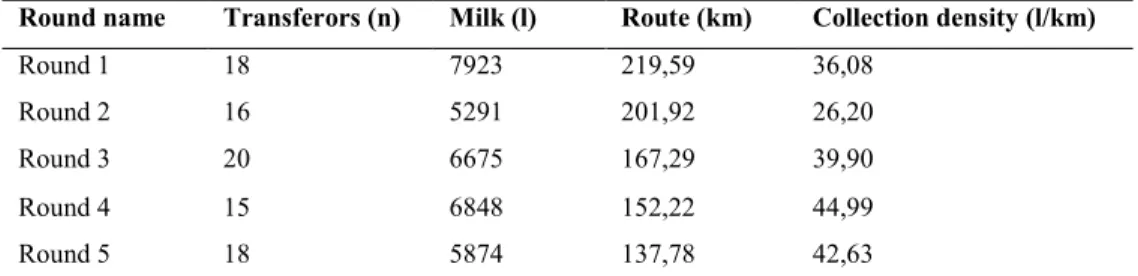
Department of the University of Sassari. A total of 5 routes were analysed and
optimized.
The results have highlighted the importance of optimizing collection routes as
they have a significant impact on business costs. A important contribution that
has emerged is the strong correlation between collection density and the cost
per litre of collected milk (€cent/l), which allows to detects the
cost-effectiveness of a round of collection and its relative optimized around.
The objective of chapter 5 was to study the relationship between the ione Na+
and the main components of sheep milk, in particular somatic cells. Moreover,
a portable device for estimating SCC in sheep milk was designed. The study was
conducted on over 2000 samples.
The milk components examined were: fat, proteins, lactose, pH, sodium
chloride, urea and the ions Na+. The correlation between Na + and SCC
corresponded to R2 = 0.76 (P <0.01).
The prototype developed incorporates two containers which receives milk
Giovanni Chessa – MECHATRONICS APPLICATIONS AND PROTOTYPING SENSORS FOR THE PRECISION LIVESTOCK FARMING – Tesi di Dottorato in Scienze Agrarie –
sensors, one to detect the level of Na+ in the milk and the other one to
compensate the milk temperature. The mathematical model, loaded into the
microcontroller by a firmware written in C / C ++, analyze the data and gives
back the estimate of SCC level, so it allows farmers to monitor the ewes health
Giovanni Chessa – MECHATRONICS APPLICATIONS AND PROTOTYPING SENSORS FOR THE PRECISION LIVESTOCK FARMING – Tesi di Dottorato in Scienze Agrarie –
1. PLF REVIEW
1.1 Hardware review
1.1.1 Sensors
Plf systems sensors can be subdivided into two broad categories: those designed
to detect environmental variables and those to detect biological variables.
Typical environmental parameters are: temperature, humidity, air speed, air
particulate matter, CO2 and NH3 concentrations, odour levels, and water quality.
The main biological parameters are: body temperature, estrus activity, heart
rate, breathing, rumination, brain activity, motor activity, infections, lameness
and feeding. Plf represents a typical automatic control system with an input and
an output. For instance, in a system designated to detect estrus activity a
pedometer might be useful so that by monitoring an increase in the bovine
motor activity, it signals the event to the farmer. This is a simple system to be
implemented both at a hardware and software level, however in reality, of
course, there can be a bovine suffering from lameness that is also in an optimal
condition for insemination. In this case, the pedometer records a reduced or
absent motor activity but is unable to detect estrus activity. Therefore, a system
capable of monitoring all these variables by interpreting any deviation from
expected values needs to be complex both at a hardware and software level. In
order to achieve a precise control it is essential to elaborate a mathematical
Giovanni Chessa – MECHATRONICS APPLICATIONS AND PROTOTYPING SENSORS FOR THE PRECISION LIVESTOCK FARMING – Tesi di Dottorato in Scienze Agrarie –
Curriculum “Scienze e Tecnologie Zootecniche“ – Ciclo XIXX
variables of the monitored animal. The main features that a sensor to be used
in Plf systems must have are: accuracy, reliability, sturdiness and the capacity to
record and transmit data. The accuracy of a device, expressed in terms of the
deviation from the expected value, must not exceed 5%. On the market there are
more expensive devices capable of transducing the same parameters but with an
accuracy of less than 1%, consequently the choice of the accuracy percentage
should be dictated by the type of parameter to be monitored. As for reliability
and sturdiness, it is worth bearing in mind that some commercially available
sensors are not suitable for usage in livestock farms and require, therefore, a
hardware upgrade to be, for example, water, mud and dust proof. Moreover, it
may often be necessary to upgrade the sensors’ software in order to enable data
recording.
1.1.2 Microcontroller
Microcontrollers constitute a system that integrates on the same chip a
processor, permanent and volatile memory and input-output channels (I/O), as
well as any other specialized peripheral (Figure 1). These devices have the ability
to receive incoming data from sensors and treat them first with any appropriate
filtering blocks and analog-to-digital conversion. Microcontrollers are then able
to activate actuators after processing the data with a specific algorithm.
A typical automatic control system is composed of: a transducer, which acquires
Giovanni Chessa – MECHATRONICS APPLICATIONS AND PROTOTYPING SENSORS FOR THE PRECISION LIVESTOCK FARMING – Tesi di Dottorato in Scienze Agrarie –
microcontroller, which processes the transduced parameter and sends the
appropriate control signal to the actuator (Figure 2).
Figure 1. Left: top view of the Waspmote board microcontroller, and highlighted in red, starting from the bottom clockwise: button for card reset, microprocessor, pins for the insertion of sensors, accelerometer, pins for connection to the data transmission modules, mini-USB port for connection to a PC and to a power supply and finally the socket for connection to battery or photovoltaic panel. Right: bottom view, highlighted in red: slot for the SD memory card and the pins for GPS insertion.
Figure 2. Block diagram of a typical automatic control system. In blue the microcontroller that performs the function of data acquisition from the transducers, marked in green; it then processes them through the control algorithm and finally sends the appropriate commands to the actuator to minimize the error between the desired and the measured value of the controlled variable.
A simple example of an automatic control system is the regulation of
temperature and humidity inside the barn / pen in response to animals’ body
Giovanni Chessa – MECHATRONICS APPLICATIONS AND PROTOTYPING SENSORS FOR THE PRECISION LIVESTOCK FARMING – Tesi di Dottorato in Scienze Agrarie –
Curriculum “Scienze e Tecnologie Zootecniche“ – Ciclo XIXX
Figure 3. Block diagram of an automatic control system for animal thermal comfort in a pen. This is a typical example of a single-input and single-output system (SISO).
As the animal’s body temperature changes, the microcontroller activates the
cooling or heating system of the pen. This is a typical example of a single-input and
single-output system (SISO). There are three other systems: SIMO (Single Input
Multiple Output); MISO (Multiple Input Single Output); MIMO (Multiple Input
Multiple Output). The Plf real potential can only be optimized by using a MIMO
system (Figure 4).
Figure 4. Schematic representation of SISO systems (single input and single output), SIMO (single input and multiple outputs), MISO (multiple input and single output) and MIMO (multiple inputs and multiple outputs).
For instance, it may not always be possible to control an increase in a housed
animal body temperature by cooling its pen due to several factors that may came
into play such as the immune system’s response (infections or wounds), heat or
Giovanni Chessa – MECHATRONICS APPLICATIONS AND PROTOTYPING SENSORS FOR THE PRECISION LIVESTOCK FARMING – Tesi di Dottorato in Scienze Agrarie –
parameters at the same time in order to identify the real cause of the body
temperature increase and perform the correct control action.
1.2 Software review
1.2.1 Commercial VS open-source software
Plf is an embryonic technology with great potential, although it still requires
intensive research and development before it is perfected and can be used to full
capacity (Wathes et al., 2008). The lack of hardware modularity and relative closed
source software (commercial or licensed software) of automatic systems offered
by manufacturers are the main factors that hinder Plf development. Many of the
systems available on the market today, in fact, do not allow to add additional
sensors to the system, if not those by the same trademark, and often
manufacturers do not offer a complete range of sensors for all transducible
parameters within the farm (Table 2). The aim of research must therefore be to
create a free, modular platform open to the evolution of new technologies.
Scientific research has already introduced in other fields modular and free
(open-source) systems that have proved to be very successful: for instance VEGA
(Pedretti et al., 2004), an open platform for the development of bioinformatic
applications with plug-in architecture and script programming; NA-MIC (Pieper et
al., 2006), an open platform of medical imaging for the computing community; the
humanoid robot iCub (Metta et al., 2008), an open platform for research on
Table 2. Comparison of sensors available on different Plf systems for pig farms (Banhazi et al., 2003). Skov and Farmex represent the most equipped systems for transducible parameters although no system in the table below is able to measure the level of odour inside and outside the pigsty as well.
1.2.2 Mathematical model
A key point in Plf is the selection of a suitable algorithm capable to represent, as
closely as possible, the reality of the phenomenon observed/detected by the
sensors. Mathematical modeling is crucial in the assessment or classification of a
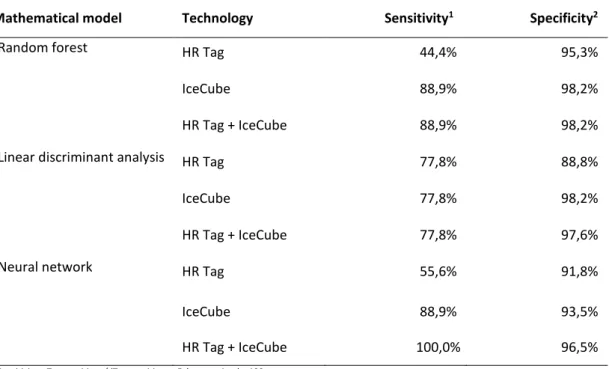
variable or an event. The results of two systems for the prediction of cattle estrus
cycle are compared in Table 3: the HR Tag (SCR Engineers, Ltd., Israel), which
monitors head movement and rumination, and IceQube sensor (IceRobotics, Ltd.,
Scotland) which monitors physical activity. Specificity indicates the
ratio/probability that a cow is negative to the test (no estrus), while sensitivity
indicates the probability that a cow on heat proves to be positive to the test
(estrus). The best results are achieved with neural networks, i.e. machine learning
techniques that reach 100% sensitivity with a combination of both technologies.
Self-learning or supervised learning algorithms have recently been developed for
regression and classification, such as support vector machines and neural
networks. Self-learning models, through which a sort of virtual memory and
cataloguing experience, comparable to the farmer’s, is created, can become all
the more precise and efficient as the available data increase. These models, which
require a huge amount of data, are implemented on increasingly miniaturized and
Table 3. Comparison of classification accuracy of several mathematical models using the same sensor (Borchers, 2015).
Mathematical model Technology Sensitivity1 Specificity2
Random forest HR Tag 44,4% 95,3%
IceCube 88,9% 98,2%
HR Tag + IceCube 88,9% 98,2%
Linear discriminant analysis HR Tag 77,8% 88,8%
IceCube 77,8% 98,2%
HR Tag + IceCube 77,8% 97,6%
Neural network HR Tag 55,6% 91,8%
IceCube 88,9% 93,5%
HR Tag + IceCube 100,0% 96,5%
1 Sensitivity = True positives / (True positives + False negatives) x 100 2Specificity = True negatives / (True negatives + False positives) x 100
1.3 Plf sensors review
The farmer monitors his herd through sensory analysis and is aided in the
decision-making process by his experience gained over the years (Wathes et al.,
2008), however the increase in the number of stock units per farm has made direct
monitoring increasingly challenging (Guarino, 2005). Plf allows the
implementation of automatic systems able to monitor, inter alia, the animals
physical activity (Cangar et al., 2008, Aydin et al., 2010), traceability (Sergeant et
al., 1998 ; Kashiha et al., 2013), behaviour (Leroy et al., 2006), welfare (Song et al.,
2008; Poursaberiet al., 2010; Viazzi et al., 2011) and growth rate (De Wet et al.,
2003; Demmers et al., 2012). One of the main purposes of Plf is to provide a
support to the farmer in the observation of his livestock and individual animal,
analysis. These techniques allow to obtain the necessary information without
subjecting the animal to invasive detection methods which, by subjecting the
animal to stress, may distort measurements (Cangar et al., 2008).
1.4 Sound analysis
Farm animals vocalization analysis is a non-invasive method that allows the
evaluation of different parameters such as their welfare and behaviour (Watts and
Stookey, 2000; Schön et al., 2003). This system allows the monitoring of
behavioural, pathological and production parameters such as, for example, the
quantity of dry matter ingested by livestock (Schirmann et al., 2009), their
behaviour (Deshmukh et al., 2012), the identification and localization of stock
units (Klindtworth et al., 1999; Rossing, 1999; Ikeda et al., 2003; Marx et al., 2013),
time spent chewing (Laca and Wallis De Vries, 2000), estrus activity (Kim et al.,
2010), lameness (Whay et al., 1998; Rajkondawar et al., 2002) and emission levels
of metabolic gases causing air pollution (Van Hirtumand Berckmans, 2002).
Studies conducted so far have focused mainly on housed pig (Weary et al., 1998),
poultry and cattle farms (Schön et al., 2007) albeit only to a certain extent on the
equine (Moehlman, 1998), sheep (Walser et al., 1981; Kendrick et al., 1995) and
goat sectors (Shelton, 1980).
1.5 Image analysis in livestock farm
Image analysis is a non-invasive technique to acquire behavioural, productive and
health information in different species. Some studies have used image analysis
techniques to evaluate, for example, thermal comfort that significantly affect milk
2007), pigs (Shao and Xin et al. 1998 Xin and Shao et al. 2008) and broiler chicks
(Cassuce et al., 2013), while there are no studies available on semi-housed and
free range livestock. Through the evaluation of specific stock anatomical areas it
is possible to calculate the live weight or fattening state - Body Condition Score
(BCS) - in pigs (Brandl and Jorgensen, 1996), dairy and beef cattle (Schofield, 1990;
1992), buffaloes (Negretti et al., 2008) and chickens (De Wet et al., 2003), while
there are no studies available on horse, sheep and goats farms, for which the hand
method is used (Santucci and Maestrini, 1985; Thompson et al., 1994).
Monitoring the animals BCS and weight represents an important indicator in farm
management: a very fat heifer, for example, may run into difficult calving, while
its excessive thinness may cause a decrease in milk production and quality.
Recently, thanks to more efficient algorithms and software, it has been possible
to introduce extremely accurate weight measurement systems for pigs and cattle
(Wang et al., 2008, Kashih et al., 2014; Ozkaya et al., 2015). Recently, thanks to
more efficient algorithms and softwares, it has been possible to introduce
extremely accurate weight measurement systems for pigs and cattle (Wang et al.,
2008, Kashih et al., 2014; Ozkaya et al., 2015). Image analysis techniques have also
been used to monitor behaviour and to evaluate states of panic or discomfort in
pigs (Costa et al., 2014), cattle (DeVries et al., 2004; Stubsjøen et al., 2009) and
chickens (Porto et al., 2013). Furthermore, with image analysis it is possible to
monitor some pathological conditions such as lameness in horses (White et al.,
to check feeding times and feed consumption in poultry farms (Mehdizadeh et al.,
2015) and dairy cattle (Porto et al., 2012; Shelley and Anthony, 2013).
There are many types of licensed software for image analysis providing different
functionality related to the product price, whereas open source ones are: ImageJ,
Fiji , OpenCV (the most feature packed one though with no graphical user
interface), Simplecv and CellProfiler . The latter was created for biologists with no
computer programming training to analyse cells images. Il software è dotato di
una serie di moduli che consentono si rilevare diverse grandezze dall’analisi
dell’immagine, ma una delle potenzialità più interessanti del software è la
possibilità di modificare moduli o di crearne di nuovi per soddisfare particolari
esigenze (Carpenter et al., 2006; Lamprecht et al., 2007; Jones et al.,2008; Stöter
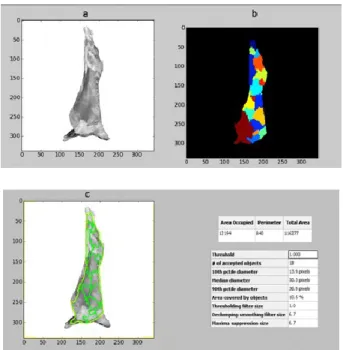
et al., 2013; Bray e Carpenter, 2015). By way of example, the image analysis of a
lamb carcass was used after it had been selected using a Google-specific search
engine. Before proceeding to the evaluation of the area occupied by the carcass
it was necessary to convert the image from RGB to grey scale (Figure 5), an option
available in the image processing modules of the CellProfiler software. The
software allows the selection of modules that enable the extraction of different
parameters such as the area, the intensity, the perimeter and the granularity
Figure 5. Image conversion prior to its processing: on the left the original image, on the right the lamb carcass after conversion from RGB to gray scale.
Figure 6. Example of calculation of the area occupied by the image of the lamb carcass through CellProfiler software..
1.6 Hardware modularity & commercial software problems
The lack of an open source software coupled with the low hardware modularity
represents a hinder to an increased use of Plf. Different platforms for rapid
prototyping are currently available on the market, including: Arduino (Interaction
Design Institute Ivrea, Italy), Waspmote (Libellium CTO, Calle Escatrón, 16, 50014
Zaragoza, Spain), Raspberry Pi (PiRaspberry Pi Foundation, Caldecote, South
active web community, ranging from engineering to agricultural scope of practice.
For instance, the Waspmote microcontroller, characterized by high speed and low
power consumption, has an integrated temperature sensor that allows a reading
from -40ºC to +85ºC with an accuracy of 0,25ºC (Table 4). The card is also fitted
with an accelerometer ±2g/±4g/±8g and can also be fitted with a JN3-Telit GPS
model, which allows to obtain information such as latitude, longitude, altitude,
speed, direction, date and hour.
Table 4. Waspmote microcontroller technical specifications: being lightweight with low power consumption it is ideal for application in Plf systems.
Microcontrollor ATmega1281 Frequency 14MHz SRAM 8KB EEPROM 4KB FLASH 128KB SD card 2GB Weight 20gr Dimensions 73.5 x 51 x 13 mm Clock RTC (32KHz) Consumption on 15mA
Consumption sleep 55uA Consumption hibernate 0.7uA
The most interesting feature of the Waspmote microcontroller is the possibility of
connecting additional cards for monitoring various environmental and biological
parameters (Figure 7). The intuitive connection of the cards to the microcontroller
requires minimal technical knowledge, although programming the cards may take
some time. Thanks to the many additional components available it is possible to
measure various environmental, chemical, biological, physical and mechanical
parameters. Its range of application include: air pollution and air quality
rivers and seas monitoring, goods tracking, animal traceability, vibration and
pressure detection, liquid and solid materials levels control, meteorological
parameters check, fruit diameter, leaf wetness and soil moisture values detection
(Table 5).
Figure 7.The electronic card for Gas monitoring is already wired and needs to be inserted only in the appropriate Waspmote pins; furthermore the sensors are already calibrated and are supplied with a certification, key parameters for distinguishing between a sensor for hobby measurements and one for scientific ones.
In addition, the card for quick prototyping is fundamental, as it allows the creation
and integration within the Waspmote microcontroller of any sensor: this card
represents the solution to the problem of hardware modularity, one of the critical
points of Plf systems, that is, the possibility of connecting new sensors available
thanks to future innovations without disrupting the system already implemented
Table 5. Chemical, physical, mechanical and environmental parameters that can be measured with the various sensor sockets configured on the Waspmote controller.
Parametri Chimici / Fisici Meccanici Ambientali
Carbon Monoxide CO Calcium Ion Ca2+ Pressure Air temperature / Humidity
Carbon Dioxide CO2 Fluoride Ion F- Inclination Soil Temperature / Moisture
Molecular Oxygen O2 Fluoroborate Ion BF4- Vibration Leaf Wetness
Ozone O3 Nitrate Ion NO3- Impact Anemometer Ozone
Nitric oxide NO Bromide Ion Br- Hall Effect Solar Radiation
Nitrogen Dioxide NO2 Chloride Ion Cl- Luminosity Ultraviolet Radiation - UV
Sulfur Dioxide SO2 Cupric ion Cu2+ Temperature Trunk diameter
Ammonia NH3 Iodide Ion I- Liquid Presence Stem diameter
Methane CH4 Liquid Leakage Fruit diameter
Molecular Hydrogen H2 pH Liquid Level Wind Vane Molecular
Hydrogen
Hydrogen Sulfide H2S Dissolved Oxygen Weight Luminosity
Hydrogen Chloride HCl Conductivity Noise Level Ultrasound (distance measurement)
Hydrogen Cyanide HCN Temperature Oxidation-Reduction Potential
Giovanni Chessa – MECHATRONICS APPLICATIONS AND PROTOTYPING SENSORS FOR THE PRECISION LIVESTOCK FARMING – Tesi di Dottorato in Scienze Agrarie – Curriculum “Scienze e Tecnologie
Data transmission represents one of the most delicate points of the Plf systems.
The Waspmote microcontroller offers extreme flexibility in the transmission and
reception of data through a variety of communication protocols, such as: 802.15.4
/ ZigBee, LoRa 868 / 915MHz, Bluetooth Low Energy (BLE) 4.0 and Wifi (Table 6).
There are also communication systems available on the market that are capable
of transmitting over large distances such as the XBee-900 module, that can receive
and transmit data over a range of 10 km. Furthermore, it is possible to encrypt
communication, if the need arises, with the AES 128b key.
Table 6. Overview of the different communication protocols of Xbee type available for the Waspmote microcontroller. An increase in data transmission distances correspond necessarily a greater energy consumption in communication modules. Power consumption is a parameter to be monitored during the design of Plf systems
Model Protocol Frequency Tx power
XBee-802.15.4 802.15.4 2.4GHz 100mW XBee-ZB-Pro Zigbee 2.4GHz 50mW XBee-868 RF 868MHz 315mW XBee-900 RF 900MHz 50mW
2. MILK ELECTRICAL CONDUCTIVITY IN SARDA BREED
SHEEP: A PROTOTYPE OF A PORTABLE DEVICE FOR
ESTIMATING THE SOMATIC CELL COUNT
2.1 Introduction
The somatic cell count (SCC) is widely used for determining subclinical mastitis and
evaluate udder health in dairy animals (Berthelot et al., 2006; Dürr et al., 2008). A high
SCC is also linked to a loss in milk production and deterioration of milk quality
(Gonzalo et al., 1994, 2002; Nudda et al., 2003; Ying et al., 2002, 2004; Leitner et al.,
2004a, 2004b; Dürr et al., 2008; Hagnestam-Nielsen et al., 2009; Hand et al., 2012).
The electrical conductivity (EC) is one of the indirect systems for determining the
quantity of somatic cells in milk (Peris et al., 1991; Barth et al., 2008; Tangorra et al.,
2010; Romero et al., 2012). This parameter is widely used for cattle, where the
probes for measuring it are often integrated into the milking machine and the EC is
continually monitored during milking (Maatje et al., 1992; Zecconi et al., 2004;
Norberg, 2005). There are also various portable devices for cattle that by measure of
the EC of the milk provide an indication of the SCC (Ferrero et al., 2002). In small
ruminants the SCC is usually measured in the bulk tank milk, by laboratory analysis
which usually use Fossomatic SCC method. At present there is a portable device for
somatic cell counts in ovine milk (DeLaval cell counter, DCC). Swift intervention in
obvious benefits in terms of the yield and quality of the milk and the health of the
animals (Milner et al., 1997).
The aim of this study was to design and create a portable device for measuring
conductivity specific for Sarda sheep milk. This would be able to monitor the SC level
by the EC of the milk of each individual sheep. The receiver operating characteristics
(ROC) method was used to identify the EC threshold value that would yield the
optimal mix of false positive and false negatives and to evaluate the diagnostic
effectiveness of discriminating potentially infected udders in Sarda dairy sheep. The
relationships between the EC and the SCC and between the EC and various
constituents of the milk were also studied.
2 Materials and methods
2.2.1 Ewe milk characteristics
In the first phase of the study information was obtained on the composition of the
milk from Sarda breed sheep. This was before the design and creation of the
prototype. A total of 540 samples of half udder milk of 300 ewes were collected before
milking and after discarding the first streams of milk (in sterile containers) for analysis
from twelve different flocks in the north of Sardinia from February to June 2013. The
samples were used to determine the composition of the milk from each individual
animal during morning milking. The EC (LF 92, WTW GmbH, Weilheim, Germany),
freezing point, chlorides,pH, fat, lactose, protein, (Milkoscan FT 6000, Foss Electric,
milk were analysed at the ARA certified laboratory (Associazione Regionale Allevatori)
in Oristano (Sardinia, Italy).
There are marked differences among dairy ruminants with respect to SCC in milk
(Souza et al., 2012).The average of SCC threshold values for discriminating between
healthy and infected halves differ among species and breeds (Pengov, 2001;Berthelot
et al.,2006;Lafi, 2006;Ruegg et al., 2011). Therefore, a threshold of 700,000 cells/ml
was set for this study, based on our experience and knowledge in Sarda breed.
The results of the analysis allowed us to identify the EC cutoff value, based on whether
the number of cells was greater (or equal too) or less than 700,000 cells/ml.
2.2.2 Prototype design
In this stage a portable prototype was designed and created to determine the SCC
from the EC, with a threshold value of 700,000 cells/ml.
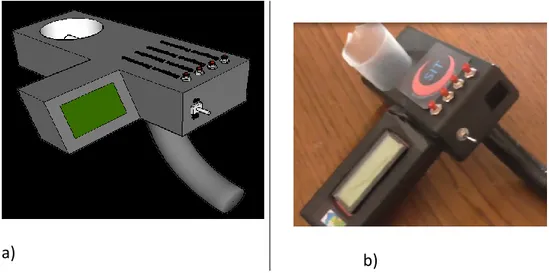
The instrument was designed by arriving at a compromise between the differing
demands of functionality, precision, speed in taking the samples and cost. Before
construction the instrument was modelled in 3D using SketchUp software (version
a)
b)
Figure 8. 3D Model of the portable device for measuring conductivity in Sarda sheep milk (a); the final prototype (b).
The block diagram of the device is shown in Figure 9. The EC probe (k 1.0, Atlas
Scientific, NY, United States) was connected to the EC integrated circuit (v 3.0, Atlas
Scientific, NY, United States) by a BNC connector. The k 1.0 probe can measure EC in
a range from 1.3 mS/cm to 40 mS/cm with a precision of +/-5 µS/cm. The
micro-controller used was an ATmega32U4 (Arduino Pro Micro – 5V/16MHz), characterized
by: low power consumption, a high performance 8 bit CMOS and low cost. The
conductivity readings were compensated for temperature using the DS18B20 (Dallas
Semiconductor, Dallas, Texas, United States) digital sensor. This can measure
temperatures in a range from -55°C to 125°C with a precision of +/- 0.5°C with a
resolution of between 9 and 12 bits, which corresponds to a temperature resolution
of 0.5°C, 0.25°C, 0.125°C or 0.0625°C respectively. The temperature of the milk is a
critical variable when measuring EC, as an increase in temperature results in greater
ionic movement and thus influences the measurement of the EC (Ferrero et al., 2014).
invalidate the results for the predictive diagnosis of mastitis (Romero et al., 2012 b).
The three point calibration of the instrument was carried out following the
instructions provided by Atlas Scientific, using two standard buffers (Standardized
against NIST-certified references) of 10500 µS and 40000 µS. The accuracy of the
calibration of the instrument was tested by comparing the results with those of a
commercial EC measuring device (LF 92,WTW GmbH, Weilheim, Germany). The
results were more than satisfactory (R2=0.987).
Figure 9. diagram of the device for estimating the SCC in sheep milk
Figure 10 shows the electronic circuit of the instrument. The Rx (receiving) and Tx
(transmitting) channels of the EC integrated circuit (v 3.0, Atlas Scientific, NY, United
States) are connected, respectively, to pins two and three of the micro-controller. The
LCD 16X2 (Sparkfun Electronics, Boulder, Colorado, United States) screen includes an
integrated micro-circuit based on PIC 16F88, which allows a serial connection to be
made with the micro- controller. The resistance (indicated by R_Onewire) of 4.7 kΩ
between the positive pin and signal pin ensures that the DS18B20 temperature probe
functions correctly. There are four switches which are normally open (NO): the “Tc”
reading the EC, the “Calibration” switch for calibrating the device and the “SCC”
switch for estimating SCC. The instrument includes a container with a clearly visible
stud, which has to be filled with 50 ml of milk so that a correct EC reading is obtained.
The firmware loaded in the micro-controller is written in C, the size of the binary file
of the sketch is 14.034 kbytes. The device is powered by a 9V battery.
Figure 10. The Printed Circuit Board Layout.
2.2.3 Evaluation of the prototype
In the third phase the prototype was evaluated in the field. A total of 68 half udder
milk samples taken at two farms between May and June 2014 were analysed. The
prototype was used to measure the EC of the samples directly in the field, and further
measurements were then taken in the laboratory, the EC being measured with the LF
2.2.4 Statistical analysis
Statistical analyses were carried out using RStudio (version: 0.98.50), and in particular
the ROCR (Sing et al., 2005) and pROC libraries (Robin et al., 2011). The values of the
different traits measured in the milk are presented as arithmetic mean values and
standard deviation. In addition, the Spearman rank correlations between the
parameters were calculated.
A non-parametric approach was used to fit the ROC curve to the continuously
distributed EC. ROC analysis was used to determine the optimal EC cut-off point for
distinguishing between positive (milk with SC ≥700,000 cells/ml) and negative (milk
with SC <700,000 cells/ml) results. The point on the ROC curve closest to the top left
hand corner was used as the cut-off value. This yields the maximum sensitivity and
specificity values and optimizes the rate of true positives whilst minimizing the rate
of false positives (Dastjerdi et al., 2013). The sensitivity/specificity pair nearest to the
top left hand corner give the most accurate threshold values (Sasse, 2002). The area
under the ROC curve (AUC), which can be used to measure the accuracy of the test,
was also calculated. A value of 1.0 for the area under the ROC curve indicates that
there is a cut-off point for the variable at which there is perfect discrimination
between cases and non-cases. A value of 0.5 would be obtained, if discrimination at
every cut-off point occurred purely by chance. For an imperfect, but better than
2.3 Results and discussion
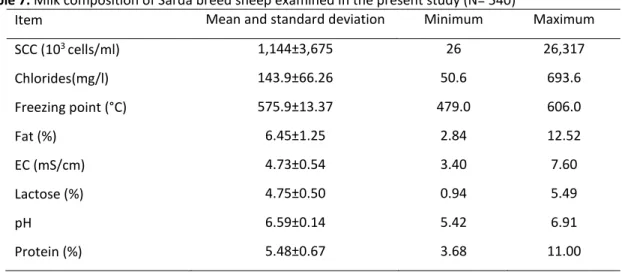
The average and the standard deviations of the milk parameters under investigation
are shown in Table 7.
Table 7. Milk composition of Sarda breed sheep examined in the present study (N= 540)
Item Mean and standard deviation Minimum Maximum
SCC (103 cells/ml) 1,144±3,675 26 26,317 Chlorides(mg/l) 143.9±66.26 50.6 693.6 Freezing point (°C) 575.9±13.37 479.0 606.0 Fat (%) 6.45±1.25 2.84 12.52 EC (mS/cm) 4.73±0.54 3.40 7.60 Lactose (%) 4.75±0.50 0.94 5.49 pH 6.59±0.14 5.42 6.91 Protein (%) 5.48±0.67 3.68 11.00
The results for fat, protein, lactose, freezing point and the pH content, all fall within
the range reported for Sarda sheep (Nudda et al., 2002). The arithmetic mean of the
SCC agrees with the national figures (Rosati et al., 2005), while the mean value of EC
was higher than results found by Serra et al. (1997), which ranged from 4.21 to 4.51
mS/cm.
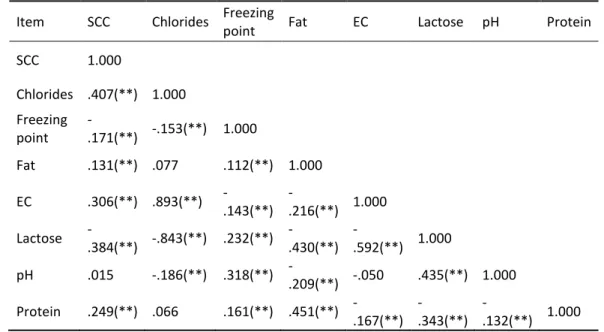
Table 8 shows the values of the correlation coefficients for the variables under
examination. The number of somatic cells of the entire sample had a significant
positive correlation with the chlorides, fats, proteins and the EC, while there was a
significant negative correlation with the freezing point and the lactose. Over all
possible combinations of parameters, the highest coefficients were found for EC with
Table 8. Spearman correlation coefficients among milk variables in Sarda breed sheep milk (N=540) Item SCC Chlorides Freezing
point Fat EC Lactose pH Protein SCC 1.000 Chlorides .407(**) 1.000 Freezing point -.171(**) -.153(**) 1.000 Fat .131(**) .077 .112(**) 1.000 EC .306(**) .893(**) -.143(**) -.216(**) 1.000 Lactose -.384(**) -.843(**) .232(**) -.430(**) -.592(**) 1.000 pH .015 -.186(**) .318(**) -.209(**) -.050 .435(**) 1.000 Protein .249(**) .066 .161(**) .451(**) -.167(**) -.343(**) -.132(**) 1.000 ** P < 0.01
The correlation between SCC and EC (r=0.306) was lower than that found for cattle
(r=0.399; Kasikci et al., 2012), goats (r=0.380; Diaz et al., 2011) and sheep (r=
0.455-0.471; Serra et al., 1997). The freezing point and the EC (r=-0.143) had lower values
and opposite signs when compared with the results in studies on cattle (0.228; Kasikci
et al., 2012). However no significant difference was found in the correlation between
SCC and freezing point in cows (Kasikci et al., 2012), while in our study the opposite
was true.
The data on EC were elaborated taking into consideration the number of somatic cells,
or rather adopting 700,000 cells/ml as the threshold value for discriminating animals
with suspected sub-clinical mastitis (Tab. 9). There were far fewer samples (n=104)
The minimum and maximum levels for both groups showed that conductivity varied
greatly. This can be explained by the fact that other factors other than mastitis are
related to conductibility (individual variation of EC, farm, parity, and stage of
lactation) (Baumgartner et al., 1992; Nudda et al., 2002; Díaz et al., 2011).
Table 9. Descriptive statistics of electrical conductivity (mS/cm) calculated for somatic cell counts of less than 700,000 and more than or equal to 700,000 cells/ml.
ECSCC< 700·103 ECSCC≥700·103 n 436 104 Mean 4.63 5.20 Median 4.60 5.10 Standard Deviation 0.40 0.69 Minimum 3.40 4.00 Maximum 6.10 7.60
The ROC is one sensitive and specific tool for evaluating the adequacy of a diagnostic
test. This allows to identify the best cut-off, or, in other words, the test value which
minimises the number of false positives and negatives (Figure 11).
The ROC curve was elaborated from the conductivity data which corresponded to the
value of the cells, divided up as in Table 9. The cut-off value (closest top-left index)
was 4.835 mS/cm, which corresponds to a sensitivity of 73.08% and a specificity of
75.46% (Tab. 10).
Table 10. Sensitivity, specificity and confidence interval (CI) for coordinates of the ROC curve Cut off
(mS/cm)
Sensitivity
% 95% CIa Specificity % 95% CIa 4.835 73.08 63.5-81.3 75.46 71.1-79.4
The AUC, which measured the diagnostic accuracy of the test, was 0.804 (P<0.0001).
This indicated that the test was moderately accurate (Swets J.A., 1988; Greiner et al.,
and thus discriminated sufficiently well between them. In practice, a diagnostic test
with an area under the curve of ≥80% is considered adequate (D’Arrigo et al., 2011).
Figure 11. Receiver operating characteristic (ROC) curve between the true positive rate and the false positive rate. The optimal threshold, selected using the closest top-left method, is indicated by the arrow.
The EC was found to be well able to estimate the number of somatic cells, as can be
seen by the fact that the confidence interval (CI) of the ROC curve (CI at 95%: 0.768
to 0.837), not included 0.5 (the threshold for diagnostic lack of difference). According
to these results, the cut-off value obtained was used in the prototype.
Table 11. Significance level, standard error (SE) and confidence interval (CI) for area under the curve (AUC).
AUC SE P Asymptotic 95% CI
Lower bound Upper bound
0.804 0.0265 <0.0001 0.768 0.837
The flow diagram in Figure 12 shows how the device works. Once the device is
milk, one must press the ‘Tc’ button. This takes the temperature of the milk, which is
shown on the LCD screen and is sent to the automatic temperature compensation
circuit. The ‘Data Acquisition’ button allows one to measure the EC value of the milk,
and this is displayed on the LCD screen and memorised by the device. At this point
the ‘SCC’ button, allows the micro-controller to elaborate the EC values, comparing
them with the pre-set threshold values (4.835 mS/cm), and showing on the LCD
screen whether they are greater than or inferior to 700,000 cells/ml.
Figure 12. Flowchart of the device.
In the third phase the prototype was tested in the field, and 68 milk samples were
analysed (Tab. 12). The device found 11 of the 17 samples which had SCC greater than
700,000 cells/ml (64.7% success rate). When it identified negative samples, its results
Obviously it is most important to reduce the number of false negatives by as much as
possible, as these do not recognise animals which have SCC values greater than the
threshold value, and thus the animal itself could suffer because a deeper analysis was
not carried out. With our device the number of false negatives was 6 out of 68 samples
(8.8%).
Table 12. 2x2 contingency table relating probability of disease status by electrical conductivity (cutoff at EC = 4.835 mS/cm) and disease status predicted from Gold Standard ()
Expected positive Expected negative
Positive screening 11 (17) 12
Negative screening 6 39 (51)
2.4 Conclusion
The study showed that measuring the EC is a useful way for identifying sheep with
probable sub-clinical mastitis and thus reducing the costs of cyto-bacteriological
analyses of the individual milk samples. The portable device described here,
specifically designed for sheep milk, gave a good accuracy (73.5%). It allows an initial
screening of the SCC to be carried out, based on the threshold value of the EC.
Increasing the amount of data available for each animal provides useful information
to monitor health status of their udders, and is also helpful when making decisions on
3. ANIMAL BODY TEMPERATURE MONITORING: A
PRECISION
LIVESTOCK
FARMING
PROTOTYPE
APPLICATION
3.1 Introduction
In the last few years the consumer perception and demand are more careful on
animal welfare and food quality and safety (Grunert, 2005; Zepeda and Reznickova,
2016; McQuadeet al., 2016). Precision livestock farming (Plf) can provide new
opportunities for increasing the efficiency and sustainability of livestock productions
and to ensure food safety and animal welfare (Berckmans D., 2014). One of the main
aims of the PLF is to provide a support to the farmer in management of the
individual animal, using sensors and monitoring techniques that detect the necessary
information without subjecting the animals to stress, which could alter the yields and
distort the measures (Cangar et al., 2008). In recent years, scientific research has
implemented various kind of sensors and data transmission technologies that enable
farmers to monitor in real-time various parameters, in order to increase the
efficiency of the agro-zootechnical sector. Nowadays the miniaturization of sensors
and their low cost can permit to measure in livestock farms both environmental
(temperature, air humidity, air velocity, dust concentration, CO2, CH4, NH3) and
biological parameters (body temperature, feeding behavior, heart and breathing
rate, motor activity, estrous activity, animal’s position) (Sevi et al., 2001; Sevi et al.,
very important the monitoring of animal's body temperature, since its increase is
often associated with diseases or productive and physiological disorders: reduction
of dry matter intake, reduction in milk production, lower reproductive efficiency
(West, 2003). The aim of this study was to provide an easy replicable system able to
detect animal's body temperature, using a modular low cost microcontroller, and to
send data via Bluetooth to an application loaded into a smart-phone with Android
operating system, that allows the visualization and interpretation of measured body
temperature.
3.2 Materials and methods
The temperature measuring system was developed trying to contain the costs of
materials and at same time identifying the right compromise between materials cost
and quality. The four study procedural steps have been (Figure 13): selection and
solder of materials, microcontroller programming and Bluetooth module
configuretion, Android application (animal_temp) programming, testing of the
Figure 13. The block diagram of the four procedural steps.
3.2.1 Selection of materials
The microcontroller used was a low cost ATmega32U4 (Arduino Nano V3.0 –
5V/16MHz), with a high performance 8 bit CMOS. The animal body temperature was
reading using a LM35D temperature sensor. The LM35D is a precision
integrated-circuit temperature sensor with an output voltage linearly which is able to reading
temperature from 0°C to 100°C and does not require any external calibration. The
sensor was alimentated with single power supplies at 5 V and draws only 60 μA from
the supply. The LM35D Transfer Function to convert voltage to temperature is a
simple linear equation:
𝑉𝑜𝑢𝑡 =𝑇 ∙ 𝑉𝑠𝑢𝑝𝑝𝑙𝑦 100
Where Vout is the LM35D output voltage, T is the temperature in °C and Vsupply is the
and has a build-in 2.4GHz antenna that needn’t test antenna. The current in
communication is 8 mA and is very small module (27mm×13mm×2mm) with a work
temperature range from -25°C to +75°C.The electronic components were soldier in a
2 mm headers breakout board. The electric circuit was designed using anopen source
software for Electronic Design Automation, Fritizing Version 0.9.2, developed at the
University of Applied Sciences of Potsdam.
3.2.2 Microcontroller programming
The microcontroller hardware has built-in support for serial communication on pins
2 and 3 thanks to a piece of hardware integrated into the chipcalled Universal
Asynchronous Receiver-Transmitter (UART). This hardware allows the Atmega chip
to receive serial communication from the Bluetooth module even while working on
temperature measurement. A library called SoftwareSerial.h was upload in the
loaded firmware of the microcontroller. The microcontroller is provided of a 10 bit
A/D converter, that meaning it has the ability to detect 1,024 (210) discrete analog
levels, that corresponding at 5 v supply a resolution of 4,883 mV, equation 1:
𝑉𝑝𝑖𝑛 =𝐴𝐷𝐶𝑟𝑒𝑎𝑑𝑖𝑛𝑔∙ 𝑉𝑠𝑢𝑝𝑝𝑙𝑦 𝐴𝐷𝐶𝑟𝑒𝑠𝑜𝑙𝑢𝑡𝑖𝑜𝑛
Where: Vpin is the voltage on pin in mV, ADCreading is the A/D converter
reading,ADCresolution is 1023bits and Vsupplyis equal to 5 V. The temperature sensor
lm35d provides an output of 10mV/°C so the equation 2 for extract the temperature
𝑇 [°𝐶] = 𝑉𝑝𝑖𝑛[𝑚𝑉] 𝐿𝑀35𝐷𝑟𝑒𝑠𝑜𝑙𝑢𝑡𝑖𝑜𝑛[𝑚𝑉°𝐶 ]
3.2.3 Android Application animal_temp
The application for smartphone with an Android operating system was write using
App Inventor a power software for programming application for Android developed
by Google and maintenance by Massachusetts Institute of Technology (MIT). It allows
to create software applications for the Android operating system (OS). Nowadays
Smartphones have many integrated sensors such as: accelerometer, barcode
scanner, clock, gyroscope, GPS, near field, orientation.
3.3 Results and discussion
3.3.1 Microcontroller Firmware
The firmware loaded in the microcontroller is written in C/C ++, the size of the sketch
is 6.074 byte.
Global variabels use 339 byte (16%) of dynamic memory, freeing 1.709 byte for local
variable. Below the code statements: Import <SoftwareSerial.h> def variable: float tempC float averageT int tempPin = 0 for i in range i < 10 averageT += analogRead(tempPin) delay(20) tempC = (5 * averageT * 10) / 1023;
return tempC
3.3.2 Testing of the system in laboratory
Figure 14 shows the electronic circuit of the instrument and the actual prototype. The
LM35D sensor was connected on an analogic pin of the microcontroller while the
Bluetooth module was connected on pin 2 and 3,which allow the UART
communication. The microcontroller was able to provide 5 V/pin but the Rx
Bluetooth module operate on a voltage range from 3.1V to 4.2V, so it was necessary
to implemented a voltage divider. The voltage divider allows a 3,3 V on the Rx
Bluetooth canal, it was composed by using a one resistance of 1 kΩ and one
resistance of 2 kΩ.
Figure 14. The printed circuit board layout and the actual prototype.
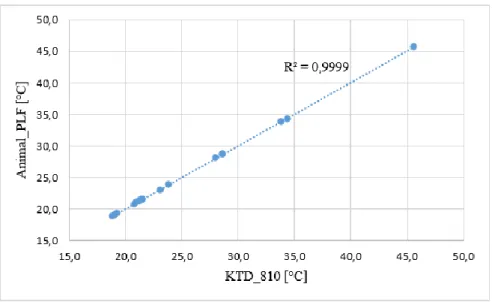
The system was tested in laboratory in a range temperature from 18.8°C to 45.6°C.
thermometer (KTD-810). The correlation between the reading temperatures was
R2=0.99, in figure 15 the relationship between them.
Figure 15. Linear relationship between the temperature reading by the system and the infrared thermometer.
The flow chart in Figure 16 shows how the system works. Once the user opens the
app, have to press the button Bt_connection, which consent the connexion with the
Bluetooth module the value read from the microcontroller was displayed in the
Figure 16. The flowchart of the actual system.
3.4 Conclusions
The study showed a modular and open platform for measuring temperature animal,
the many analogic and digital pins present on the microcontroller allow to monitoring
many sensor in the same platform with a minimum effort. The recent miniaturization
and reduction of production costs of new technologies can provide researchers with
innovative tools to overcome the main constraints of the commercial systems
provided for the livestock sector, which are the hardware modularity and its closed
source software (commercial software or licensed). Many of current's systems
present on the market, in fact, allow to add additional sensors and actuators to the
system only if they belong to the same trademark, and also the manufacturers often
do not offer a complete assortment of sensors for all the measurable parameters in
transmission module like Xbee o Wifi. It allows an initial screening of the animal
welfare to be carried out, based on the threshold value of the temperature.
Increasing the amount of data available for each animal provides useful information
to monitor health status of their udders, and is also helpful when making decisions
on the management of the whole flock.
4. DEVELOPMENT OF A SOFTWARE PLATFORM, DESKTOP
APPLICATION AND ANDROID APP FOR THE OPTIMIZATION
OF COLLECTION ROUTES OF GOAT’S MILK
4.1 Introduction
In the recent decades the dairy sector, taking advantage of the intense technological
development, has greatly improved its production in terms of quality by increasing
awareness on proper sanitary management practices (Bencini et al., 1997); quantity
by expanding its technological expertise in cheese production (Smit, 2003);
environmental impact by reducing the waste of the production chain (Bell, 2015). The
main factors that marked the evolution of the processing industry have been the
concentration of production of the establishments, the automation of production
processes, the methods to improve product quality and the laboratory techniques to
control it (Nuvoli et al., 2013).
The production of sheep milk in the island stands at 330 million liters/year, with an
production among the Italian regions (Idda et al., 2010). According to a survey
conducted by the Agency LAORE Sardinia in 2010, the 86 dairies within the regional
territory employ 270 tankers to carry out the collection of milk from 15.000
companies. Most of the processing companies employ on average about ten means,
the 8% of them uses a much higher number, with a peak of 45 units. From the analysis
of collection routes it is pointed out that certain areas of collection overlap each
other, while they refer to very distant dairies.
In this scenario, however, it must be acknowledged that the logistics of collection and
transport of milk from the company to the dairy have not been studied yet. The
improvement of performance in the context of the dairy industries, in fact, has
focused on the aspects mentioned above, omitting the organizational side regarding
the transport, which not least affects the costs of production.
In the management of shipments or in the handling of goods, especially in the oil and
shipping industry, the mathematical models for the optimization of logistics,
developed by the Transportation engineering, play a fundamental role in business
planning.
In areas where transport is an integral part of the production process but not the
heartbeat of the enterprise, such as in the food industry, transport optimization is
not always seen as an important management pawn. There is scant regard for
logistics, particularly in areas where the cost of transportation is traditionally