European Journal of Business and Social Sciences, Vol. 5, No. 09, December 2016. P.P. 84 - 99 URL: http://www.ejbss.com/recent.aspx-/
ISSN: 2235 -767X
SMART REGIONS IN ITALY: A COMPARATIVE STUDY THROUGH SELF–
ORGANIZING MAPS
Emiliano Colantonio (Corresponding author)
Assistant Professor University of Chieti-Pescara Viale Pindaro 42 – 65127 – Pescara (Italy)
+39 085 4537577
Daniela Cialfi
PhD student University of Chieti-Pescara Viale Pindaro 42 – 65127 – Pescara (Italy)
ABSTRACT
egional performance currently seems to depend not only on the city’s combination of hard infrastructure (physical capital), but also on the availability and quality of knowledge and social infrastructure (human and social capital), according to the recent concept of the “smart region”.
The present paper aims to shed light on whether Italian regions can be called “smart”. It provides a focused and operational definition of this concept and presents consistent evidence on the geography of smart regions in Italy. The statistical and graphical analyses, based on a non-linear clustering with Self-Organizing Maps (SOM) neural networks, were carried out in order to analyse the factors determining the performance of smart regions between 2009-2013.
This study found that only regions of northern Italy could be defined as “smart” according to the selected “smartness” performance indicators. This result prompts the formulation of a new strategic agenda for smart regions in Italy.
Keywords: smart regions, regional performance, self-organizing
maps, proximity externalities, knowledge spillovers.
European Journal of Business and Social Sciences, Vol. 5, No. 09, December 2016. P.P. 84 - 99 URL: http://www.ejbss.com/recent.aspx-/
ISSN: 2235 -767X
1. Introduction
Globalization, with trade liberalization measures and fast-moving technological changes altering the relations of production, distribution and consumption, has very substantial effects on regional development. As one important consequence, network-economics evolved “[…] with easier physical movement, globalized players making decisions with no regards to national boundaries” (Thornley, 2000, p. 2). The ongoing reduction of differences and barriers among nations also makes regions more similar in their preconditions. Thus, only a few out of many location-based characteristics gain importance for global actors (Begg, 1999; Parkinson et al., 2003), enforcing competition across regions by altering each region as a potential competitor to improve its local profile.
A modern region is not characterized by a “sense of place” but by a “place of sense”. With their historical strength, creative and supra-infrastructures and important mobilized socio-economic resources and activities functioning as open platforms for a new and open future, modern regions shape and display a spectacular new urban cultural space, as well as improvements in economic viability from different perspectives (across the interfaces of economy, technology, society and culture).
For those reasons, regions play an important role in social and economic local aspects worldwide, and have a huge impact on the environment (Mori and Christodoulou, 2012). The metabolism of regions is seen as an integral part of a complex network of interconnected natural, economic and social subsystems. Analysing the regional metabolism within this network assists observers to understand the concept in a broader context. The current scenario requires regions to find ways to manage new challenges. Regions worldwide have started to look for solutions, which enable transportation linkages and high-quality urban services with long-term positive effects on the economy. For instance, high-quality and more efficient public transport that connects labour with employment is considered to be one of the key elements for regional development. Many of the new approaches related to regional services have been based on harnessing technologies, including ICT; helping to create what some call “smart regions”.
The concept of a smart region is far from being limited to the application of technologies to countries. In fact, the use of the term is proliferating in many sectors with no agreed upon definitions. This has led to confusion among regional policy makers, hoping to institute policies that will make their regions “smart”. The present paper aims to test the relevance of a recently developed tool in computational neural network analysis, Self-Organizing Maps (SOM), for ordering and ranking the relative positions of different Italian regions in order to better appreciate their performance and understand if they could be called “smart”. The paper is organized as follows. The next section will exemplify some literature on what a smart region means. Section 3 will be based on a description of the databases used. In Section 4, the mechanism and analytical power of SOM are outlined, while the next section will offer the empirical findings followed by an interpretation. The concluding section will provide some retrospective and prospective remarks.
European Journal of Business and Social Sciences, Vol. 5, No. 09, December 2016. P.P. 84 - 99 URL: http://www.ejbss.com/recent.aspx-/
ISSN: 2235 -767X
2. Literature review
Our world is moving towards a new settlement pattern, in which urbanization will become the dominant feature. In the “new urban world”, metropolitan areas are increasingly functioning as seedbeds for creativeness, innovation, entrepreneurship and spatial competitiveness. They are characterized by product heterogeneity and behave according to the laws of monopolistic competition in economics (Frenken et al., 2007). In this sense, proximity and agglomeration are the key features of the modern urban areas and they represent the two sides of the same coin.
In the history of urban economics much attention has been paid to density and proximity externalities (for example, Hoover, Isard), where often a distinction was made among the scale, localization and urbanization of economies. According to the density externalities framework, regions offer important socio-economic and cultural advantages that are far higher than any other settlement pattern. In particular, in our modern age, regions offer spatial advantages related to knowledge spill over effects and an abundant availability of knowledge workers in the labour market (Acs et al., 2002). The spatial concentration of activities involving spatial and social proximity, increase the opportunities for interaction and knowledge transfer. Following this argumentation, regions are the cradles of new and innovative industries. Companies in the early stages of the product and company life cycle prefer locations where the new and specialized knowledge is abundantly available for free (e.g., Audretsch, 1998; Camagni, 1991; Cohen and Paul, 2005).
On the one hand, there is codified knowledge that can easily circulate electronically over large distances, for example, prices determined at a stock exchange and statistical data. On the other hand, there is tacit knowledge and its context, and these are critical in the innovation processes. This kind of knowledge is vague and difficult to codify, and, accordingly, spreads mainly through face-to-face contact with the persons involved. Tacit knowledge is transferred through observation, interactive participation and practice. In addition, there is contextual knowledge, which is achieved through long-term and interactive learning, often in relatively open (unstructured) processes (Bolisani and Scarso, 2000).
One of the most representative authors who advocated the learning region as a paradigm is Florida (1995). This approach has an advantage over the other approaches because it explicitly addresses the quality of creative policy-making and a regional development concept in which the emphasis is on improving the individual and collective learning processes of the regional actors involved through open and flexible networks (OECD, 2001).
In support of this, the concept of “smart” has received increasing attention from researchers and policy makers during the last two decades. When this concept appeared for the first time, its main focus seemed to be on the rule of ICT infrastructure, but now much more research has been carried out on the role of human capital and education, social and relational capital and environmental interest as important drivers of regional growth. The European Union and other international institutions have devoted constant effort into developing a strategy for achieving regional growth in a ‘smart’ meaning for its local areas. The OECD and EUROSTAT Oslo Manual (2005) stressed the role of innovation in ICT sectors and provided a toolkit to identify consistent indicators, thus shaping a sound framework of analysis for researchers on regional innovation.
The availability and quality of the ICT infrastructure is not the only definition of a smart or intelligent area. Other definitions stress the role of human capital and education in regional development. Berry and Glaeser (2005) showed, for example, that the most rapid urban growth rates have been achieved in cities where a high share of educated labour force is available. In particular, the authors assumed that entrepreneurs, who
European Journal of Business and Social Sciences, Vol. 5, No. 09, December 2016. P.P. 84 - 99 URL: http://www.ejbss.com/recent.aspx-/
ISSN: 2235 -767X
innovate in industries and products, drive innovation, which requires an increasingly more skilled labour force.
In the urban planning field, the term “smart region” is often treated as an ideological dimension according to which being “smarter” entails strategic directions. In this sense, policy makers, and in particular European ones, are the most likely to attach a consistent weight to spatial homogeneity; in those circumstances, the progressive clusterization of regional human capital is then a major concern. In fact, they are embracing the notion of “smartness” to distinguish their policies and programs for targeting sustainable development, economic growth, better quality of life for their citizens and creating happiness (Ballas, 2013).
The common characteristics of the previous findings are as follows:
1. The utilization of networked infrastructure to improve economic and political efficiency and enable social, cultural and urban development (Hollands, 2008; Komninos, 2002), where the term infrastructure indicates business services, housing, leisure and lifestyle services, and ICT (mobile and fixed phones, satellite TVs, computer networks, e-commerce, internet services). This point brings to the idea of a region as the main development model and of connectivity as the source of growth.
2. Emphasis on the crucial role of high-tech and creative industries in long-run regional growth. This factor, along with “soft infrastructures” (knowledge networks, voluntary organizations, crime-free environments, after dark entertainment economy) is the core of Florida’s research (2002). The basic idea in this case is that creative occupations are growing and firms now orient themselves to attract the creative person. Employers now develop their employees into greater bursts of inspiration. The urban lesson of Florida’s book is that cities that want to succeed must aim at attracting the creative types who are the wave of the future (Glaeser 2005).
3. Profound attention to the role of social and relational capital in regional development. People need to be able to use the technology in order to benefit from it: this refers to the absorptive capacity literature (Caragliu and Nijkamp, 2008). When social and relational issues are also not properly taken into account, social polarization may arise as a result. It should be noted, however, that some researchers actually argue to the contrary. The debate on the possible class inequality effects of policies oriented towards creating smart regions is still not resolved.
4. Finally, social and environmental sustainability is a major strategic component of smart regions. In a world where resources are scarce and where regions are increasingly basing their development and wealth on tourism and natural resources, their exploitation must guarantee the safe and renewable use of natural heritage.
European Journal of Business and Social Sciences, Vol. 5, No. 09, December 2016. P.P. 84 - 99 URL: http://www.ejbss.com/recent.aspx-/
ISSN: 2235 -767X
3. Database and methodology
To qualify as a smart region, it is necessary to comply with various quantitative indicators that can provide an informed picture of the performance of the regions under consideration. Such indicators should be measurable, comparable, transferable and consistent over all the regions.
In this study, data sets with wealth of information on factors related to the characteristics of the smart regions’ performance have been collected from Noi Italia and Measures of Equitable and Sustainable Well-being (BES) data sets provided by the National Institute of Statistics (ISTAT), covering data from 2009 to 2013. The Noi Italia data set provides a general framework for understanding the different economic, social, demographic and environmental aspects of Italy. It offers a selection of the most interesting statistical indicators, ranging from economy to culture, labour market, household economic conditions, public finance and environment. The BES data set is part of the international debate on “GDP and beyond”, and it is based on the central idea that economic parameters alone are inadequate to evaluate the progress of societies. These data sets integrate the indicators of economic activity (GDP) with measures of basic social and environment dimensions of well-being, together with measures of inequality and economic, social and environmental sustainability. In order to compare the regional characteristics, and to identify the “smartness” indicators that play a critical role in the creativity performance of the smart regions in a comparative way, it was pertinent to focus on the performance of a broad range of “smartness” indicators, rather than on only one aspect of smart regional development and performance.
For this study, it was necessary to decide to have a starting point in the selection of the variables to focus on the identified critical “smartness” characteristics and indicators for the next operational step (Cohen and Levinthal, 1990; Coe et al., 2001; Graham and Marvin, 2001; Florida, 2002; Berry and Glaeser, 2005; Poelhekke, 2006; Southampton City Council, 2006; Abreu et al., 2008; Nijkamp, 2008; Glaeser and Berry, 2006; Shapiro, 2008; Caragliu et al., 2011), for the use of SOM neural network analysis.
A recent and interesting project conducted by the Centre of Regional Science at the Vienna University of Technology (2007) was helpful in this task as it identified five main dimensions. These dimensions were: smart economy, smart mobility, smart people, smart living and smart environment. To describe a smart region and its five characteristics it is necessary to develop a transparent and easy hierarchical structure, where each level is described by the result of the level below. These five dimensions are connected with traditional regional and neoclassical theories of urban growth and development. In particular, the dimensions are based on theories of regional competitiveness, transport and ICT economics, natural resources, human and social capital, quality of life and participation of society members in regions, respectively. Following the approach of Lombardi et al. (2012), the five components have been associated with different aspects of regional life, as shown in Table 1.
The smart economy has been associated with the presence of industries in the field of ICT, or employing ICT in production processes. Aspects referring to the preservation of the natural environment in the region are extensively covered in Gliffinger et al. (2007) and Albino and Dangelico (2012). Following this, each of these five main dimensions was subdivided into relevant and measurable indicators, so that finally a strictly consistent and tested data set of 15 indicators for 20 Italian regions was created for the 2009-2013 period. Table 2 offers an overview of the main categories of performance indicators used in this study.
All the details can be found in the above-mentioned report. The selection of regional-level indicators was mainly based on theoretical assumptions and on the availability of data for the regions of interest.
European Journal of Business and Social Sciences, Vol. 5, No. 09, December 2016. P.P. 84 - 99 URL: http://www.ejbss.com/recent.aspx-/
ISSN: 2235 -767X
The SOM approach has been used to arrive at a better understanding of the structure and short-term evaluation of the information contained in the database, reflecting some of the definitions of smart regions given in the literature. In modern quantitative statistical analysis in the social sciences, the concept of SOM analysis has become increasingly popular. The SOM is a special kind of unsupervised computational neural network (Fischer, 2001 and Skupin et al., 2008) that combines both data projection (reduction of the number of attributes or dimensions of the data vectors) and quantization or clustering (reduction of the number of input vectors) of the input space without loss of useful information, while preserving the topological relationship in the output space. This section briefly explains the general idea and functioning of the basis SOM algorithm. For a complete and rigorous treatment of the SOM methods, the reader is referred to Kohonen (2001).
The output of SOM can be thought of as a spatial representation of the statistical relations between the observations; in this map, the axes are not north-south or east-west but measures of statistical similarity, which is expressed in the distance between observations. It is employed for two main purposes: (1) to visualize complex data sets by reducing their dimensionality; (2) to perform cluster analysis in order to group similar observations into exclusive sets. It was first developed at the beginning of the 1980s (Kohonen, 1982).
Before detailing the actual procedure, it is helpful to clarify a couple of concepts that will be used throughout the explanation. The first is that of input space (called signal space), which refers to the set of input data employed to feed the algorithm; typically, the observations are multidimensional, and are thus expressed by using a vector for each of them. The second concept is that of output space, which defines the low-dimensional universe in which the algorithm represents the input data. What the algorithm does is to map the input space onto the output one, keeping all the relevant information and ordering observations in a way, such that topological closeness in the output space implies statistical similarity in the input space. The dataset to train the SOM algorithm is obtained from a matrix X, whose generic element xijt is the value
assumed by the i-region for the j-variable at the t-time. This allows us to analyse the dynamics of the phenomenon in the last years, based on the available data. Data were normalized within each considered variable, in order to avoid possible distortions due to different ranges and magnitudes. The key element of a SOM network is the Kohonen Layer (KL), which is made up of spatially ordered Processing Elements (PE). The global state of the layer evolves during the learning process, identifying each PE as a representative pattern of the input data, through an unsupervised learning technique. A vector is associated with the generic PE in the KL, whose elements are the weights relative to the patterns identified. The weight vector associated with the generic PEr in the KL is indicated by Wr = (wr1, wr2, …, wrN).
‘Closeness’ of vectors can be expressed in terms of several different possible metrics. Although several definitions of a neighbourhood are available, a convenient metric is based on the Euclidean distance d between the PE on the KL. Basically, the function h(d), describes how the generic PE will update, starting from the associated weights array Wr (and from the size of the error X – Wr): W(d) = h(d) × (X – Wr)
For each given PE in the KL, there is a set of items (input data), which, if submitted iteratively to the SOM during the learning process, make the given PE the most representative pattern of them. These items define a region over the KL: near-by input data tend to map onto the same PE, or more generally, within the same neighbourhood of PE (see Figure 1).
European Journal of Business and Social Sciences, Vol. 5, No. 09, December 2016. P.P. 84 - 99 URL: http://www.ejbss.com/recent.aspx-/
ISSN: 2235 -767X
Neighbourhood is defined in the two dimensional space of the PE of the KL, whatever the dimensionality of the input space. The learning criterion, therefore, cannot be geometrically invariant with respect to the dimensionality of the input space. The clustering with SOM keeps the relations of similarities across the observed objects, defining that a continuous space is differently populated in terms of frequency of the original objects. The training of the SOM neural network produces one Feature Map for each variable, similar to that depicted in Figure 2.
Contrary to what is achieved through a multidimensional analysis, we obtained a threefold result characterized by:
a) A new measure of the feature’s relevance for a definite cluster.
b) A new relation between levels of presence for one or more features and the multidimensional similarity for the regions in terms of socio-economic profiling (the neighbourhood above the KL);
c) A definition for the agglomeration of regions, in terms of presence in the same neighbourhood of the KL (SOM codebooks).
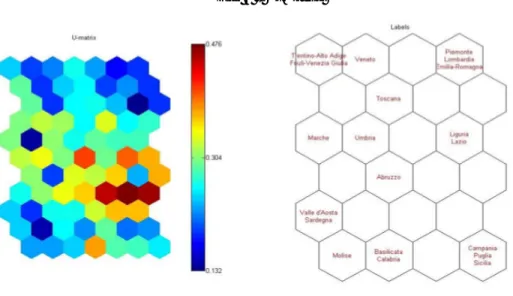
The unified distance matrix (U-matrix), which is a representation of the results of the SOM neural network analysis, provides an interesting outcome.
4. Smart regions performance results
In this section, the results from the SOM analysis applied to the above-mentioned data sets on smart regions are presented, for a better understanding of the structure and short-term evolution of the information contained in the databases. There are two parts to this approach: the first one is focused on the U-Matrix, which represents the results of the SOM neural network analysis, which provides interesting outcome; in the second one, the link between the Italian regions and the variables employed in the analysis is shown.
During the first step, the position of Italian regions on the map was taken into consideration. It seemed to be stable over the considered period. From the U-Matrix, it is possible to point out three main groups of regions, which had geographical and socio-economic characteristics in common (see Figure 3). The colour of the cells on the map represents the cluster homogeneity degree: the cold colours reveal low intra-cluster homogeneity, while the warm colours reveal a lack of homogeneity.
Based on the cells colours and the position of the cluster in the map, the distance among regions, in terms of multidimensional similarity, is rather heterogeneous. The first group in Figure 3 is situated in the upper part of the map: it includes mainly the northern Italian regions (Cluster A). The second, represented in the hexagonal cells of the lower part on the right of the map, consists of the regions of southern Italy (Cluster B). Finally, another group, including Valle D’Aosta, Sardinia and Molise, lies bottom left of the chart (Cluster C).
The regions belonging to the first cluster were far from regions of the other clusters. There were a consistent number of warm-coloured cells among the clusters, representing an increase in distance between the cells of the Kohonen layer containing the Italian regions. This provision accurately reflects the socio-economic division present in the Italian regions: the regions of northern Italy are more developed than the southern ones.
European Journal of Business and Social Sciences, Vol. 5, No. 09, December 2016. P.P. 84 - 99 URL: http://www.ejbss.com/recent.aspx-/
ISSN: 2235 -767X
The next step involved the component variables and the relationship between the Italian regions and the variables employed in the analysis, in order to give an idea of the characteristics of the different regions in the SOM analysis. As it will be seen later in detail, during the analysis the fifteen indicators were divided into the five-macro components, as mentioned above. The analysis showed the leadership of the northern Italian regions in general terms. The colour of the cells in the feature maps represents the value of the indicators: a low value in correspondence with cold colours and high values to warm ones. The position of the regions in Kohonen layer is preserved in the feature mapping.
The first set of considered indicators revealed a low level of technology and innovation infrastructures in the second and third cluster, at the bottom of the map. Cluster A showed a higher value of Italian R&D personnel, due to the greater efficiency in investing, increasingly, more resources in the R&D field from the regions of northern Italy than in the south. This increased efficiency was reflected in the greater share of resources devoted to the R&D sector (with respect to GDP), increasing from 1.83% in 2009 to 1.92% in 2013; where the highest percentage of these expenditures was concentrated in the north of the country, while the south and the islands showed values lower than the national average. This correlation is shown through a correspondence in the two variables chart patterns (see Figure 4).
While Cluster B and part of Cluster C were characterized by a low value of patents, between 2005 and 2011, Emilia-Romagna registered the sharpest fall in the number of patents per million inhabitants. While the decrease affected all geographical areas, the territorial distribution of patent applications still showed a disadvantage in the south and in the islands.
These investments had multiplier effects as they trigger opportunities to grow secondary sectors and services while injecting liquidity into the market, ultimately serving to create a more sustainable socio-economic environment.
The second one reflects the higher concentration of length of motorways in the upper right side of the map belonging to the regions of Cluster A. In these regions, this phenomenon can be seen as flexible on-demand services where, for example, smaller vehicles and bus journeys without passengers are avoided. The operator with the aim of reducing travel times for users, for example, can use the resources, which are freed in this way. Indeed, regions belonging to Cluster C, are characterized by a high concentration of railway networks in use where the availability of this network is substantially similar in the centre-north and the south but it becomes more privileged in regions with a geography devoted to mountainous elevations, such as in Valle D’Aosta and Molise (see Figure 5).
Comparing the two sets of variables, a correspondence between total R&D expenditure, Italian R&D personnel and length of motorways can be seen, implying a correlation between them. Businesses and governments are starting to recognize the role of technology in meeting the goals of urban infrastructure provisioning, both today and in the long term. Previous centuries saw industrial infrastructure, such as railways, roads, and telephone lines preparing the way for new connections among regions. An intelligent solution ensures more equitable access to services, an aspect in which several one-off urban development projects today are found wanting.
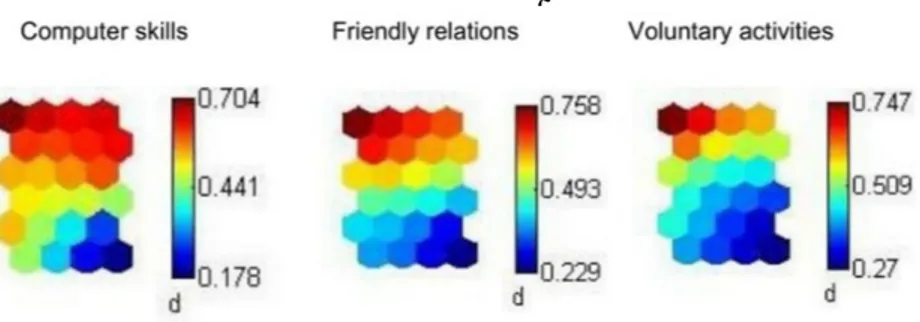
The third unit of indicators showed a low level of education and open-mindedness variables, especially in Cluster B, since the share of poorly educated adults was nearly 50% in the south, with the participation of the same to lower educational activities than the other areas. Despite progress in recent years, for early
European Journal of Business and Social Sciences, Vol. 5, No. 09, December 2016. P.P. 84 - 99 URL: http://www.ejbss.com/recent.aspx-/
ISSN: 2235 -767X
school leavers the huge gap remains high, with a distance of almost nine percentage points between the northeast and the south, where the incidence is higher. In Sicily and Sardinia, about one in four young people are not in education after secondary school. As for the participation of 15-24 year olds in the education system, the south is divided by about nine percentage points (with the lowest value in Basilicata). The number of 30-34 year-olds with a university degree was differentiated in the territories; in 2015 the indicator for the centre-north was placed above the national average in almost all regions, while in the south it was more than five percentage points below (see Figure 6).
The upper-left part of Cluster A presents the highest level of the participation of people aged 14 and over in unpaid work for voluntary groups. This is because in those regions the informal networks, which include all the relationships that gravitate around individuals, put in place human and material resources to provide support and protection both in everyday life and in critical moments and periods of discomfort, representing an essential element of social cohesion.
The fourth unit illustrates that, with respect to the Municipal Government, current spending on cultural heritage management and the separate collection of municipal waste, relative to the regions at the top-left of the maps, showed the highest values (see Figure 7).
In this sense, the degree of conservation of landscapes recognised to be of historical value (equally to what happens for the consistency of the artistic and monumental heritage) is connected to the ability of a territory to represent a source of wellbeing for the community, thanks to the richness of its cultural heritage and landscape. As demonstrated by active local associations and by the two chart patterns of the first and last variable of this set, the protection of landscape is also an important factor of social gathering, and it is strongly linked to the quality of life, like the increase of the promotion of the municipal waste collection. Finally, the variables summarizing the quality of life of the Italian regions showed the highest levels in Cluster B, especially in the income distribution inequality.
As we can see from the above Figure 8, Sicily showed a high concentration of income, with a Gini Index of 0.365. The more equally distributed income was found in the Valle D’Aosta and Friuli – Venezia Giulia, regions where the average income was very close to, although slightly higher than, the national rate. In the last year, Basilicata ranked among the top ten regions for equitable distribution; in the northern regions, Liguria was one that showed the highest levels of income concentration, similar to that of Calabria.
A general correspondence emerged between two variables, pollution and the presence of crime risk, summarizing the level of construction of individual and community wellbeing, respectively. This showed an increase from individuals in the perception of port pollution in all regions and an increased proportion of families who perceived their risk of being in a crime area (especially in the centre and north). However, a perfect overlapping was not shown with respect to the other variables; this seems indicate the presence of a non-linear relationship among the presumed smartness components and some presumed key-factors in the Italian regions over the considered period.
European Journal of Business and Social Sciences, Vol. 5, No. 09, December 2016. P.P. 84 - 99 URL: http://www.ejbss.com/recent.aspx-/
ISSN: 2235 -767X
5. Conclusion and recommendations
In this paper, an overview of the concept of the ‘smart region’, with a critical review of the previous economics and planning approaches to this concept has been given. Subsequently, we considered the Italian regional components between 2009 and 2013, and analyzed them using a SOM approach. The most relevant insight that can be drawn from the SOM analysis is the idea that regions of northern Italy may increasingly be defined as “smart”.
Regions are turning into the geographical hubs (virtual and real) of a modern networked space-economy. They are the source of progress and global orientation and, hence, deserve the full attention of economists, geographers, planners, sociologists, political scientists and urban architects. Thus, cities – and, more generally, metropolitan areas – will continue to be engines of economic growth, creativity and innovativeness. Clearly, R&D expenditures and investments in education and knowledge will be essential in this context, as these elements are the key ingredients for the increase of productivity at local and regional levels. This calls for pro-active and open-minded governance structures, with all actors involved, in order to maximize the socio-economic and ecological performance of areas, and to cope with the negative externalities and historically grown path dependencies.
European Journal of Business and Social Sciences, Vol. 5, No. 09, December 2016. P.P. 84 - 99 URL: http://www.ejbss.com/recent.aspx-/
ISSN: 2235 -767X
References
1. Abreu, M., Grinevich, V., Kitson, M. and Savona, M. (2008), Absorptive capacity and regional patters of innovation, Research report DIUS RR-08-11, Cambridge, MA: MIT.
2. Acs, M., de Groot, H. L. F., and Nijkamp, P. (eds) (2002), The emergence of the knowledge economy, a regional perspective, Berlin, Springer.
3. Albino, V., and Dangelico, R. M. (2013)into Practice in Simpson, R., and Zimmermann M. . (Eds.), The Economy of Green Cities: A World Compendium on the Green Urban Economy, Dordrecht, Netherlands: Springer Science Business Media B. V.
4. Audretsch, D. B. (1998), Agglomeration and the location of innovative activity, Oxford review of economic policy, 14(2), 18-29.
5. Ballas, D (2013), What Makes a ‘Happy City’ ?, Cities, 12, 1, 39 – 50. Begg, I. (1999), Cities and competitiveness, Urban Studies, 1(5-6), 795 –810.
6. Begg I. (1999): Cities and Competitiveness, Urban Studies, 36(5-6), S. 795-810.
7. Berry, C. R. and Glaeser, E. L. (2005), The divergence of human capital levels across cities, Papers Regional Science, 84(3), 407 – 444.
8. Bolisani, E. and Scarso, E. (2000), Electronic communication and knowledge transfer, International journal of technology management, 20, 116 – 133.
9. Camagni, R. (1991), Technological change, uncertainty and innovation Networks: Towards Dynamic Theory of Economic Space, Regional Science, Chapter 10, 211-249, Springer.
10. Caragliu, A., Del Bo, C., and Nijkamp, P. (2011), Smart Cities in Europe, Journal of Urban Technology, 18(2), 65-82.
11. Caragliu, A. and Nijkamp, P. (2008), The impact of regional adsorptive capacity on spatial knowledge spillovers, Tinbergen Institute Discussion Papers 08-119/3, Amsterdam: Tinbergen Institute. 12. Coe, A., Paquet, G. and Roy, J. (2001), E-governance and smart communities: a social learning
challenge, Social science computer review, 19(1), 80-93.
13. Cohen, W., and Levinthal, D. (1990), Absorptive capacity: a new perspective on learning and innovation, Administrative science quarterly, 35(1), 128-152.
14. Cohen, J., and Paul, C. J. M. (2005), Agglomeration economies and industry location decisions, Regional science and urban economics, 35, 215-237.
15. Fischer, M. M. (2001), Computational neural networks: tools for spatial data analysis, in Fischer, M. M., Leung Y. (Eds.), Geocomputational modelling: techniques and applications, Heidelberg: Springer, 79-102.
16. Florida, R. L. (1995), Towards the learning region, Futures, 27(5), 527-536.
17. Florida, R. L. (2002), The rise of the creative class: and how it’s transforming work, leisure, community and everyday life, New York: Basic Books.
18. Franken, K., Oort, F. van and Verburg, T. (2007), Related variety, unrelated variety and regional economic growth, Regional Studies, 41(5), 685-697.
European Journal of Business and Social Sciences, Vol. 5, No. 09, December 2016. P.P. 84 - 99 URL: http://www.ejbss.com/recent.aspx-/
ISSN: 2235 -767X
19. Giffinger, R., Fertner, C., Kramar, H., Kalasek, R., Pinchler-Milanovic, N., and Meijers, E. (2007), Smart Cities: Ranking of European Medium-sized Cities, Vienna: Centre of Regional Science.
20. Glaeser, E. L., and Berry, C. R. (2006), Why are smart places getting smarter?, Cambridge, MA: Taubman Centre Policy Brief 2006-2, Taubman Centre.
21. Glaeser, E. L. (2005), A review of Richard Florida’s ‘The rise of the creative class’, Regional Science and Urban Economics, 35, 593-596.
22. Graham, S., and Marvin, S. (2001), Telecomminications and the city: electronic spaces, urban place, London: Routledge.
23. Hollands, R. G. (2008), Will the real smart city please stand up ?, City, 12(3), 303- 320.
24. Kohonen T. (1982), Self-organized formation of topologically correct feature maps, Biological cybernetics, 43(1), 59-69.
25. Kohonen T. (2001), Self-Organizing Maps, Springer Verlag, Berlin, Heidelberg.
26. Komninos, N. (2002), Intelligent cities: innovation, knowledge systems and digital spaces, London: Spon Press.
27. Lombardi, P., Giordano, S., Farouh, H., and Yousef, W. (2012), Modelling the Smart City Performance, Innovation: The European Journal of Social Science Research, 25(2), 137-149.
28. Mori, K. and Christodoulou, A. (2012), Review of Sustainability Indices and Indicators: Towards a New City Sustainability Index (CSI), Environmental Impact Assesment Review, 32(1), 94-106.
29. Nijkamp, P. (2008), E pluribus unum, Research Memorandum, Faculty of Economics, VU University, Amsterdam.
30. OECD – EUROSTAT (2005), Oslo Manual, Paris: Organization for Economic Cooperation and Development – Statistical Office of the European Communities.
31. OECD (2001), Cities and regions in the new learnig economy, Paris: Organization for economic Cooperation and Development.
32. Parkinson, M., Hutchins, M., Simmie, J., Clark, G. and Verdonk, H. (Eds.) (2003): Competitive European Cities: Where Do The Core Cities Stand?.
33. Poelhekke, S. (2006), Do amenities and diversity encourage city growth? A link through skilled labor, Working Papers ECO2006/10, San Domenico di Fiesole: European University Institute.
34. Shapiro, J. M. (2008), Smart cities: quality of life, productivity, and the growth effects of human capital, The review of economics and statistics, 88(2), 324-335.
35. Skupin, A., Agarwal P. (2008), Introduction: What is a Self-Organizing Map?, in Agarwal P., Skupin A. (Eds.), Self-Organising Maps: Applications in Geographic Information Science, Chichester, England: John Wiley & Sons, Ltd. 1-20.
36. Southampton City Council (2006), Southampton on-line, Available from: http://www.southampton.gov.uk/thecouncil/thecouncil/youand- council/smartcities/.
37. Thornely, A. (2000), Strategic Planning in the Face of Urban Competition, in Salet, W., Faludi A. (Eds.), The Revival of Strategic Spatial Planning. Proceedings of colloquim, Royal Netherlands Academy of Arts and
European Journal of Business and Social Sciences, Vol. 5, No. 09, December 2016. P.P. 84 - 99 URL: http://www.ejbss.com/recent.aspx-/
ISSN: 2235 -767X
Figures
Fig. 1 – Input Layer and Kohonen Layer
Source: authors’ representation
Fig. 2 – Feature map example
Source: authors’ representation
Fig. 3 – U-Matrix
European Journal of Business and Social Sciences, Vol. 5, No. 09, December 2016. P.P. 84 - 99 URL: http://www.ejbss.com/recent.aspx-/
ISSN: 2235 -767X
Fig. 4 – Feature mapping for smart economy
Source: authors’ computation and representation based on Noi Italia and BES databases
Fig. 5 – Feature mapping for smart mobility
Source: authors’ computation and representation based on Noi Italia and BES databases
Fig. 6 – Feature mapping for smart people
European Journal of Business and Social Sciences, Vol. 5, No. 09, December 2016. P.P. 84 - 99 URL: http://www.ejbss.com/recent.aspx-/
ISSN: 2235 -767X
Fig. 7 – Feature mapping for smart environment
Source: authors’ computation and representation based on Noi Italia and BES databases
Fig. 8 – Feature mapping for smart living
Source: authors’ computation and representation based on Noi Italia and BES databases
Tables
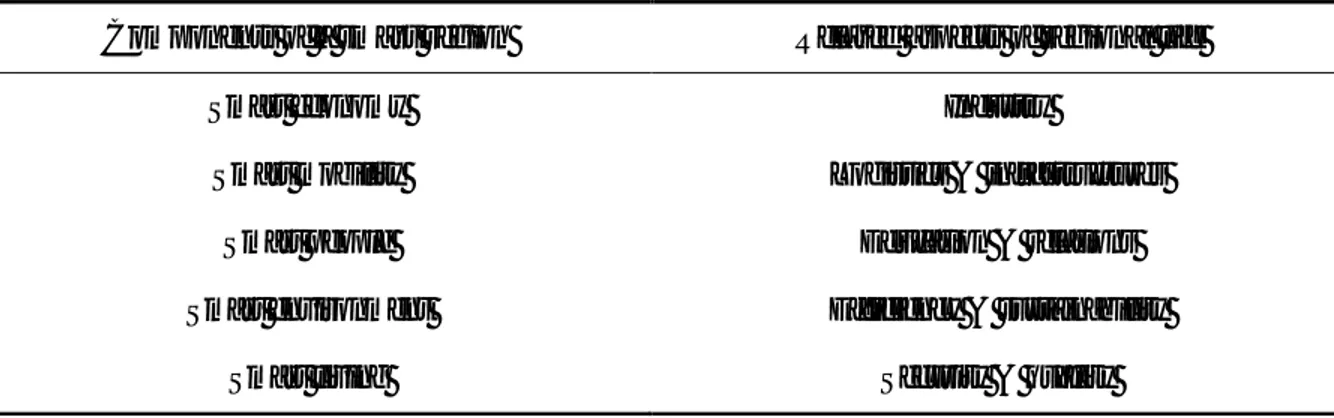
Tab. 1 - Components of a smart region and related aspects (adapted from Lombardi et al., 2012)
Components of a smart region Related aspects of regional life
Smart economy Industry
Smart mobility Logistics & infrastructures
Smart people Education & relations
Smart environment Efficiency & sustainability
European Journal of Business and Social Sciences, Vol. 5, No. 09, December 2016. P.P. 84 - 99 URL: http://www.ejbss.com/recent.aspx-/
ISSN: 2235 -767X
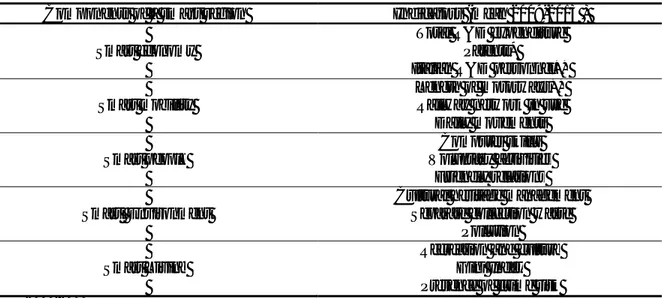
Table 2. List of performance indicators
Components of a smart region Indicators (mean 2009-2013 )
Total R&D expenditure
Smart economy Patents*
Italian R&D personnel** Length of motorways**
Smart mobility Railway network in use
Daily movements Computer skills
Smart people Voluntary activities
Friendly relations Cultural heritage management Smart Environment Separate collection waste
Pollution Recreation and culture
Smart Living Gini Index
Presence of crime risk
* mean 2009-2011