INSTITUTIONAL INVESTORS’ ACTIVISM UNDER
CONCENTRATED OWNERSHIP AND THE ROLE OF
PROXY ADVISORS. EVIDENCE FROM THE
ITALIAN SAY-ON-PAY
Massimo Belcredi*, Stefano Bozzi*, Angela Ciavarella**, Valerio Novembre**
*Catholic University “Sacro Cuore”, Italy
**The Italian Securities and Exchange Commission (CONSOB), Italy
1. INTRODUCTION
Institutional investors have become increasingly important as equity holders in the most developed financial markets. At the same time, their role has often changed from passive shareholders to active participants in the governance of listed firms (Gillan & Starks, 2000). Empirical evidence on engagement by institutional investors is mostly limited to the US and UK; little research is available for Continental European countries, although differences both in firm ownership structure and in the institutional context may induce a different behaviour by institutional investors.
Concentrated ownership prevails in continental European firms: within this context outside shareholders have no simple way to influence corporate decisions. This may, on one hand, favour rational apathy, and generate limited minority
shareholder dissent at General Meetings (GM). On the other hand, lower investor protection in Continental Europe (Djankov, La Porta, Lopez-de-Silanes, & Shleifer, 2008) may create additional risk of minority shareholder expropriation and generate incentives for active, institutional investors to engage with companies and to scrutinize GM decisions more closely.
It is often claimed that shareholder dissent at European general meetings is low, except in a handful of cases2, and that institutional investors tend to remain passive, since the costs of activism tend to outweigh the benefits. But is this really the case? In recent years, regulation created new occasions for shareholders to express their voice (Masouros, 2010). The possibility to vote on a firm’s
2 Evidence from Renneboog and Szilagyi (2013) indicates that in the main European countries management proposals get on average between 95 and 100 percent of favourable votes.
Abstract
How to cite this paper: Belcredi, M.,Bozzi, S., Ciavarella, A. and Novembre, V. (2017). Institutional investors’ activism under concentrated ownership and the role of proxy advisors. Evidence from the Italian say-on-pay. Corporate
Ownership & Control, 14(4), 41-57.
http://dx.doi.org/10.22495/cocv14i4art4
Copyright © 2017 by Authors and Virtus Interpress
This work is licensed under the Creative Commons Attribution International License (CC BY 4.0). http://creativecommons.org/licenses/by /4.0/ ISSN Online: 1810-3057 ISSN Print: 1727-9232 Received: 20.03.2017 Accepted: 24.05.2017 JEL Classification: G23, G32, G34, G38 DOI: 10.22495/cocv14i4art4
Where corporate ownership is concentrated, the incentives for institutional shareholders to engage with firms in their portfolio are not clear a priori. Making use of a unique dataset of Say-on-Pay (SOP) votes in Italian listed firms, we provide evidence that specific classes of institutional investors do actively monitor investee firms under concentrated ownership, and that Proxy Advisors (PAs) perform an informational role: i) while general shareholder dissent on SOP is low, dissent by mutual and pension funds holding small equity positions (nonblockholders) is high; ii) nonblockholders’ dissent is negatively correlated with ownership concentration, suggesting that they tend to trust control shareholders to act as delegated monitors on managerial remuneration; iii) voting by institutional investors is strongly correlated with PA recommendations; iv) institutional investors do not follow PA recommendations blindly but look at specific reasons of concern expressed in PA reports. Our results may have relevant policy implications.
Keywords: Shareholder Activism, Institutional Investors, Proxy Advisors, Say-On-Pay, Corporate Governance
Acknowledgements: The authors thank International Shareholder Services (ISS) and Glass, Lewis & Co. (GL) for providing them with 2012 proxy season reports for Italian listed firms. They also thank Lorenzo Caprio, Ettore Croci, Alfonso Del Giudice, Nadia Linciano and Giovanni Siciliano for useful comments and Stefano Libera for research assistance. Opinions expressed in this paper are exclusively the authors’ and do not necessarily reflect those of CONSOB.
remuneration policy (briefly: Say-on-Pay, or SOP) is among them. It has been argued that SOP looks like a promising battlefield in particular for small, uncoordinated shareholders, which otherwise would hardly have an opportunity to give feedback to management (Schwarcz-Ziv and Wermers, 2015). Furthermore, institutional investors are subject to a growing pressure to exercise their stewardship responsibilities and actively engage with listed firms. Finally, proxy advisors (PAs) operating as information intermediaries offer investor services that potentially reduce the transaction costs of activism. Proxy advisors cover a growing number of listed companies in the main European countries (Hitz & Lehmann 2017).
Only anecdotal evidence exists on institutional investors’ engagement in Europe. In this paper, we use the introduction of Say-On-Pay (SOP) legislation in Italy as a natural experiment to investigate institutional shareholder activism in a continental European country characterised by concentrated ownership. Making use of a unique dataset, we analyse how different classes of investors (in particular, institutional investors) voted on a key engagement issue (namely the remuneration policy for directors and managers, or Say-On-Pay) in 2012, and how their vote is related to Proxy Advisors’ recommendations.
More specifically, we investigate three main issues: a) dissent by different classes of shareholders, with a particular focus on institutional investors; b) the mechanics of such activism at the Shareholders’ Meeting (namely, the main drivers of voting decisions and whether they are correlated with PA voting recommendations) and c) whether institutional investors implement PA recommendations passively or, instead, look at specific elements relevant to their own concerns.
Our main results may be summarised as follows. First, while SOP shareholder dissent in Italy is low, in line with other developed countries, dissent is surprisingly high amongst institutional investors, in particular amongst asset managers (typically, internationally diversified mutual and pension funds) holding small equity stakes (nonblockholders). They are comparatively more likely to dissent when they have concerns about some aspect of managerial remuneration (in particular, when CEO remuneration is “high”).
Secondly, institutional shareholders’ dissent is negatively correlated with ownership concentration: the higher the stake held by the controlling shareholder, the stronger her incentive alignment with minority investors, at least as far as managerial remuneration is concerned. This relationship is strong and significant for nonblockholders, but not for institutional investors holding larger stakes. Our evidence is consistent with small institutional investors trusting control shareholders to act as delegated monitors on CEO remuneration and to generate shared benefits of control.
Thirdly, institutional shareholders’ vote is strongly correlated with PA recommendations; this is particularly true for nonblockholders, which have lower incentives to carry out autonomous research. The influence of Proxy Advisors seems at least as strong as in the US; this is consistent with the high weight of non-domestic institutions within the set of institutional shareholders attending GMs of Italian listed companies (CONSOB, 2016).
Finally, institutional investors do not follow PA recommendations blindly; on the opposite, they look
at the specific reasons for concern expressed by proxy advisors; in particular, they seem to pay particular attention to the governance of CEO remuneration (i.e. the composition of Remuneration Committee), to the structure of the pay policy and, especially, to severance pay.
We contribute to the existing literature in several ways. First, to the best of our knowledge, this is the first paper to analyse institutional investors’ voting decisions outside the US, and specifically in a continental European country characterised by concentrated ownership. We show that SOP dissent of institutional investors is not lower than in Anglo-Saxon countries and is actually influenced by several factors, including ownership concentration. Moreover, from a methodological viewpoint, this is the first paper to perform an analysis of the votes actually cast by institutional investors at the GM. Differently, from previous studies (Ertimur, Ferri, & Oesch, 2013), we are able to identify how each institutional investor actually voted and, therefore, to investigate directly the drivers of voting decisions (including the influence of PA recommendations). Finally, our methodology allows us to differentiate how different classes of investors actually voted and to show that institutional investors (in particular, nonblockholders) are definitely more “active” than the average shareholder.
Our results are potentially relevant for a number of policy issues, including shareholder engagement with listed firms, regulation of Say-on-Pay and of the Proxy Advisory industry, currently debated both at the EU level and in the individual Member States.
The rest of the paper is organised as follows. Section 2 presents the related literature and briefly describes the Italian institutional framework. Section 3 describes our sample and presents descriptive statistics. Sections 4 and 5 present our econometric strategy and results. In particular, they analyse if (and how) different categories of shareholders vote on Say-on-Pay and their relation with several variables, including Proxy Advisors’ recommendations. Section 6 concludes.
2. LITERATURE REVIEW AND INSTITUTIONAL
BACKGROUND
Shareholder engagement at GMs may act as a disciplinary mechanism for management and help mitigating agency problems (Bebchuk, 2005; Rho, 2007). When ownership is dispersed, as in the typical US public company, small shareholders have little incentive to monitor managerial decisions, due to well-known free-rider problems (Grossman & Hart, 1980; Jensen & Meckling, 1976). Large investors, holding large debt and/or equity positions in a company, may help realign the divergent interests of managers and owners (Gillan & Starks, 2000). Institutional investors are a likely candidate for this active role: their stake in the ownership in US equities increased from about 10% in 1953 to over the 70% in 2006 (Gillan & Starks, 2007). A vast empirical literature scrutinized the role played by active institutional investors, with mixed results: some papers show that activism effectively benefits shareholders as a class (Becht, Franks, Mayer, & Rossi, 2009; Brav, Jiang, Partnoy, & Thomas, 2007; Buchanan, Netter, Poulsen, & Yang, 2012), while others argue that it may decrease value by distracting managers from long-term objectives
(Black, 1998; Gillan & Starks, 2007; Karpoff, 2001). Other contributions analyze which firms are the most likely target for active investors and how do they respond to engagement efforts (Carleton, Nelson, & Weisbach, 1998; John & Klein, 1995; Karpoff, Malatesta, & Walkling, 1996; Ong, Petrova, & Spieler, 2010; Smith, 1996; Thomas & Cotter, 2007); finally, some studies analyze the main issues of interest to active investors and how they changed over time (Gillan & Starks, 2000).
Most of this literature focused on countries where ownership is typically dispersed (the US and the UK). Little is known about institutional investor activism in Continental Europe, although notable differences in regulation and firm ownership structure may affect investors’ behaviour. High ownership concentration may discourage minority shareholders activism in European firms since their vote is unlikely to influence the final voting outcome (Renneboog & Szilagyi, 2013). On the other hand, under concentrated ownership, the typical agency problem faced by institutional investors is the risk of expropriation by controlling shareholders (Villalonga & Amit, 2006), possibly colluding with management (Burkart, Gromb & Panunzi, 1997; Burkart, Panunzi, & Shleifer, 2003). This conflict of interest, associated with lower investor protection than in Anglo-Saxon countries, may provide minority shareholders with additional incentives to monitor managerial and also GM decisions (La Porta, López-de-Silanes, Shleifer, & Vishny, 1998), counterbalancing rational apathy. As a result, the overall sign of the effect of ownership concentration on institutional investor activism is not easy to predict a priori.
Empirical research on continental Europe is quite limited, largely due to data availability constraints3. Papers issued by policy makers (European Commission, 2006; Hewitt, 2011) find a high turnout and a low dissent at GMs of listed firms. Academic papers analysing GM activism4 show that cases of investor activism are few and not particularly effective. De Jong et al. (2005) report the absence of shareholders’ proposals in the Netherlands and also a limited degree of dissent on management proposals. Cziraki, Renneboog, and Szilagyi (2010) examine shareholder proposals submitted in Europe and find systematic underperformance of the (few) companies targeted by active shareholders and no market reaction to such form of activism. This result is confirmed by Buchanan et al. (2012) for the UK market. More recently, Renneboog and Szilagyi (2013) analysed both management and shareholder proposals submitted at the general meetings of companies from 17 European countries between 2005 and 2010. They found that dissent on management proposals is correlated with the features of relevant national regulation (e.g. companies listed in countries with easier cross-border voting procedures attract more dissent).
A specific stream of literature (mostly based, once again, on US and UK data) focused on
3 A rich US-based literature shows that shareholder activism both at general meetings (e.g. Ertimur et al. 2011; Renneboog and Szilagyi 2011) and behind the scenes (e.g. Bradley et al., 2010; Greenwood and Schor, 2009) plays a useful role in addressing managerial agency problems. An exception is Armstrong, Gow & Larcker (2013), finding that shareholder votes for equity pay plans have little substantive impact on firms’ incentive compensation policies.
4 Evidence on shareholder interventions outside general meetings is provided by Armour (2008) and Becht et al. (2009).
Pay (SOP) votes. According to these studies, a key variable driving dissent is the level of CEO pay. Other relevant variables are pay-for-performance sensitivity, potential dilution from equity grants, firm risk and awarded perquisites (Alissa, 2015; Balsam, Boone, Liu, & Yin, 2016; Carter & Zamora, 2007; Conyon, 2016; Conyon & Sadler, 2010; Ertimur et al., 2013; Faghani, Monem, & Ng, 2015; Kimbro & Xu, 2016). Some papers examine the voluntary introduction of SOP by individual German firms (Eulerich, Rapp & Wolff, 2012; Powell & Rapp, 2015; Troeger & Walz, 2016); in particular, Powell and Rapp (2015) show that the fraction of firms voluntarily adopting a SOP vote decreased over time (from 36.5% in 2010 to 8.5% in 2013). The first study addressing the topic in Italy shows that dissent is mostly affected (negatively) by ownership concentration (Belcredi, Bozzi, Ciavarella, & Novembre, 2014).
The literature on shareholder voting lacks a specific focus on institutional investors’ diversity. As argued by Celik and Isakkson (2013), minority shareholders tend to be seen as a unique block but this is hardly true as different categories tend to follow different patterns. A vast strand of US literature (capitalising on the information available due to mandatory disclosure of item-by-item votes) has shown that mutual funds vary greatly in their voting behaviour, and also in their reliance on PA recommendations (Iliev & Lowry, 2015). However, no comparable evidence is available for European countries, where remarkable differences in the institutional context (e.g. in firm ownership concentration) may induce a different behaviour by institutional investors (Hitz & Lehmann, 2017).
In this paper, we use the introduction of Say-on-Pay (SOP) legislation in Italy as a natural experiment to investigate institutional investors’ engagement with listed firms. Making use of a unique dataset, we analyse the behaviour of different classes of shareholders (in particular, institutional investors) and their relation to PA recommendations.
Say-on-Pay represents an ideal setting to analyse shareholder engagement in connection with the role of PAs. Institutional investors holding diversified portfolios often lack the incentives to cast informed ballots5, since information costs for every item at each GM of each firm in their portfolio may be prohibitively high. In this context, proxy advisors may provide a cost-effective service. This gives rise, however, to the question whether asset managers use actively PA recommendations, focusing on specific bits of information provided in PA reports, or consider engagement and voting as a pure “compliance duty”, and consequently rely passively on the final recommendation – “for” or “against”. This has, in turn, far-reaching implications for the role of proxy advisors: basically, they may either provide useful services to investors in a cost-effective way or may act as delegated monitors, using standardised valuation models, potentially characterised by issues and conflicts of interest.
Our paper is linked to the literature investigating shareholder votes in connection with the role of PAs. A comprehensive picture on these issues is provided by Ertimur et al. (2013), showing that PA voting recommendations affect say-on-pay votes; the sensitivity of shareholder votes to these
5 A thorough analysis of the different business models through which institutional investors operate is performed by Celik and Isaksson (2013).
recommendations varies according to shareholders’ ownership structure, the rationale behind the recommendation and firm characteristics. Other studies, all based on the US experience, confirm a strong association between PA analyses and shareholder votes (Alexander, Chen, Seppi, & Spatt, 2010; Cai & Walkling, 2011; Choi, Fisch, & Kahan, 2009; Larcker, McCall, & Ormazabal, 2013)6. This literature has two main limitations: first, being mostly based on US data, no analysis on countries where ownership concentration is available; second, this literature focuses on the relation between PA reports and shareholder dissent, implying that no direct evidence is available for the voting decisions of institutional investors. Our paper overcomes both these limitations since it is based on a Continental European country where firm ownership is prevalently concentrated and includes data on how each shareholder actually voted.
In Italy we expect a positive correlation between institutional investors’ voting choices and PAs’ recommendation, and a stronger relation in the case of nonblockholders, having stronger incentives to outsource research and analysis activities (Choi et al., 2009; Ertimur et al., 2013), particularly for companies where they hold small equity stakes (Agrawal & Nasser, 2012; Cronqvist & Fahlenbrach, 2009). This is especially true in the case of international funds’ investments in Italian firms, only a tiny minority of which may be considered sufficiently large to justify the investment in independent analysis.
3. SAMPLE
SELECTION
AND
DESCRIPTIVE
STATISTICS
We investigate shareholder voting at the 2012 Annual General Meetings when SOP was first implemented in Italy. Our initial database includes data on shareholder votes (hand-collected from GM minutes) and information on the remuneration policy and directors’ remuneration (also hand-collected from Remuneration Reports) for all companies listed on the Italian Stock Exchange in 2012 (226 firms). We considered only companies for which at least one PA Report (from ISS and/or from GL) was available. This leaves a final sample of 188 companies.
We track different categories of investors separately, since a) they may have different views about the firm remuneration policy; b) they may face different costs (and benefits) from activism, hence have different incentives to engage with companies; c) they may be more or less sensitive to PA recommendations. This implied a lengthy process of hand-collecting and analysing the minutes of Shareholder Meetings (which – in Italy – report how each shareholder voted on each item on the agenda). We are particularly interested in the voting behaviour of institutional investors, which have
6 Larcker et al. (2013) confirm the finding that proxy advisory firm recommendations have a substantive impact on say-on-pay voting outcomes. Cai et al. (2009) examine the factors that determine the percentage of “for” votes cast in uncontested director elections and find that ISS recommendation reduces the vote in favour of directors by 19 per cent. Cindy at al. (2008) analyse the role of ISS in proxy contests and find that its recommendations have a high explanatory power for contest outcomes. Choi et al. (2009) study the significance of the voting recommendations issued by four PAs in connection with uncontested director elections. They find a moderate impact of ISS recommendations on voting outcome (according to their analysis, an ISS recommendation shifts 6-10 per cent of shareholder votes).
often been recognised as a likely candidate for low-cost corporate governance activism (Renneboog & Szilagyi, 2013; Renneboog & Szilagyi, 2011). Following the official definition by Consob (the Italian market watchdog), we include in this category: a) asset managers and pension funds, b) sovereign, hedge and private equity funds, c) banks, d) insurance companies. Institutional investors may, however, adopt different business models and pursue different strategies, also with reference to activism. We further differentiate between blockholders and nonblockholders (according to whether their stake is above/below the mandatory disclosure threshold – 2%). The former tend to hold relatively large blocks of shares in a small number of target firms, and are therefore more likely to engage with management. However, most of these negotiations take place behind closed doors, and dissent will rarely show up at the General Meeting (Becht, Franks, & Grant, 2010; Becht et al., 2009); this will often happen only after negotiations with management have failed. On the opposite, nonblockholders usually hold diversified portfolios and may have no alternative to “voting no” at the GM to express their dissent.
We measure total dissent as the percentage of negative votes cast at the General Meeting (i.e. (Against + Abstain)/Total votes: according to Italian rules, abstentions are counted as negative votes). Recognising that institutional investors often hold only a small fraction of firms’ equity capital, we also use an alternative measure of dissent (well-known by practitioners) calculated as the fraction of negative votes cast by institutional investors alone, i.e. (Inst.Against + Inst.Abstain)/Total Inst.investor votes.
We control for a number of firms’ characteristics. CEO remuneration is measured through total compensation (in log terms); the variable/total compensation ratio, which may be interpreted as a proxy for pay-performance sensitivity; disclosure quality, proxied by an index built on five remuneration disclosure characteristics7. Ownership concentration may have a strong influence on the voting outcome and is measured in terms of cash flow rights (CFR) owned by the ultimate shareholder. We also consider institutional investors’ participation at general meeting (turnout), measured as the percentage of ordinary shares held by institutional investors attending the 2012 GM: we interpret this measure as a proxy of the (otherwise unobservable) ownership stake collectively held by institutional investors (or, alternatively, by block- vs. nonblockhoders) showing up at the GM.
Other control variables include firm size (log of Total assets); growth opportunities (MV/BV); industry (financial/non-financial); firm performance (measured, alternatively, in accounting (last year’s ROA) and market terms (1-year stock return)); risk (standard deviation of stock returns); the quality of corporate governance of the remuneration process (proxied with the existence of a remuneration committee).
Data on ownership structure and board characteristics are drawn from the Consob and the Assonime-Emittenti Titoli Corporate Governance database, while accounting and stock market data come from Datastream-Worldscope. Summary statistics are reported in Table 1, Panel A.
7 Detailed variable definitions are reported in Appendix 1.
Table 1. Panel A: descriptive statistics
Variable n Mean S.D. I Quart. Median III Quart.
Firm Characteristics Total Assets (.000) 188 19,000,000 89,000,000 220,000 720,000 4,500,000 Market Capitalization (.000) 188 1,700,000 5,500,000 64,108 200,000 890,000 M/B 188 0.96 2.99 0.44 0.77 1.38 ROA 188 6% 10% 2% 6% 10% RET1Y (%) 188 27% 8% 22% 28% 33% SQM_RET 188 1.11 0.78 0.59 0.92 1.29 CEO Compensation CEOTotComp (€.000) 188 1,553 2735 353 852 1,603 CEO_%_Variable_Comp 188 22% 25% 0% 14% 37% Ownership Cash_Flow_Rights (%) 188 47% 20% 31% 52% 63%
Institutional Investors turnout
Institutional shareholders turnout 188 12% 15% 0% 5% 17%
Institutional blockholders turnout 188 3% 6% 0% 0% 4%
Institutional nonblockholders turnout 188 9% 13% 0% 3% 12%
Dissent
Total Shareholder Dissent 188 6% 12% 0% 0% 6%
Dissent of institutional shareholders 159 29% 34% 0% 10% 54%
Dissent of institutional blockholders 63 11% 3% 0% 0% 0%
Dissent of institutional nonblockholders 155 32% 34% 0% 17% 63%
Italian listed companies are usually small-medium enterprises: the average (median) firm had total assets around EUR 19,000 (720) million and a market capitalization of EUR 1,700 (200) million. The average (median) CEO total compensation (including fixed and variable pay) was around 1.5 million (852 thousand) Euro, including sums received by subsidiaries and affiliates. Variable compensation was on average the 22% of total compensation. Ownership is typically concentrated: on average, the largest shareholder held a 47% stake. Average total dissent was around 6% of votes cast, i.e. somewhat smaller than that recorded in the first year of mandatory SOP in Anglo-Saxon countries (8.9% in the US in 2011 (ISS, 2011); in the UK, the average dissent in 2003 varied between 7.9% and 16%, depending on the sample used (Alissa, 2015; Carter & Zamora, 2007; Conyon & Sadler, 2010; Ferri & Maber, 2013). A lower dissent is hardly unexpected in Italy since concentrated ownership
prevails and dissent is usually expressed by shareholders who are not part of the control group. Median total dissent is 0%, implying that in over a half of the cases, the remuneration policy received unanimous consent.
Institutional investors’ dissent is, however, much higher: average (median) dissent was around 29% (10%) of the votes cast by this category of shareholders. Consistently with our expectations, average (median) dissent increases further to 32% (17%) amongst institutional nonblockholders (basically, mutual and pension funds), which have no or little alternative to voting at the GM to express their possible discontent.
Some preliminary evidence of the relationship between (institutional) investor dissent and the Proxy Advisors’ analysis of the firms’ remuneration policy arises from the univariate analysis reported in Table 1, Panel B.
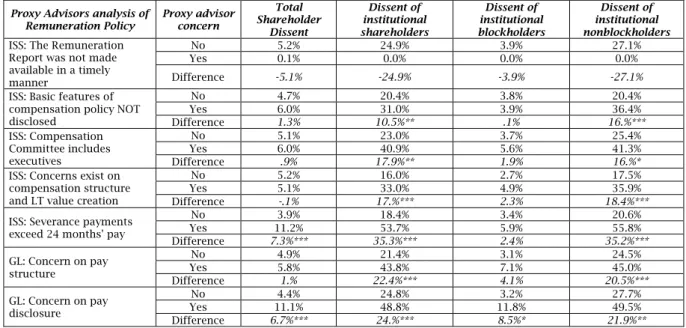
Table 1. Panel B: shareholders dissent and proxy advisors concerns
Proxy Advisors analysis of
Remuneration Policy Proxy advisor concern
Total Shareholder Dissent Dissent of institutional shareholders Dissent of institutional blockholders Dissent of institutional nonblockholders ISS: The Remuneration
Report was not made available in a timely manner
No 5.2% 24.9% 3.9% 27.1%
Yes 0.1% 0.0% 0.0% 0.0%
Difference -5.1% -24.9% -3.9% -27.1%
ISS: Basic features of compensation policy NOT disclosed No 4.7% 20.4% 3.8% 20.4% Yes 6.0% 31.0% 3.9% 36.4% Difference 1.3% 10.5%** .1% 16.%*** ISS: Compensation Committee includes executives No 5.1% 23.0% 3.7% 25.4% Yes 6.0% 40.9% 5.6% 41.3% Difference .9% 17.9%** 1.9% 16.%*
ISS: Concerns exist on compensation structure and LT value creation
No 5.2% 16.0% 2.7% 17.5%
Yes 5.1% 33.0% 4.9% 35.9%
Difference -.1% 17.%*** 2.3% 18.4%***
ISS: Severance payments exceed 24 months' pay
No 3.9% 18.4% 3.4% 20.6% Yes 11.2% 53.7% 5.9% 55.8% Difference 7.3%*** 35.3%*** 2.4% 35.2%*** GL: Concern on pay structure No 4.9% 21.4% 3.1% 24.5% Yes 5.8% 43.8% 7.1% 45.0% Difference 1.% 22.4%*** 4.1% 20.5%*** GL: Concern on pay disclosure No 4.4% 24.8% 3.2% 27.7% Yes 11.1% 48.8% 11.8% 49.5% Difference 6.7%*** 24.%*** 8.5%* 21.9%**
The table presents sample descriptive statistics. All variables are defined in the Appendix. ***, **, * denote significance at the .01, .05, .10 level.
First, the dissent of institutional shareholders, and in particular of institutional nonblockholders, is consistently higher where PAs expressed concerns on the remuneration policy. For example, the dissent of institutional nonblockholders where ISS expressed its concern about Severance payments is on average 55.8%, versus an average of 20.6% in the case of no concern. The difference is statistically significant.
Second, the increase in dissent in the presence of PA concerns is not uniform, but is sensitive to the specific nature of each concern (the only exception is the ISS concern that “Remuneration Report was not made available in a timely manner”; however, this concern was issued only in one company, while no concern was expressed in the remaining 182
cases; as a consequence, the difference in dissent is statistically meaningless). For example, the increase in the dissent of institutional investors is equal to 10.5% in the case of an ISS concern on the quality of disclosure on the remuneration policy, while it is equal to 17,9% when the concern refers to the composition of the Compensation Committee. Although these preliminary results must be validated by the multivariate analysis, it seems that institutional investors do not follow PA recommendations blindly, but critically examine PA reports and adjust their vote accordingly.
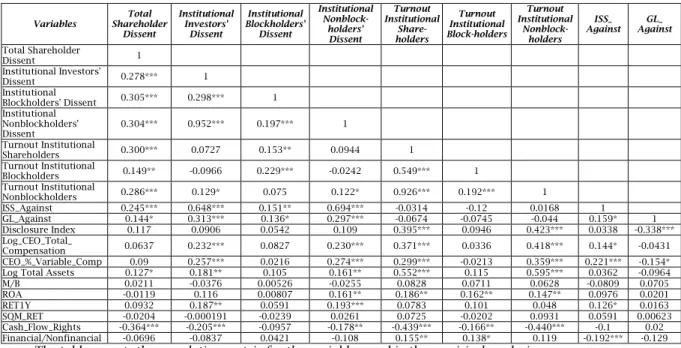
Table 2 reports the correlation matrix for the main variables used in our analysis.
Table 2. Correlation matrix (part 1)
The table reports the correlation matrix for the variables used in the empirical analysis. All variables are defined in the Appendix.
***, **, *, denote significance at the .01, .05, .10 level.
Table 2. Correlation matrix (part 2)
Variables Disclosure Index Log_CEO_Total_ Compensation Variable_ CEO_%_ Comp Log Total Assets M/B ROA 1 Year Stock Returns SQM_
RET Cash_Flow_Rights Nonfinancial Financial/
Total Shareholder Dissent Institutional Investors' Dissent Institutional Blockholders' Dissent Institutional Nonblockholders' Dissent Turnout Institutional Shareholders Turnout Institutional Blockholders Turnout Institutional Nonblockholders ISS_Against GL_Against Disclosure Index 1 Log_CEO_Total_ Compensation 0.295*** 1 CEO_%_Variable_Comp 0.406*** 0.482*** 1
Log Total Assets 0.285*** 0.461*** 0.328*** 1
M/B 0.166** -0.0348 0.0938 -0.0282 1
ROA 0.191*** 0.0969 0.321*** 0.0373 0.241*** 1 1 Year Stock Returns 0.108 -0.0336 0.252*** 0.0315 0.0912 0.286*** 1 SQM_RET 0.0681 0.0211 -0.027 -0.0665 0.0979 0.0569 -0.0399 1 Cash_Flow_Rights -0.196*** -0.169** -0.152** -0.143* 0.103 0.143** 0.0867 0.0361 1
Financial/Nonfinancial 0.00336 0.0419 -0.0561 0.492*** -0.0321 -0.155** -0.12 -0.140* 0.0177 1
The table reports the correlation matrix for the variables used in the empirical analysis. All variables are defined in the Appendix.
***, **, *, denote significance at the .01, .05, .10 level. Variables Shareholder Total
Dissent Institutional Investors' Dissent Institutional Blockholders' Dissent Institutional Nonblock-holders' Dissent Turnout Institutional Share-holders Turnout Institutional Block-holders Turnout Institutional Nonblock-holders ISS_ Against Against GL_ Total Shareholder Dissent 1 Institutional Investors' Dissent 0.278*** 1 Institutional Blockholders' Dissent 0.305*** 0.298*** 1 Institutional Nonblockholders' Dissent 0.304*** 0.952*** 0.197*** 1 Turnout Institutional Shareholders 0.300*** 0.0727 0.153** 0.0944 1 Turnout Institutional Blockholders 0.149** -0.0966 0.229*** -0.0242 0.549*** 1 Turnout Institutional Nonblockholders 0.286*** 0.129* 0.075 0.122* 0.926*** 0.192*** 1 ISS_Against 0.245*** 0.648*** 0.151** 0.694*** -0.0314 -0.12 0.0168 1 GL_Against 0.144* 0.313*** 0.136* 0.297*** -0.0674 -0.0745 -0.044 0.159* 1 Disclosure Index 0.117 0.0906 0.0542 0.109 0.395*** 0.0946 0.423*** 0.0338 -0.338*** Log_CEO_Total_ Compensation 0.0637 0.232*** 0.0827 0.230*** 0.371*** 0.0336 0.418*** 0.144* -0.0431 CEO_%_Variable_Comp 0.09 0.257*** 0.0216 0.274*** 0.299*** -0.0213 0.359*** 0.221*** -0.154* Log Total Assets 0.127* 0.181** 0.105 0.161** 0.552*** 0.115 0.595*** 0.0362 -0.0964 M/B 0.0211 -0.0376 0.00526 -0.0255 0.0828 0.0711 0.0628 -0.0809 0.0705 ROA -0.0119 0.116 0.00807 0.161** 0.186** 0.162** 0.147** 0.0976 0.0201 RET1Y 0.0932 0.187** 0.0591 0.193*** 0.0783 0.101 0.048 0.126* 0.0163 SQM_RET -0.0204 -0.000191 -0.0239 0.0261 0.0725 -0.0202 0.0931 0.0591 0.00623 Cash_Flow_Rights -0.364*** -0.205*** -0.0957 -0.178** -0.439*** -0.166** -0.440*** -0.1 0.02 Financial/Nonfinancial -0.0696 -0.0837 0.0421 -0.108 0.155** 0.138* 0.119 -0.192*** -0.129
Total dissent is positively correlated with institutional shareholders’ dissent and turnout at GM. Institutional investors’ dissent is strongly correlated (and possibly driven) by small institutions, as suggested by the coefficient on nonblockholders (0.952), much higher than that for blockholders (0.298). It is also immediately apparent that institutional shareholders’ vote is strongly correlated with the recommendations of proxy advisors. The relation is particularly strong for ISS. We checked for possible collinearity by running a VIF test on our variables of interest; all the coefficients are below 2.20, which allows us to exclude multicollinearity.
4. DETERMINANTS OF SHAREHOLDER DISSENT
4.1. Total shareholder dissent
First, we analyse the determinants of shareholder voting on SOP. To this end, following prior studies
on compensation-related activism (Ertimur, Ferri, & Muslu, 2011) and shareholder voting (Gillan and Starks 2000, Ertimur et al. 2011 and 2013), we run an OLS regression where the dependent variable is SOP Voting Dissent (results are robust to alternative regression models, such as GLM and Tobit. However, OLS allows for reliable statistics on explanatory power, and simplifies the comparison with previous literature).
We test the relation between dissent and turnout of institutional investors at the GM: if shareholder dissent is mostly due to institutional investors, a positive relation is expected. We also analyse the relation of dissent with the main features of the remuneration policy, i.e. disclosure about details of the remuneration policy and the amount/structure of CEO remuneration. The results are reported in Table 3.
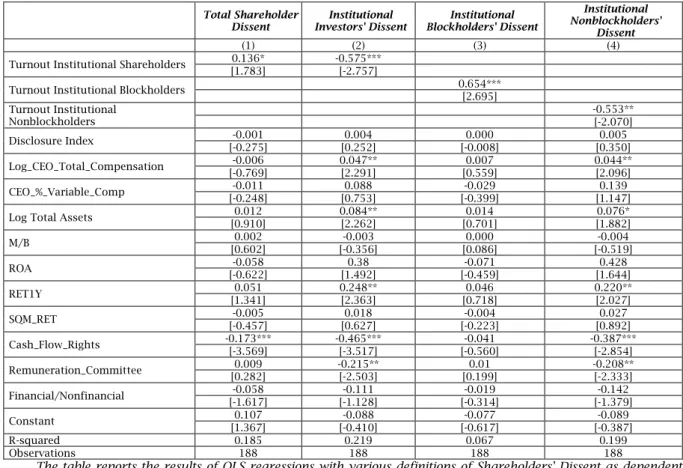
Table 3. Determinants of shareholders' dissent
Total Shareholder
Dissent Investors' Dissent Institutional Blockholders' Dissent Institutional
Institutional Nonblockholders'
Dissent
(1) (2) (3) (4)
Turnout Institutional Shareholders 0.136* -0.575***
[1.783] [-2.757]
Turnout Institutional Blockholders 0.654*** [2.695]
Turnout Institutional Nonblockholders -0.553** [-2.070] Disclosure Index [-0.275] -0.001 [0.252] 0.004 [-0.008] 0.000 [0.350] 0.005 Log_CEO_Total_Compensation -0.006 0.047** 0.007 0.044** [-0.769] [2.291] [0.559] [2.096] CEO_%_Variable_Comp [-0.248] -0.011 [0.753] 0.088 [-0.399] -0.029 [1.147] 0.139 Log Total Assets [0.910] 0.012 0.084** [2.262] [0.701] 0.014 [1.882] 0.076*
M/B [0.602] 0.002 [-0.356] -0.003 [0.086] 0.000 [-0.519] -0.004 ROA [-0.622] -0.058 [1.492] 0.38 [-0.459] -0.071 [1.644] 0.428 RET1Y [1.341] 0.051 0.248** [2.363] [0.718] 0.046 0.220** [2.027] SQM_RET [-0.457] -0.005 [0.627] 0.018 [-0.223] -0.004 [0.892] 0.027 Cash_Flow_Rights -0.173*** -0.465*** -0.041 -0.387*** [-3.569] [-3.517] [-0.560] [-2.854] Remuneration_Committee [0.282] 0.009 -0.215** [-2.503] [0.199] 0.01 -0.208** [-2.333] Financial/Nonfinancial [-1.617] -0.058 [-1.128] -0.111 [-0.314] -0.019 [-1.379] -0.142 Constant [1.367] 0.107 [-0.410] -0.088 [-0.617] -0.077 [-0.387] -0.089 R-squared 0.185 0.219 0.067 0.199 Observations 188 188 188 188
The table reports the results of OLS regressions with various definitions of Shareholders' Dissent as dependent variable and firms characteristics as independent variables. All variables are defined in the Appendix. The t-statistics are presented in parentheses.
***, **, *, denote significance at the .01, .05, .10 level. In Model (1) the dependent variable is total shareholder dissent. The turnout of institutional investors has the expected, positive sign, and is statistically significant, implying that total shareholder dissent is correlated with institutional investors exploiting SOP to engage with management. Both disclosure quality and CEO remuneration appear to have a limited impact.
Looking at control variables, total dissent appears to be strongly correlated with firm ownership structure (Cash_Flow_Rights): dissent is
decreasing in the CFR held by the ultimate shareholder, who can barely be expected to vote against the remuneration policy adopted by a board she has, substantially, appointed. An alternative, not mutually exclusive, the explanation could be that minority shareholders vote less frequently against the remuneration policy where the controlling shareholder holds a higher stake, since she may contribute to reducing managerial pay-related conflicts of interest. The explanatory power of our model (in terms of adjusted R2) is about 20%, i.e.
slightly higher than the benchmark model of Ertimur et al. (2013) on US data.
Total dissent in Italy seems to be mainly explained by institutional investors’ turnout and firm ownership structure.
4.2. Institutional investor dissent
Institutional investors may follow a different voting pattern on SOP issues, both to justify their role as stewards of other people’s money and as a response to external pressures by regulators and supervisory authorities. Descriptive statistics showed that they vote against the remuneration policy more frequently than other shareholders (average institutional investor dissent is 29%, vs. 6% for total dissent), implying that they actually use General Meetings to engage with listed companies, at least on directors’ remuneration.
Although institutional investors have often been recognised as a likely candidate for low-cost, corporate governance activism (Renneboog and Szilagyi 2011, 2013), data availability constraints have prevented – so far – an analysis of the votes they actually cast at the GM. Previous literature investigated activism regressing total dissent on a set of independent variables including proxies for institutional investors’ ownership (i.e. Ertimur et al., 2011); to the best of our knowledge, no previous study attempted to analyze institutional investors’ actual voting behavior outside the US (where mutual funds have been required – since 2003 – to publicly disclose the votes cast on all shares held: Iliev & Lowry 2015). Given the well-known tendency of several institutional investors to behave passively (for “rational apathy” reasons: Easterbrook and Fischel (1996)), this aspect is key to understand the role they actually play in corporate governance.
We analyse the determinants of institutional investors’ dissent (and its relation to PA recommendations) by measuring the votes they actually cast on SOP. As already observed, we calculate institutional dissent as a percentage of the votes cast by institutional investors alone8. The results are reported in Table 3, model (2).
First, institutional investors’ dissent is negatively correlated with their turnout, i.e. it tends to decrease – on average – where the equity stake they collectively hold is higher. One possible interpretation is that where the weight of institutional investors is higher, the board is more likely to submit a remuneration policy in line with their expectations (possibly after negotiations carried out privately) and, therefore, the probability that they show up at the GM and vote “against” is lower.
Second, institutional dissent is positively correlated with total CEO compensation, and also with past stock returns, suggesting that institutional investors’ dissent is, curiously, stronger in companies performing better. While this result may look puzzling, at first glance, we would argue that institutional investors tend to vote against a firm’s remuneration policy where CEO remuneration is comparatively “high”. This happens, typically, where variable compensation (cash bonuses and/or
8 Undisclosed regressions using, as a dependent variable, institutional investors’ dissent calculated as a percentage of total votes expressed at the GM obtained quite similar results.
based compensation, which depends – in turn – on past stock returns) is high. In other words, institutional investors seem to associate higher CEO compensation (and stock returns) with the risk that compensation is excessive. Dissent is, instead, unrelated with disclosure quality, suggesting that institutions dispose of alternative information channels (such as PA reports) to understand a firm’s remuneration policy.
Third, institutional investors pay attention to the governance of the remuneration policy, as suggested by the negative and significant relationship between dissent and the existence of a Remuneration Committee.
Turning to control variables, institutional investors’ dissent, just like total dissent, is negatively correlated with ownership concentration: institutional investors tend to vote less frequently against the remuneration policy where the controlling shareholder holds a higher stake. This result is consistent with the hypothesis that institutional investors trust the controlling shareholder to act as a delegated monitor on managerial remuneration, since she may contribute to reducing managerial pay-related conflicts of interest. Dissent by institutions is also positively correlated with firm size (contrary to what happens in the US), possibly indicating a closer scrutiny by investors in larger firms. This is consistent with the structure of the Italian stock market, where institutional investors typically buy relatively more liquid blue chips, accounting for the bulk of market capitalization.
4.3. Institutional blockholders vs. nonblockholders
We repeated our analysis distinguishing between institutional blockholders and institutional investors holding smaller stakes (i.e. above or below 2% of equity). We expect the relation between dissent and explanatory variables to be stronger for the latter, which may have no channel other than the GM to show their discontent; blockholders are likely to be less interested in SOP since they may often negotiate directly with the board (or with the controlling shareholder). The results, reported in Table 3 models (3) and (4), are consistent with our expectations.The results for nonblockholders confirm (and possibly drive) those reported for institutional investors in general. Their dissent is correlated with CEO remuneration and firm ownership structure, size, and stock returns. The coefficients in the regressions for institutional blockholders have, almost everywhere, the same sign as those for nonblockholders; however, they are almost never statistically significant. Contrary to what happens for nonblockholders, blockholders’ dissent depends – positively – on their turnout at the GM. A possible interpretation is that institutions holding large equity stakes, while not particularly interested in SOP, do, actually, go and vote against the remuneration policy where other engagement strategies have failed. On the other hand, nonblockholders have typically neither the force, nor the incentives to engage actively with management: consequently, the lower the equity stake they hold (as proxied by their turnout), the lower also the probability that their expectations will be taken into
account by the board, and, consequently, the higher the probability that they will vote against the remuneration policy. This interpretation is consistent with the negative sign of nonblockholders’ turnout at the GM.
Interestingly, the negative relationship between institutional dissent and ownership concentration is almost entirely due to nonblockholders, suggesting that asset managers mostly trust control shareholders to act as delegated monitors on CEO remuneration. This result also highlights that different classes of minority shareholders may have different expectations toward control shareholders’ attitude to act as delegated monitors and the related agency problems.
5. THE INFLUENCE OF PROXY ADVISORS
5.1. PA reports on say on pay
We analysed whether (and how) shareholders’ dissent is related to the recommendations issued by proxy advisors, and/or to the details of the analysis supporting such recommendations. Our data on PA recommendations are hand-collected from the 201 ISS and 172 Glass Lewis (GL) reports issued for companies listed on the Italian Stock Exchange at the time of the 2012 proxy season. Among the 188 firms in our database, 183 firms are covered by ISS and 157 by GL.
In 2012 ISS scrutinised compensation plans of Italian firms along four dimensions: fixed pay, short-term variable pay, long-short-term variable pay, service contracts (for further details see Appendix 2). This investigation was followed by a summary of the main pros and cons of the remuneration policy. ISS evaluated whether the policy deviated from five guidelines, taking into account corporate governance variables, disclosure quality and remuneration structure. ISS assigned an explicit score to disclosure quality (alternatively, above average, average or below average) but not to remuneration structure. Nonetheless, issues related to compensation structure and long-term value creation seemingly were the main drivers of concern (with 103 concerns being issued, as shown in Table A, Appendix 2); insufficient disclosure of basic features of the remuneration policy gave rise to concerns in 81 cases.
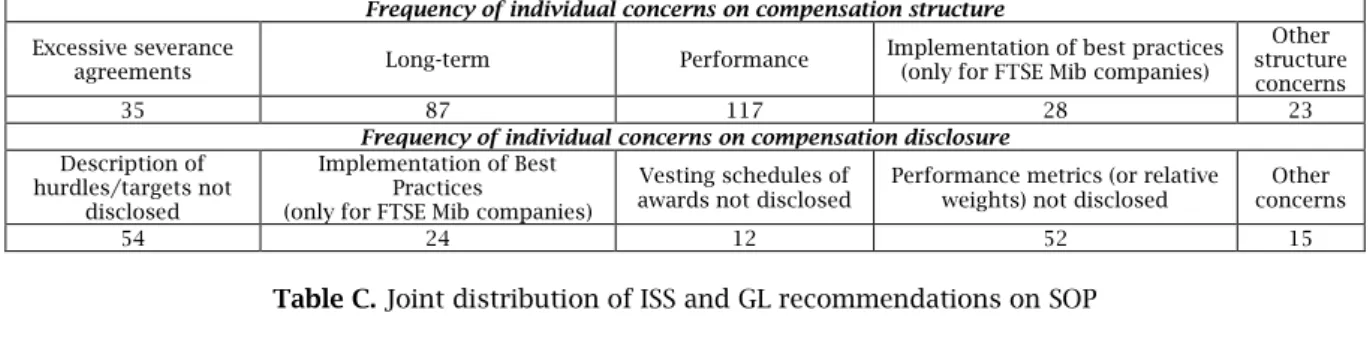
Glass Lewis analysed compensation plans of Italian listed firms along two dimensions: disclosure and compensation structure (Table B, Appendix 2). The disclosure was analysed according to a number of issues, including performance metrics, targets and hurdles, vesting periods of stock-based components, other items such as severance agreements or equity award determination process and, finally, implementation of best practices (only for blue chips included in the FTSE-Mib Index). Compensation structure was analysed with regard to pay mix, incentive plans, severance pay and director pay. The main concerns related to compensation structure came from inadequate performance conditions (117 cases) and absent or insufficient long-term investment plans (87 companies). The main issues raised by GL about disclosure were connected with undisclosed targets and performance metrics (54 and 52 companies, respectively).
Both PAs concluded their reports with a summary of the main shortcomings in the remuneration policy and a final voting recommendation. Looking at the joint distribution of recommendations (Table C, Appendix 2), ISS seems to have followed a more hard-line approach than GL. GL issued an “Against” recommendation for 31% (51 out of 167) of the firms scrutinised, while ISS came up with a negative advice in 50% (84 out of 167) of the cases. Differences should not, however, be overemphasised. ISS and GL often issued the same recommendation on SOP (this happened in 59% of the cases). They tended to agree most when they issued a positive evaluation (39% of the cases). Within the subset of controversial cases (firms where at least one PA recommended to vote against), however, ISS and GL agreed only in 32% of the cases.
5.2. PA recommendations and total dissent
Following Ertimur et al. (2013), to gauge the influence of PA recommendations we added to our “benchmark model” used in Section 2 a set of dummy variables capturing PA recommendations (ISS Against, GL Against, and ISS&GL Against). Our results for total dissent are reported in Table 4 (models (1) to (4)).
Total dissent is, indeed, correlated with proxy advisor recommendations, but PA dummies add little explanatory power to the previous analysis. In model (1), the coefficient of ISS Against is positive at 0.049 and statistically significant (this compares with 0.268 in the US: Ertimur et al 2013) and R2 is 26.5% (65.7% in the US). Similarly, in the model (2), the coefficient of GL Against is positive and significant at 0.041 and R2 is 23.6%. The relation of dissent with other variables in our benchmark model is substantially unchanged (this is true, in particular, for ownership structure).
In model (3), where we include both “ISS Against” and “GL Against”, R2 increases to 37.7%. Notably, the size of the coefficient for ISS Against in model (3) is comparable to that in the model (1), while that for GL Against is much lower than in model (2) and is no longer statistically significant. In model (4), the coefficient for the “ISS&GL Against” dummy is positive and statistically significant, while the coefficient for Only-ISS (Only-GL) is (is not) significant. We interpret our evidence as consistent with ISS having a stronger influence (ISS was the dominant player in the market for proxy advisory services) on shareholder voting in companies targeted by both PAs, with GL providing, nonetheless, additional useful information.
To sum up, the correlation of total dissent with PA recommendations looks limited in Italy: for example, the influence of ISS on the shareholder vote is just around 18% of what was observed in the US (0.049/0.268 = 0.1828: Ertimur et al 2013). Furthermore, the inclusion of PA recommendations adds little explanatory power to the model (R2 increases from 18.5 to 26.5% after the inclusion of the ISS Against dummy; R2 is around 37.7% even for the best-fitting model – including both the ISS and GL Against dummies). For the sake of comparison, in the US the inclusion of PA recommendations enhances R2 from 15% to 66% (for the ISS Against dummy) and to 82% (for the model including both dummies).
Table 4. Determinants of total shareholders and institutional investor dissent, by including proxy advisors'
recommendations
Total Shareholder Dissent Institutional Shareholders' Dissent
(1) (2) (3) (4) (5) (6) (7) (8)
Turnout Institutional Investors 0.154** [2.358] [1.784] 0.131* 0.156*** [2.724] 0.163** [2.128] [-1.710] -0.298* -0.582*** [-2.837] [-1.575] -0.262 -0.334** [-2.124] ISS_Against 0.049*** [3.250] 0.054*** [3.790] 0.378*** [9.381] 0.383*** [9.223] GL_Against 0.041** [2.158] [0.897] 0.014 0.244*** [4.555] 0.192*** [4.316] ISS&GL_Against 0.067*** [2.670] 0.591*** [11.417] Only_ISS [1.859] 0.038* 0.292*** [7.013] Only_GL [1.042] 0.031 [0.952] 0.058 Disclosure Index [-0.446] -0.002 [1.126] 0.006 [0.618] 0.003 [0.112] 0.001 [0.167] 0.002 [1.697] 0.026* [1.120] 0.014 [0.708] 0.008 Log_CEO_Total_Compensation [-1.217] -0.008 [-0.766] -0.006 [-1.448] -0.009 [-1.201] -0.009 [1.625] 0.027 [1.712] 0.039* [0.565] 0.01 [1.412] 0.022 CEO_%_Variable_Comp [-0.356] -0.013 [-0.421] -0.018 [-0.489] -0.016 [-0.354] -0.015 [-0.178] -0.017 [1.317] 0.161 [0.975] 0.094 [0.346] 0.031 Log Total Assets [1.356] 0.016 [1.360] 0.02 0.028** [2.543] [0.496] 0.007 [1.762] 0.055* [1.458] 0.059 [0.927] 0.03 [1.404] 0.039 M/B [1.121] 0.003 [-0.093] 0 [0.247] 0.001 [0.635] 0.002 [0.360] 0.002 [-0.259] -0.002 [0.271] 0.002 [-0.301] -0.002 ROA -0.112 0.04 0.034 -0.091 0.211 0.008 -0.006 0.168 [-1.418] [0.340] [0.387] [-0.982] [1.001] [0.026] [-0.023] [0.877] RET1Y 0.04 0.092** 0.066* 0.043 0.171* 0.205* 0.02 0.168** [1.246] [2.106] [1.929] [1.136] [1.969] [1.678] [0.206] [2.141] SQM_RET -0.005 -0.001 0.002 -0.006 -0.001 -0.017 -0.035 -0.002 [-0.562] [-0.050] [0.184] [-0.615] [-0.054] [-0.504] [-1.279] [-0.105] Cash_Flow_Rights -0.134*** -0.110** -0.067* -0.154*** -0.304*** -0.457*** -0.306*** -0.317*** [-3.259] [-2.198] [-1.724] [-3.189] [-2.754] [-3.260] [-2.716] [-3.183] Remuneration_Committee 0.022 -0.021 -0.017 0.027 -0.069 -0.243** -0.12 -0.032 [0.808] [-0.621] [-0.643] [0.847] [-0.938] [-2.588] [-1.544] [-0.494] Financial/Nonfinancial -0.049 -0.047 -0.046* -0.039 -0.004 -0.066 0.029 0.024 [-1.618] [-1.352] [-1.699] [-1.090] [-0.049] [-0.675] [0.375] [0.327] Constant 0.041 0.029 -0.056 0.103 -0.181 0.037 0.025 -0.109 [0.611] [0.325] [-0.824] [1.327] [-1.017] [0.150] [0.127] [-0.680] R-squared 0.265 0.236 0.377 0.22 0.486 0.32 0.586 0.577 Observations 183 157 152 188 183 157 152 188
The table reports the results of OLS regressions with Total Shareholder and Institutional Shareholders' Dissent as the dependent variable and ISS and/or GL "Against" recommendation and firms characteristics as independent variables. All variables are defined in the Appendix. The t-statistics are presented in parentheses.
***, **, *, † denote significance at the .001, .01, .05, .10 level.
5.3. PA recommendations and institutional
investor dissent
We expect institutional shareholder votes also to be associated with PA recommendations; the association should be stronger than for the average shareholder, since institutional investors are known to buy PA reports on a regular basis and have a strong incentive to outsource research and analysis activities (Choi et al., 2009; Ertimur et al., 2013), particularly for companies where they hold small equity stakes. To analyse the relation of PA recommendations with institutional investor voting, we follow the same research strategy implemented for total dissent. Our results are reported in Table 4 (models (5) to (8)).
Consistent with our expectations, votes of institutional investors on SOP are strongly correlated with PA recommendations. The coefficients for the dummies capturing PA recommendations are positive and much higher than those for total dissent. In model (5) ISS Against is positive at 0.378 (i.e. more than 8 times the coefficient in the regression for total dissent) and R2 is as high as 49% (i.e. almost twice the value in the regression for total dissent). Similarly, in the model (6), the coefficient of
GL Against is positive at 0.244 and statistically significant (it is almost 6 times the coefficient in the regression for total dissent). Even in a country where ownership is concentrated and, therefore, the voting outcome is often known in advance, institutional investors are active on SOP issues, and their voting decisions are strongly correlated with PA recommendations. This feature remains hidden from view, when looking only at total dissent, since this measure is overwhelmingly affected by the votes cast by other categories of shareholders, holding larger equity stakes.
Results are substantially confirmed in models (7) and (8), where both ISS Against and GL Against and/or an ISS&GL Against dummy are included. The correlation of institutional investors’ votes with PA recommendations is, once again, stronger for ISS, as shown by the relative size of the regression coefficients; ISS is apparently followed by most institutional investors when PAs provide divergent recommendations. However, GL is far from irrelevant, even after taking into account the effects of ISS recommendations. This may be connected to two, not mutually exclusive factors: on one hand, some firms are targeted only by ISS or GL, creating an obvious channel of exclusive influence. On the other hand, dissent is much stronger where both
PAs recommend voting Against, implying that even investors normally relying on ISS consider the release of a negative report by GL as an additional relevant piece of information. The inclusion of PA recommendations adds great explanatory power to our model (R2 is around 58%, comparable to the results of Ertimur et al. (2013) for total dissent in the US).
As already observed in previous literature (Choi et al. 2009), it is difficult to say whether the association between PA recommendations and shareholder votes is due to a causal relationship or simply to investors and PAs considering the same factors when taking their decisions (i.e. voting and recommending for or against, respectively). Actually, these explanations are not mutually exclusive, since different categories of shareholders may follow different voting strategies.
5.4. PA recommendations and institutional
blockholders’ vs. nonblockholders’ vote
We repeated our analysis distinguishing between institutional blockholders and nonblockholders. We expect the relation to be stronger for the latter since the sensitivity to PA recommendations depends on the incentives of institutional investors to gather and process information independently, which in turn have been proved to depend on the size of their holdings (Agrawal & Nasser, 2012; Cronqvist & Fahlenbrach, 2009). Furthermore, nonblockholders are often internationally diversified asset managers (mutual or pension funds), having little incentive to bear the costs implied by analyzing thousands of companies in their portfolios; this is especially true in the case of Italian firms, only a tiny minority of which may be considered sufficiently large to justify the investment in independent analysis. Our results are reported in Table 5.
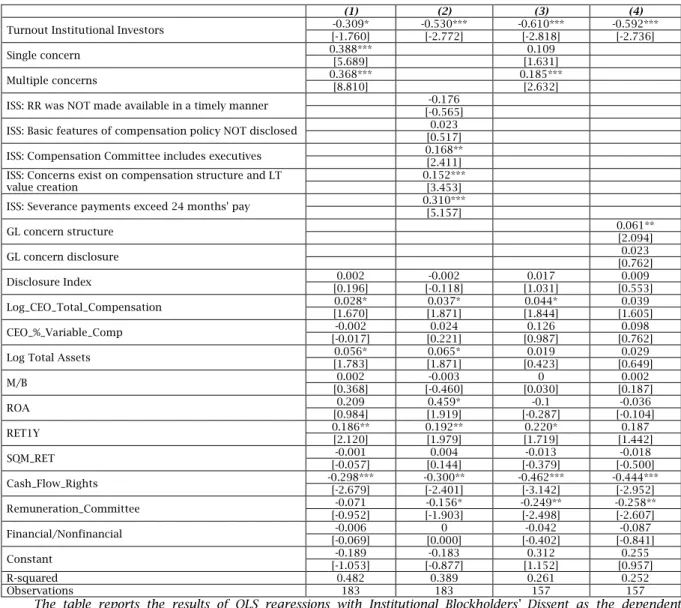
Table 5. Determinants of blockholders and nonblockholders institutional investors' dissent, by including
proxy advisors' recommendations
Institutional Blockholders' Dissent Institutional Nonblockholders' Dissent
(1) (2) (3) (4) (5) (6) (7) (8)
Turnout Institutional Blockholders 0.725*** 0.660** 0.720** 0.738*** [2.962] [2.393] [2.565] [3.115]
Turnout Institutional Nonblockholders [-1.012] -0.211 -0.643** [-2.412] [-0.980] -0.195 [-1.540] -0.301 ISS_Against 0.073** [2.494] [1.727] 0.061* 0.426*** [10.915] 0.446*** [11.126] GL_Against 0.076** [2.085] [1.929] 0.075* 0.245*** [4.359] 0.168*** [3.879] ISS&GL_Against 0.143*** [3.480] 0.621*** [11.987] Only_ISS [1.106] 0.036 0.357*** [8.546] Only_GL [-0.144] -0.007 [1.771] 0.109* Disclosure Index [-0.009] 0 [0.578] 0.006 [0.490] 0.005 [0.043] 0 [0.268] 0.003 [1.794] 0.030* [1.023] 0.013 [1.117] 0.012 Log_CEO_Total_Compensation [0.270] 0.003 [0.537] 0.008 [0.271] 0.004 [0.170] 0.002 [1.374] 0.023 [1.538] 0.037 [0.129] 0.002 [1.085] 0.017 CEO_%_Variable_Comp [-0.693] -0.05 [-0.175] [-0.340] -0.015 -0.029 [-0.450] -0.032 [0.140] 0.013 [1.543] 0.197 [1.226] 0.115 [0.622] 0.055 Log Total Assets [0.616] 0.013 [0.365] 0.009 [0.275] 0.007 [0.362] 0.007 [1.380] 0.043 [1.211] 0.053 [0.647] 0.021 [0.997] 0.029 M/B [0.337] 0.002 [-0.069] 0 [0.057] 0 [0.011] 0 [0.302] 0.002 [-0.440] -0.004 [0.196] 0.001 [-0.323] -0.002 ROA [-0.612] -0.095 [-0.868] [-0.823] -0.191 -0.184 [-0.706] -0.107 [1.248] 0.252 [0.275] 0.093 [0.441] 0.109 [1.138] 0.216 RET1Y [0.500] 0.032 [0.774] 0.065 [0.441] 0.038 [0.455] 0.028 [1.667] 0.140* [1.562] 0.2 [-0.107] -0.01 [1.789] 0.140* SQM_RET [-0.438] -0.008 [-0.083] [-0.234] -0.002 -0.005 [-0.458] -0.008 [0.261] 0.006 [-0.067] -0.002 [-0.769] -0.02 [0.263] 0.006 Cash_Flow_Rights [-0.360] -0.027 [-0.085] [-0.007] -0.007 -0.001 [-0.315] -0.023 [-1.935] -0.206* -0.397*** [-2.712] -0.209* [-1.930] -0.239** [-2.420] Remuneration_Committee [0.759] 0.042 [0.430] 0.028 [0.828] 0.057 [0.971] 0.051 [-0.520] -0.038 -0.238** [-2.411] [-1.174] -0.089 [-0.138] -0.009 Financial/Nonfinancial [-0.025] -0.002 [-0.044] -0.003 [0.172] 0.012 [0.064] 0.004 [-0.146] -0.012 [-0.952] -0.098 [0.289] 0.022 [0.266] 0.02 Constant [-0.892] -0.112 [-0.763] [-0.869] -0.124 -0.144 [-0.688] -0.084 [-1.124] -0.201 [0.117] 0.031 [0.090] 0.018 [-0.782] -0.13 R-squared 0.101 0.084 0.108 0.136 0.531 0.279 0.623 0.592 Observations 183 157 152 188 183 157 152 188
Tables report the results of OLS regressions with Small Institutional Shareholders and Institutional Blockholders' Dissent as the dependent variable and ISS and/or GL "Against" recommendation and firms characteristics as independent variables. All variables are defined in the Appendix. The t-statistics are presented in parentheses.
***, **, * denote significance at the .01, .05, .10 level. Actually, the results for institutional investors as a whole seem to be driven by nonblockholders, while institutional blockholders, having a stronger incentive to perform their own research, appear to be less sensitive to PA recommendations (see models (1) to (4)). Consistently with our expectations, the relation of dissent with PA
recommendations is always stronger for nonblockholders. In model (5) the coefficient for the “ISS Against” dummy is positive at 0.426, and R2 is as high as 53.1%. In model (6) “GL Against” is also significant, although the regression has a lower R2; ISS&GL (jointly) Against shows also a strong,