A longitudinal approach
A L E S S I O F O R N A S I N * , C O R R A D O L A G A Z I O ^ , D A N I E L D A N ° * University of Udine, ^ University of Genoa, ° Modul University Vienna
SIDeS, «Popolazione e Storia»,
Spatial aspects of internal migration in Italy
A longitudinal approach
ALESSIO FORNASIN*, CORRADO LAGAZIO^, DANIEL DAN° * University of Udine, ^ University of Genoa, ° Modul University Vienna 1. Introduction
This paper examines internal migration in Italy between 1930 and 2010 from a demographic and spatial viewpoint. This study considers the migrations up to age 50 of birth cohorts born in Italy between 1930 and 1960. Data were collected through a survey using the CATI system (Computer Assisted Telephone
Interviewing) in the Spring of 2010. Around 1,900 male and female respondents,
born and currently resident in Italy, participated.
Migration studies are typically based on cross-sectional data. In this case, it is technically impossible to study the full set of migration episodes of a single subject, because with migration the subjects exits the investigated population. This paper is instead characterised by a longitudinal approach: all the migration episodes of a sample of individuals of age 20-49 have been collected. The ad hoc survey used to collect longitudinal data allows us to study the entire migration history of subjects, and to see if and to what extent each migration episode is related to the previous ones. Georeferenced data made also possible to study distance of migration, both in single episodes and over the entire life cycle. This work aims to study the determinants of single migrations experienced by individuals and to evaluate how individual characteristics affect distance of migration. The literature on this last point is rather sparse, because it requires data that are usually not available in official statistics and that frequently have not been collected when longitudinal studies have been used.
While many studies consider medium and long-distance relocations as ‘real migration’, and refer to those of short distance as ‘mobility’, this paper defines migration as all changes in residence involving the crossing of a municipal boundary for more than one year.
Section 2 gives a summary of the past 80 years of Italian internal migration and an overview of research that uses longitudinal data. Section 3 discusses the data collection criteria and methodological concerns. Section 4 presents the results of this research, which are discussed in the final section.
2 2. Internal migration and longitudinal analysis
2.1. Internal migration in Italy (1930-2010). Internal migration in Italy intensified
during the twenty-year period of Fascist rule, despite the fact that the regime openly opposed it. Legislation at the time obstructed but failed to halt the migratory flows from rural to urban areas that gained strength throughout the dictatorship, fed by the harsh economic contrasts within the country (Treves 1976).
After the end of the war and fall of Fascism, these currents, aided by the economic boom, became even stronger. In particular, people from the largely agricultural communities in the South and Veneto area (Ascoli 1979; Pugliese 2006) began gravitating towards the big industrial centres of the North-West: Turin, Milan, and Genoa (Fofi 1976; Paci 1976; Ramella 2003; Badino 2008). Rome and other large towns in the South also had a strong migratory pull (Ascoli 1979; Ginsborg 1998; Gallo 2012; Crisci 2016).
This migration reached its peak in the first half of the sixties, although by the end of this decade flows from Veneto had all but completely died away (Birindelli 2004), and those from the South and Island territories continued, but much less intensely. The 1973-74 oil crisis marks a turning point in South-North migration, which not only dropped off considerably but was also ‘reversed’ with the great increase of return flows of the no less than four million Southern migrants estimated to have moved to North-Central Italy during the economic boom (Pugliese 2006).
The process of urbanization also reached a decisive point soon after. During the eighties migration to large urban centres was increasingly replaced by resettlements in small and medium-sized towns (Conti 1991; Golini 1974). In the nineties, South-North migration picked up once again, but failed to return to previous levels (Pugliese 2006).
Interregional migration and the process of urbanization were also accompanied by other, partly interrelated trends, such as the flows that emerged between small towns and the countryside and the mountain and plain areas. As holds true today, complex interactions existed between Italy’s different territories that determined both long and short distance movements (Micheli 1990; Bonifazi, Heins 2000; Ascolani, Baldini 2008); the former often being classed as ‘migration’, as opposed to ‘mobility’ for the latter (see Mencarini 1996). The motives of this migration were multiple, but most often related to labour and at times marriage markets (Sinibaldi 2008). Recent studies have focused on other aspects such as education level (Marinelli 2013).
The complex social and economic changes within Italy over the last decade have meant the progressive reduction of internal migration in terms of distance (Berti 2008; De Santis 2010). Studies on migration have long given importance to the role of distance. From the early pioneering studies in the field, research has continued to shed light on the relationship between migratory distance and
intensity of migratory flow (Ravenstein 1885; Zipf 1946). This topic has received much attention in the field of sociology and geography (Cadwallader 1992; Simini et al. 2012), whereas other studies, especially in the field of economics, have explored the relation between migratory distance and individual decisions. It appears that the distance between a given origin and the destination has a negative effect on the rate of migration between the two, due to the increased costs (monetary and psychological), lack of information and number of intervening opportunities involved (Schwartz 1973; Stouffer 1940).
More recently this issue has also been considered from a demographic viewpoint. Reflecting on the fact that migration also means creating distance between the migrant and his/her original family and social context, it is possible to assert that new relations are formed between them, the dynamics of which are influenced in varying degrees by the distance involved. Among the great variety of these relations we can note how the support relations among the family members are conditioned (Mulder, Van der Meer 2009; Bordone 2009). Migratory distance is also connected with marriage rate (Rahman et al. 2010) and choice of partner (Haandrikman et al. 2008; Fornasin 2011; Corsini, Fornasin 2017), and therefore reflected by the characteristics of migratory chains, by the ties between one geographical area and another.
2.2. Longitudinal analysis. In countries with advanced demographic data
collection systems the possibility of surveying by birth cohort is obviously assured. However, very little research adopting this approach concerns migration. This is partly due to the innate difficulty in getting longitudinal data; we lose trace of an individual in the municipal records precisely when he/she emigrates. It is impossible to identify more than one migration in an individual life-history using civil or population registers without tracking these movements in the documentation of a number of municipalities. In Italy, this operation is theoretically possible, but at present even tracing a few dozen life-histories would be largely impracticable. As a result, very few studies on migration adopt a longitudinal approach and almost all our knowledge to date is based on cross-sectional data (Shyrock, Larmon 1965).
The first studies examining internal migration from a longitudinal perspective were conducted in France in the sixties, using ad hoc surveys (Girard
et al. 1964; Pourcher 1965; 1966). These pioneering scholars initially focussed
on issues regarding professional mobility and subsequently on the more general reasons behind migration (Bastide, Girard 1974).
More recent research on migration investigates changes in the family structure (Bottai 1990; Kulu, Milewski 2007; Clark, Davies Withers 2007) and the field of employment (Mulder, Van Ham 2005). Other studies further examine the causes of migration (Courgeau 1985; Massey 1990; Mulder, Hooimeijer 1999; Geist, McManus 2008; Bartolucci, Villosio, Wagner 2018), which also features as an independent variable in the examination of other phenomena, such as marriage practices (Jampaklay 2006).
Although there is a lack of studies on internal migration in Italy which take a longitudinal approach, viable sources are available. Census data provide some possibilities; a specific question on migration was introduced to the 1981 census asking for place of residence for the previous five years (Rossi 1990). There is also data available from the Indagini Multiscopo ISTAT (Istituto Nazionale di Statistica) (e.g. Impicciatore and Dalla Zuanna, 2006), although with a limited time-span, and above all from the ILFI (Indagine Longitudinale sulle Famiglie Italiane) (e.g. Gabrielli et al. 2007).
3. Data and methods
This analysis uses the results of a specifically devised telephone survey, conducted in the 2010 at the Department of Statistics of the University of Udine using the CATI method1. Contact numbers were randomly extracted
from public phonebooks, and both male and female respondents over age 50 were interviewed. Since the statistical unit of reference is the individual, interviewees were instructed to speak exclusively about their own previous life-histories. Proxy respondents were not used at any time. The aim was to collect information on all migrations in each respondent’s lifetime. Migration was defined as a change in residential municipality for at least one year, thus excluding absences of some months, which are likely to indicate seasonal work, or, in the case of men, military service.
The survey also collected information on respondents’ prevalent occupation during they life history and qualifications to shed further light on their migratory behaviour. Naturally, the limits of this interview method mean that some information lacks detail, and is above all not always associable with a time variable. The survey also features a high level of territorial detail; all geographical references were codified on municipal level.
The critical aspects of this analysis are those of all retrospective studies; the biases regarding mortality and international migration (in this case one-way, international migration). Additional considerations are interviewees’ possible lapses of memory and overall representativeness (DaVanzo 1982).
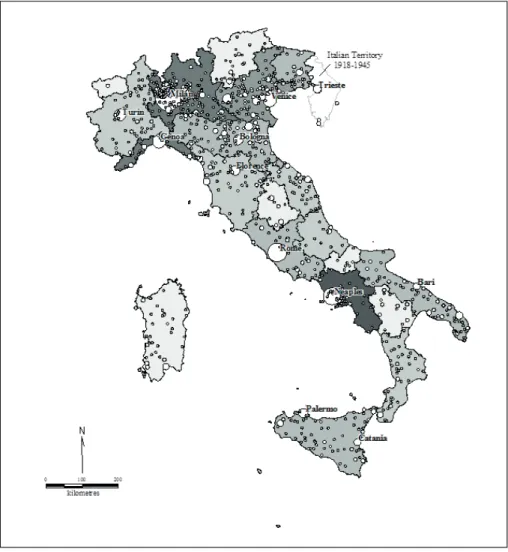
Even with these limits, the territorial scope of the survey is satisfactory (see fig. 1). The circles are positioned on respondents’ place of birth, and proportional in size to the number of births. The overall distribution closely reflects that of the general population (represented by regional density) with the most populated cities easily identifiable by the circles’ dimensions.
The total database consists of 1,927 records, but not all respondents fulfil the criteria regarding birthplace and birth cohort. The descriptive part of this study uses information on 1,425 individuals born between 1930-60 within the borders of Italy before the 1945 Treaty of Paris, and resident in Italy in the first 50 years of their life-course. This group also includes individuals who had, at some point, migrated abroad. Although the focus here is on internal migration, international and return migrations were included to avoid artificially altering the results of the longitudinal analysis.
Fig. 1. Territorial distribution of respondents’ birth places and population density (1951)
The regression analysis focuses on two aspects. First and foremost, an exponential survival model was used to study the determinants of the risk of first and second migrations between ages 20 and 49; rates were assumed to be constant in five-year age bands; third (and above) migrations were not considered because of their low sample size. Secondly, the (logarithm of) distances of the first and second migrations were studied with OLS regression,
to examine the spatial aspects of this phenomenon.
6 4. Results
4.1. Descriptive Findings. Table 1 presents some descriptive measures relating to
internal migrations before age 50.
Tab. 1. Characteristics of the migrations of respondents (generations 1930-59)
M+F M F
N individuals 1425 671 754
N internal migrations 1403 722 681
N. internal migrants 782 367 415
% internal migrants out of respondents 54.9 54.7 55.0
Total migration rate 0-49 0,98 1,08 0,90
Internal migrations/internal migrants 1,79 1,97 1,64
Mean age at first migration 18.9 19.0 18.9
Mean age at second migration 25.7 25.6 25.9
Mean age at third migration 27.3 26.8 28.1
Mean age at fourth migration 27.9 27.7 28.3
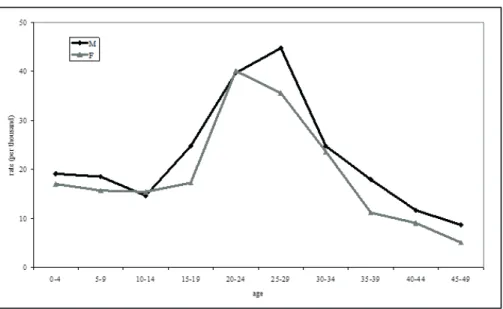
We see that around 55% of respondents had experienced internal migration at least once in the first 50 years of their life-course, with negligible differences between men and women. However, the total male migration rate is always greater than the female, demonstrating that although both sexes started migrating at around the same age, they stopped at different ages. In other words, women settled down in what was to remain their residential municipality at age 50 before their male counterparts.
Further detail is provided by figure 2, which presents the migratory schedules of male and female interviewees separately. Both curves are similar and assume previously expected patterns. Migratory rates peak between ages 25-29 for men, and 20-24 for women. The earlier modal age of women is related to their marrying younger and the relation between this demographic factor and territorial mobility.
Results from the descriptive analysis are in line with previous expectations and demonstrate the close adherence of the data collected here with the more general phenomenon under examination.
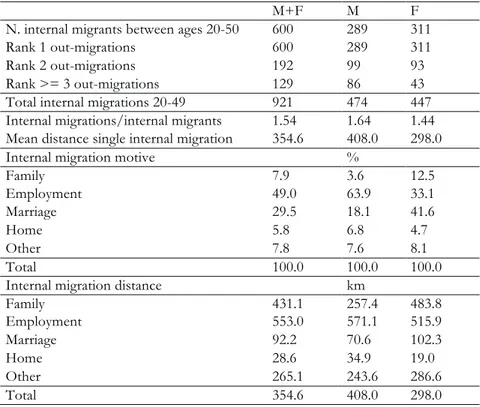
The aim of this study is to identify the connection between the background characteristics of internal migrants and 1) the risk of out-migration, 2) the spatial aspects – namely distance – of out-migration. The analysis was limited to first and second migrations between ages 20 and 49 because together they cover over 80% of male and 90% of female migrations (for this age band) and are each sufficiently numerous to be studied individually. The age limit of 20 was selected because from this age: 1) the propensity to move increases; 2) an individual presumably makes his/her own personal migratory choices, or at least has a say in the decision within the family; 3) most respondents had already obtained their final educational qualifications and entered the work. Table 2 presents some descriptive measures related to this migrant group. Tab. 2. Characteristic of migrations between the ages of 20-50
M+F M F
N. internal migrants between ages 20-50 600 289 311
Rank 1 out-migrations 600 289 311
Rank 2 out-migrations 192 99 93
Rank >= 3 out-migrations 129 86 43
Total internal migrations 20-49 921 474 447
Internal migrations/internal migrants 1.54 1.64 1.44
Mean distance single internal migration 354.6 408.0 298.0
Internal migration motive %
Family 7.9 3.6 12.5 Employment 49.0 63.9 33.1 Marriage 29.5 18.1 41.6 Home 5.8 6.8 4.7 Other 7.8 7.6 8.1 Total 100.0 100.0 100.0
Internal migration distance km
Family 431.1 257.4 483.8 Employment 553.0 571.1 515.9 Marriage 92.2 70.6 102.3 Home 28.6 34.9 19.0 Other 265.1 243.6 286.6 Total 354.6 408.0 298.0
8
Whereas the first part of this table is consistent with the results from table 1, the second part however, referring to the causes of migration, reveals notable differences between the sexes. Men result as moving around more frequently for work-related causes, whereas women are more likely to relocate for marriage or family reasons (e.g. trailing spouses). This reflects elements of Italian society, such as gender inequalities in access to employment (emphasised by the fact that we are dealing with birth cohorts born before the sixties), and the custom that the wife moves to the husband’s community rather than the other way round in the case of exogamous marriage.
The third part of the table presents the average distance of the single migrations for each motive. Migrations for work and family reasons, the latter often a result of the former, covered the greatest distance, whereas those connected to marriage or the home covered the shortest. The difference in distance for family-related migrations between men and women is due to the fact that the former were most often tied migrations with their parents and the latter with their husbands. This dynamic is also replicated by the fact that the range of movement of a young couple was far greater than that of parents with children over age 20.
4.2. Migration risk. This section aims to identify the characteristics of the
out-migrants and non from among the 1,425 individuals from the birth cohorts of 1930-59, between ages 20-49. The demographic variables are age (sub-divided into 6 five-year age bands), gender and birth cohort. The two geographical variables are firstly the macro-region of departure, based on the classic four-way division of Italy into: a) North-West; b) North-East; c) Centre; d) South and Islands2; and secondly the internal migrant’s community of departure,
classified into large urban centres (consisting of the twelve most populated from the census of 1951) and non.
Five possible causes of migration were considered, related to the: a) family; b) employment; c) marriage; d) home; and e) other.
The two socio-related variables are level of education, divided into: a) elementary school; b) secondary school; c) high school; and d) university); and occupation, divided into: a) public employee; b) private employee; c) self-employed, freelance; and d) housewife (for women only). The analysis considered only the main occupation of the life course.
Lastly, three variables were included aimed at obtaining a historical profile of out-migrants’ lives, namely if respondents had: a) lived away from home while attending school or university; b) been required to be absent for a fairly long period for work-related reasons; or c) already migrated before age 20.
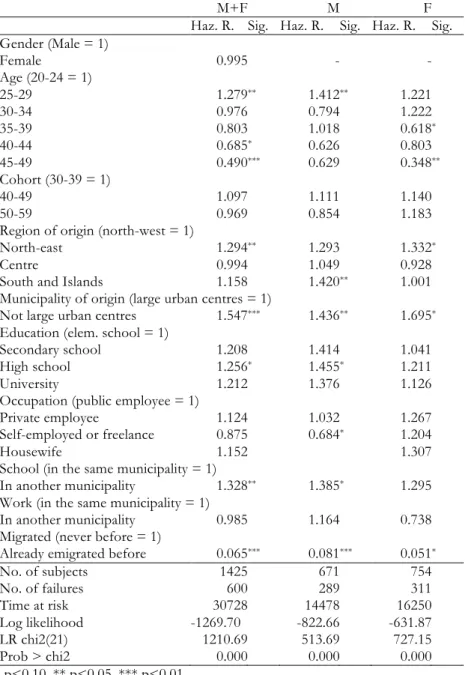
Table 3 presents the results from the exponential survival regression model for first-rank out-migrations, for sexes combined and separate.
The age effect is in line with previous descriptive analyses, with the hazard ratio having a peak at age 25-29 and then decreasing towards very low. Generally speaking, no significant differences emerge by birth cohort. Some
gender differences do arise when looking at the separate gender-specific models; the variables which are significant for men are not always so for women.
Tab. 3. Exponential survival model for the risk of first migration
M+F M F
Haz. R. Sig. Haz. R. Sig. Haz. R. Sig.
Gender (Male = 1) Female 0.995 - - Age (20-24 = 1) 25-29 1.279 ** 1.412 ** 1.221 30-34 0.976 0.794 1.222 35-39 0.803 1.018 0.618 * 40-44 0.685 * 0.626 0.803 45-49 0.490 *** 0.629 0.348 ** Cohort (30-39 = 1) 40-49 1.097 1.111 1.140 50-59 0.969 0.854 1.183
Region of origin (north-west = 1)
North-east 1.294 ** 1.293 1.332 *
Centre 0.994 1.049 0.928
South and Islands 1.158 1.420 ** 1.001
Municipality of origin (large urban centres = 1)
Not large urban centres 1.547 *** 1.436 ** 1.695 *
Education (elem. school = 1)
Secondary school 1.208 1.414 1.041
High school 1.256 * 1.455 * 1.211
University 1.212 1.376 1.126
Occupation (public employee = 1)
Private employee 1.124 1.032 1.267
Self-employed or freelance 0.875 0.684 * 1.204
Housewife 1.152
1.307
School (in the same municipality = 1)
In another municipality 1.328 ** 1.385 * 1.295
Work (in the same municipality = 1)
In another municipality 0.985 1.164 0.738
Migrated (never before = 1)
Already emigrated before 0.065 *** 0.081 *** 0.051 *
No. of subjects 1425 671 754 No. of failures 600 289 311 Time at risk 30728 14478 16250 Log likelihood -1269.70 -822.66 -631.87 LR chi2(21) 1210.69 513.69 727.15 Prob > chi2 0.000 0.000 0.000 * p<0.10, ** p<0.05, *** p<0.01.
The risk of migration is greatly influenced by place of residence, with particularly high levels emerging in South and North-East. However, these findings also reveal important gender distinctions; the male population having the highest risk of migration if born in the South, whereas women are more greatly impacted in the North-East.
Size of the municipality of origin plays an important role for both men and women. Indeed, the risk of migration for individuals born in a small town is significantly higher than for those born in a large one.
On the contrary, the level of education seems to be relatively unimportant in the decision to migrate: though the risk of migration appears to be higher for high levels of education, differences are not statistically significant.
Although the results regarding occupation lack statistical significance in the general model, the male only model reveals that the risk of migration for self-employed and free-lance workers is notably low. This can be partly explained by the CATI information collection method; in order to keep the data
complexity to a reasonable level, only the main occupation of an individual was taken into account and changes in vocation were disregarded. Given that in the Italian context the North-South and Northeast-Northwest migrations primarily involved people from peasant backgrounds who gravitated to the towns and became factory workers, it is clear that those who declared themselves agricultural workers migrated much less than those who, although born into peasant families, had another type of occupation for the best part of their lives.
Of the variables considering life-experiences before age 20, those which assume statistical significance are having attended at least one school outside the municipality of residence and having already undertaken a migration. The school factor emerges as determinant mainly for males, probably because many of the respondents came from municipalities without a high school and completed their studies in another municipality. We can suppose that these individuals often went on to find work in the place where they had attended their last school. For both sexes, a migratory experience before age 20 decreases notably their risk of re-migration.
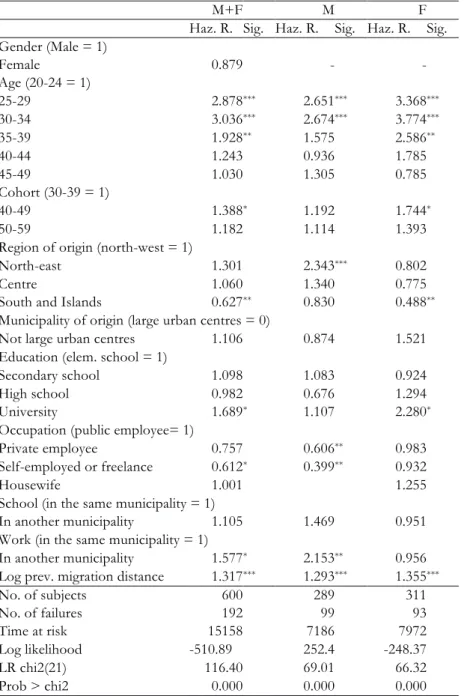
Table 4 reports the results of the exponential survival model regarding second migrations, obviously limited to the 600 individuals who had already emigrated once between ages 20-49. Although these findings are very similar to those from the previous models, particularly in terms of the coefficients’ signs, the degrees of significance differ, which is most likely due to the reduced number of subjects under analysis.
Age has a strong effect, showing a pattern similar to the one observed with first migration, but shifted towards older ages. The variables related to geographical context stand out as having particular importance. The region of origin has a significant effect, again different between males and females, ad switched with respect to first migration. Indeed, here the greatest risk of
migration characterises men living in the North-East and women living in the South.
Tab. 4. Exponential survival model for the risk of second migration
M+F M F
Haz. R. Sig. Haz. R. Sig. Haz. R. Sig.
Gender (Male = 1) Female 0.879 - - Age (20-24 = 1) 25-29 2.878 *** 2.651 *** 3.368 *** 30-34 3.036 *** 2.674 *** 3.774 *** 35-39 1.928 ** 1.575 2.586 ** 40-44 1.243 0.936 1.785 45-49 1.030 1.305 0.785 Cohort (30-39 = 1) 40-49 1.388 * 1.192 1.744 * 50-59 1.182 1.114 1.393
Region of origin (north-west = 1)
North-east 1.301 2.343 *** 0.802
Centre 1.060 1.340 0.775
South and Islands 0.627 ** 0.830 0.488 **
Municipality of origin (large urban centres = 0)
Not large urban centres 1.106 0.874 1.521
Education (elem. school = 1)
Secondary school 1.098 1.083 0.924
High school 0.982 0.676 1.294
University 1.689 * 1.107 2.280 *
Occupation (public employee= 1)
Private employee 0.757 0.606 ** 0.983
Self-employed or freelance 0.612 * 0.399 ** 0.932
Housewife 1.001
1.255
School (in the same municipality = 1)
In another municipality 1.105 1.469 0.951
Work (in the same municipality = 1)
In another municipality 1.577 * 2.153 ** 0.956
Log prev. migration distance 1.317 *** 1.293 *** 1.355 ***
No. of subjects 600 289 311 No. of failures 192 99 93 Time at risk 15158 7186 7972 Log likelihood -510.89 252.4 -248.37 LR chi2(21) 116.40 69.01 66.32 Prob > chi2 0.000 0.000 0.000 * p<0.10, ** p<0.05, *** p<0.01.
12
A similar result, for the general model only and with a more contained degree of significance, emerges for the level of education; having a university education gives rise to a greater risk of emigrating for women. Occupation is relevant only for males: in this case the low level of risk characterising self-employed and free-lance people affects, even if to a lower extent, also private employees. Last, having a long distance emigration before age 20 has the effect on second order migrations, giving rise to a higher risk. In short, the results from this model suggest that it the determinants of out-migration only weakly depend on the rank, the individual’s place of origin and aspects of his/her life-history exert similar effects on risk.
4.3. Distance of migration. This section aims to identify the factors that determine
distance between the place of departure and arrival of the 600 first migrations and the 192 second migrations made by the individuals of the birth cohorts 1930-59, between ages 20-49. The demographic variables are gender, age (classified into three 10 year age bands), and birth cohort. The territorial, socio-economic, and life-history variables are the same as for the previous model. Since here we are considering migrants alone (unlike before), it is also possible to make use of another important variable, the ‘Out-migration cause’. Five possible causes of migration were considered, related to the: a) family (e.g. trailing spouse); b) employment; c) marriage; d) house moving (‘home’); and e) other.
Table 5 presents the results from the model for the first migrations for gender combined and separate. We note first that the independent variables which are significant for men are nearly always so for women as well. For the age variable, the coefficient is negative in all age-bands compared to the reference category (20-29), when migration is most frequent, suggesting that migrations of individuals past their twenties tend to be shorter. This variable reaches the threshold of statistical significance only for age 30-39.
As regards the birth cohort variable, we observe that the distance of the internal migrations tends to reduce with the advancing of the generations, which concurs with findings from previous studies on the history of internal migrations in Italy.
Turning to the territorial considerations, we see that the coefficients related to the ‘macro-region of departure’ result in all cases as considerably higher than the reference category and, with the exception of males from the North-East, statistically significant. Migrations from all regions other than the North-West cover a greater distance than those starting from this area, which is to be expected given that the Italian ‘industrial triangle’, located in the North-western region, pulled in immigrants from all over country. The coefficient values progressively increase in relation to the remoteness of the region of departure from this area, with the highest levels for the South and Island territories (excluding return migrations from abroad).
Tab. 5. Migration distance for first migration between ages 20-49. Parameter estimates and
standard errors
Coef. Sig. M+F Coef. Sig. M Coef. Sig. F
Gender (male = 0) Female 0.099 Age (20-29 = 0) 30-39 -0.496 *** -0.502 ** -0.416 * 40-49 -0.257 -0.416 -0.166 Cohort (30-39 = 0) 40-49 -0.316 ** -0.297 -0.330 50-59 -0.638 *** -0.282 -0.904 ***
Region of origin (north-west = 0)
North-east 0.408 ** 0.135 0.578 **
Centre 0.545 *** 0.552 * 0.594 **
South and Islands 1.309 *** 1.339 *** 1.155 ***
Municipality of origin (large urban centres = 0)
Not large urban centres -0.311 * -0.205 -0.432 *
Out-migration motive (family = 0)
Work 0.263 0.834 * 0.015
Marriage -1.371 *** -0.976 * -1.395 ***
Home -1.995 *** -1.570 ** -2.148 ***
Other -0.488 0.123 -0.697
Education (elem. school = 0)
Secondary school 0.200 0.123 0.243
High school 0.296 0.049 0.565 **
University 0.812 *** 0.657 1.030 ***
Occupation (public employee= 0)
Private employee 0.110 0.300 -0.075
Self-employed or freelance -0.072 -0.427 0.318
Housewife -0.034
-0.026
School (in the same municipality = 0)
In another municipality 0.217 0.301 0.110
Work (in the same municipality = 0)
In another municipality -0.607 *** -0.681 ** -0.427
Migrated (never before = 0)
Already emigrated before 0.092 0.145 0.210
Number of obs 600 289 311
F 16.68 11.85 6.98
Prob > F 0.000 0.000 0.000
Adj R-squared 0.365 0.430 0.288
14
The type of urban centre of departure indicates that out-migrations from large towns covered the farthest distance, though weakly significant. It appears that internal migrants leaving small communities often had a relatively nearby large urban centre as their destination, whereas those starting from large city tended to undertake longer journeys, possibly moving to another major urban centre.
The results for causes of out-migration confer statistical significance to that which has already emerged from the descriptive analysis: Out-migrations related to marriage or home are of a smaller radius, those related to work motivations are the longest ones.
Of the socio-economic variables considered, only the level of education shows a positive association with the response variable: higher education levels determine an increase of migration distance.
Of the variables related to out-migrants’ previous experiences, having worked in another municipality does result in a negative relationship with the migratory distance, with statistical significance for men only. No relationship emerges between the distance of the single migrations and having migrated before age 20.
The levels of adjusted R2 are 37 per cent for both sexes, and 43 per cent and
29 per cent for men and women, respectively.
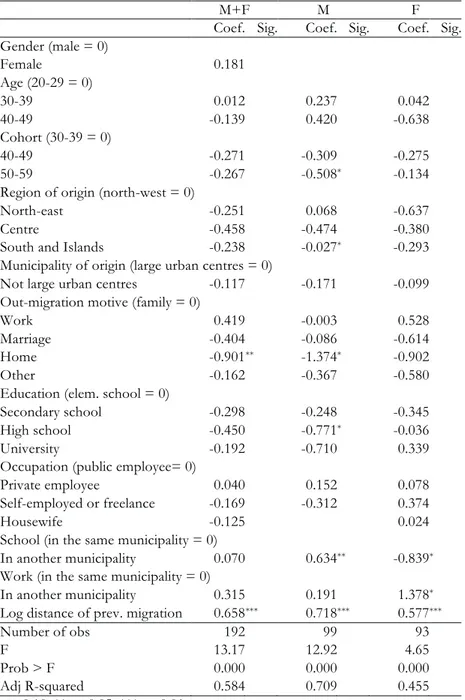
Table 6 presents the results from the model regarding second migrations. All the variables are the same as those of the previous model, except for the indicator of migration in the young ages which is replaced by the logarithm of the distance of previous migration.
These results are very similar to those from the model for first migrations, with the coefficients’ signs almost coinciding. The degrees of significance regarding the single variables are lower, but this is most likely an upshot of the reduction in number of observations. The only result which differs from the previous model is given by the coefficients’ sign in relation to the level of education; whereas it is generally positive for first migrations, it is negative for second. Although the variables never reach the threshold of statistical significance (bar one exception), this is possibly due to the background attributes of the reference category, in their having the lowest level of education. Lastly, there is a positive and highly significant relation between the spatial aspects of the second and first migrations; the greater the distance covered in the first the greater that in the second. Once again, the results from this model suggest that it is not the rank of the migrations that determine their range, but rather the individuals’ personal characteristics, and the background reasons behind these.
The levels of adjusted R2 are 58 per cent for both sexes, and 71 per cent and
Tab. 6. Migration distance for second migration between ages 20-49. Parameter estimates
and standard errors
Coef. Sig. M+F Coef. Sig. M Coef. Sig. F
Gender (male = 0) Female 0.181 Age (20-29 = 0) 30-39 0.012 0.237 0.042 40-49 -0.139 0.420 -0.638 Cohort (30-39 = 0) 40-49 -0.271 -0.309 -0.275 50-59 -0.267 -0.508 * -0.134
Region of origin (north-west = 0)
North-east -0.251 0.068 -0.637
Centre -0.458 -0.474 -0.380
South and Islands -0.238 -0.027 * -0.293
Municipality of origin (large urban centres = 0)
Not large urban centres -0.117 -0.171 -0.099
Out-migration motive (family = 0)
Work 0.419 -0.003 0.528
Marriage -0.404 -0.086 -0.614
Home -0.901 ** -1.374 * -0.902
Other -0.162 -0.367 -0.580
Education (elem. school = 0)
Secondary school -0.298 -0.248 -0.345
High school -0.450 -0.771 * -0.036
University -0.192 -0.710 0.339
Occupation (public employee= 0)
Private employee 0.040 0.152 0.078
Self-employed or freelance -0.169 -0.312 0.374
Housewife -0.125
0.024
School (in the same municipality = 0)
In another municipality 0.070 0.634 ** -0.839 *
Work (in the same municipality = 0)
In another municipality 0.315 0.191 1.378 *
Log distance of prev. migration 0.658 *** 0.718 *** 0.577 ***
Number of obs 192 99 93
F 13.17 12.92 4.65
Prob > F 0.000 0.000 0.000
Adj R-squared 0.584 0.709 0.455
16 5. Conclusions and discussion
This study examines the relationships between internal migrants’ individual characteristics and the risk of migration, and between cause of migration and distance covered.
These findings can be interpreted from two viewpoints: the first reflects the history of internal migration in Italy; while the second explains the distance of migrations with the reasons behind migration and migrants’ background characteristics.
In terms of historical accuracy, these results are consistent with previous literature. Tracing the life-histories of these individuals, migration towards the industrial triangle is clearly legible, as is the drop in migration from the mid-seventies. The youngest birth cohort, born in the fifties, migrated much less because they reached their twenties, the age with the highest propensity towards migration, at precisely the time when economic conditions for migration became considerably less favourable.
Besides geographical context, that reflects the important socio-economic differences of the macro-regions into which Italy is divided, an appreciable role is played by the school, intended as location in relation to the family’s place of residence. To this end, we should consider also migratory experiences before age 20, for which however it would be very difficult to separate migrations due to school reasons from those depending on other motivations, mainly due to family decisions.
The relation that emerges between cause and distance of migration is also compatible with previous studies. Relocations for employment, in a phase when the main areas of attraction and repulsion were at the opposite ends of the country, covered longer distances than those related to marriage or the home. From the seventies, migration generally became increasingly characterised by smaller radius movements.
In conclusion, this examination of internal migrants’ characteristics in relation to migratory distance, gives rise to four main observations: 1) between ages 20 and 30, not only is the propensity to migrate much higher than at any other age, but the first migrations also cover the greatest distances; 2) the level of education has some impact on migratory behaviour, with the territorial mobility of people with a university degree being of a large radius; 3) the field of occupation had a little influence on migratory distance; 4) experiences away from the family home have a different effect on the distance covered in first and second migrations. Those undertaken for work-related reasons reduce the distance of the lone migrations, whereas those motivated by study increase the distance covered in the second migrations.
Besides the substantial aspects related to migration description, this work shows the potentialities of studies on migration based on the entire life-history of subjects. The ad hoc survey allowed gathering both longitudinal and spatial
information, that in turn enabled us to investigate unknown aspects of the phenomenon.
1 More information about the survey are in Dan, Fornasin 2013.
2 We consider in our elaborations a fifth macro region, the rest of the world, that constituted part of the intermediary locations between place of birth and residence in Italy at age 50. The movements from or to these locations are not ‘internal migrations’. For this reason we do not consider these in our analyses.
References
A. Ascolani, R. Baldini 2008, Popolamenti e spopolamenti nell’Italia post-unitaria. Un’analisi tra storia e attualità, in E. Sori, A. Treves (a cura di), L’Italia in movimento: due secoli di migrazioni (XIX-XX), Forum, Udine, 185-212.
U. Ascoli 1979, Movimenti migratori in Italia, Il Mulino, Bologna.
A. Badino 2008, Tutte a casa? Donne tra migrazione e lavoro nella Torino degli anni Sessanta, Viella, Roma.
C. Bartolucci. C. Villosio, M. Wagner 2018, Who Migrates and Why? Evidence from Italian Administrative Data, «Journal of Labor Economics», 36, 2, 551-588.
H. Bastide, A. Girard 1974, Mobilité de la population et motivations des personnes: une enquête auprès du public, «Population», 29, 3, 579-607.
F. Berti 2008, Le migrazioni interne tra mobilità sociale e mobilità territoriale, in F. Berti, F. Zanotelli (a cura di), Emigrare nell’ombra. La precarietà delle nuove migrazioni interne, Angeli, Milano, 15-36.
A.M. Birindelli 2004, Migrazioni, in G. Dalla Zuanna, A. Rosina, F. Rossi (a cura di), Il Veneto. Storia della popolazione dalla caduta di Venezia a oggi, Marsilio, Venezia, 227-247. C. Bonifazi, F. Heins 2000, Long-term Trends of Internal Migration in Italy, «International Journal of Population Geography», 6, 2, 111-131.
V. Bordone 2009, Contact and Proximity of Older People to their Adult Children: A Comparison between Italy and Sweden, «Population, Space and Place», 15, 4, 359-380.
M. Bottai 1990, Storie familiari e storie migratorie: un’indagine in Italia, in A. Bonaguidi (a cura di), Prospettive metodologiche nello studio della mobilità della popolazione, Pacini, Pisa, 145-173.
M.T. Cadwallader 1992, Migration and Residential Mobility: Macro and Micro Approaches, University of Wisconsin Press, Madison.
W.A.V. Clark, S. Davies Withers 2007, Family migration and mobility sequences in the United States: Spatial mobility in the context of the life course, «Demographic Research», 17, 591-622. http://www.demographic-research.org/Volumes/Vol17/20/.
G. Conti 1991, La popolazione, in G. Fuà (a cura di), Orientamenti per la politica del territorio, Il Mulino, Bologna, 41-86.
C.A. Corsini, A. Fornasin 2017, I matrimoni e la distanza matrimoniale nel Granducato di Toscana (1840-42), «Popolazione e Storia», 2, 9-25.
D. Courgeau 1985, Interaction between Spatial Mobility, Family and Career Life-Cycle: A French Survey, «European Sociological Review», 1, 2, 139-162.
M. Crisci, Migrazioni e trasformazione urbana. Roma, 1870-2015, in M. Colucci, S. Gallo (a cura di), Fare spazio. Rapporto 2016 sulle migrazioni interne in Italia, Donzelli, Roma, 47-69.
N. Dan, A. Fornasin 2013, Una indagine CATI per lo studio della mobilità interna in Italia in un’ottica longitudinale, Dipartimento di Scienze economiche e statistiche, Università di Udine, Working Paper, 4.
J. DaVanzo 1982, Techniques for Analysis of Migration-History Data. Rand: Santa Monica Ca. http://www.rand.org/content/dam/rand/pubs/notes/2005/N1824.pdf. Accessed 15 July 2019.
G. De Santis 2010, Mobilità a corto e a lungo raggio e pendolarismo della popolazione italiana, in M. Livi Bacci (a cura di), Demografia del capitale umano, Il Mulino, Bologna, 123-138. G. Fofi 19762, L’immigrazione meridionale a Torino, Feltrinelli, Milano.
A. Fornasin 2011, Determinants of territorial exogamy in Friuli (North-East Italy) in the second half of the nineteenth century, «Journal of Biosocial Science», 43, 4, 453-467.
G. Gabrielli, A. Paterno, M. White 2007, The impact of origin region and internal migration on Italian fertility, «Demographic Research», 17, 705-740. http://www.demographic-research.org/Volumes/Vol17/24/.
S. Gallo 2012, Senza attraversare le frontiere: le migrazioni interne dall’Unità a oggi, Laterza, Roma-Bari.
C. Geist, P.A. McManus 2008, Geographical mobility over the life course: motivations and implications, «Population, Space and Place», 14, 4, 283-303.
P. Ginsborg 19982, Storia d’Italia dal dopoguerra a oggi. Società e politica 1943-1988, Einaudi,
Torino.
A. Girard, H. Bastide, G. Pourcher 1964, Mobilité géographique et concentration urbaine en France. Une enquête en province, «Population», 19, 2, 227-266.
A. Golini 1974, Distribuzione della popolazione, migrazioni interne e urbanizzazione in Italia, Facoltà di scienze statistiche, demografiche ed attuariali dell’Università di Roma, Istituto di demografia.
K. Haandrikman, C. Harmsen, L.J.G. van Wissen, I. Hutter 2008, Geography matters: patterns of spatial homogamy in the Netherlands, «Population, Space and Place» 14, 5, 387-405.
R. Impicciatore, G. Dalla Zuanna 2006, A difficult social mobility. Internal migrations and educational attainments of the children of migrants from the Southern to the Northern Italy, «Genus», 62, 3/4, 155-201.
A. Jampaklay 2006, How Does Leaving Home Affect Marital Timing? An Event-History Analysis of Migration and Marriage in Nang Rong, Thailand, «Demography», 43, 4, 711-725. H. Kulu, N. Milewski 2007, Family change and migration in the life course: an introduction, «Demographic Research», 17, 567-590. http://www.demographic-research.org/ Volumes/Vol17/19/.
D.S. Massey 1990, Social Structure, Household Strategies, and the Cumulative Causation of Migration, «Population Index», 56, 1, 3-26.
E. Marinelli 2013, Sub-national Graduate Mobility and Knowledge Flows: An Exploratory Analysis of Onward- and Return-Migrants in Italy, «Regional Studies», 47, 10, 1618-1633. L. Mencarini 1996, Rassegna degli studi sulla mobilità interna italiana nei primi anni ’90, «Genus», 52, 3/4, 173-188.
G.A. Micheli 1990, Città, circolazione, permanenza: ancora sulle implicazioni teoriche e operative del concetto di mobilità, in A. Bonaguidi (a cura di), Prospettive metodologiche nello studio della mobilità della popolazione, Pacini, Pisa, 17-37.
C.H. Mulder, P. Hooimeijer 1999, Residential relocations in the life course, in L.J.G. Wissen, P.A. Dykstra (eds.), Population issues: An Interdisciplinary Focus, Plenum, New York, 159-186.
C.H. Mulder, M. Van Ham 2005, Migration histories and occupational achievement, «Population, Space and Place», 11, 3, 173-186.
C.H. Mulder, M. Van der Meer 2009, Geographical Distances and Support from Family Members, «Population, Space and Place», 15, 4, 381-399.
M. Paci 1976, Mercato del lavoro e classi sociali in Italia. Ricerche sulla composizione del proletariato, Il Mulino, Bologna.
G. Pourcher 1965, Un essai d’analyse par cohorte de la mobilité géographique et professionnelle en France, «Acta sociologica», 9, 1/2, 137-151.
G. Pourcher 1966, Un essai d’analyse par cohorte de la mobilité géographique et professionnelle, «Population», 21, 2, 357-378.
E. Pugliese 20062, L’Italia tra migrazioni internazionali e migrazioni interne, Il Mulino,
Bologna.
M.D.M. Rahman, S. Akter, A. Aahman 2010, Distance associated with marriage migration in a Northern and a Southern region of Bangladesh: an empirical study. «Journal of Biosocial Science», 42(5), 577-586.
F. Ramella 2003, Immigrazione e traiettorie sociali in città: Salvatore e gli altri negli anni sessanta, in A. Arru, F. Ramella (a cura di), L’Italia delle migrazioni interne, Donzelli, Roma, 339-385.
E.G. Ravenstein 1885, The laws of migration, «Journal of the Statistical Society of London», 48, 2, 167-235.
F. Rossi 1990, Nuove informazioni sui migrati, 1976-81. Un’indagine esplorativa sui dati originali, in A. Bonaguidi (a cura di), Prospettive metodologiche nello studio della mobilità della popolazione Pacini, Pisa, 39-57.
A. Schwartz 1973, Interpreting the Effect of Distance on Migration, «Journal of Political Economy», 81, 5, 1153-1169.
H.S. Shyrock Jr., E.A. Larmon 1965, Longitudinal Data on Internal Migration, «Demography», 2, 1, 579-592.
F. Simini, M.C. González, A. Maritan, A.-L. Barabási 2012, A universal model for mobility and migration patterns, «Nature», 484, 96-100.
S. Sinibaldi 2008, Spose calabresi in Toscana. L’emigrazione matrimoniale in Italia nella seconda metà del Novecento, in E. Sori, A. Treves (a cura di), L’Italia in movimento: due secoli di migrazioni (XIX-XX), Forum, Udine, 349-372.
S.A. Stouffer 1940, Intervening opportunities: a theory relating mobility and distance, «American Sociological Review», 5, 6, 845-867.
A. Treves 1976, Le migrazioni interne nell’Italia fascista, Einaudi, Torino.
G.K. Zipf 1946, The P1*P2/D Hypothesis: on the intercity movement of persons, «American Sociological Review», 11, 6, 677-686.
Riassunto
Aspetti spaziali dell’emigrazione interna in Italia. Un approccio longitudinale
L’articolo tratta l’emigrazione interna in Italia tra il 1930 e il 2010 in una prospettiva longitudinale. In particolare sono analizzati il rischio di migrare e le distanze migratorie per gli spostamenti di primo e secondo ordine delle persone delle età 20-49. I dati sono
stati raccolti con l’utilizzo di una indagine ad hoc condotta con il metodo CATI
20
residenti in Italia. Per misurare il rischio migrare si utilizza un modello di sopravvivenza, mentre per studiare la distanza migratoria sono utilizzati dei modelli di regressione OLS (Ordinary least squares). Le variabili che emergono come più influenti sul rischio di migrazione sono il luogo di residenza del soggetto e la precedente storia di vita. La distanza migratoria dipende in gran parte dal contesto socio-economico dei migranti e dal motivo che ha causato la migrazione. Le principali determinanti, a livello individuale, delle migrazioni interne sono il livello di istruzione e il fatto di aver già effettuato una migrazione in giovane età.
Summary
Spatial aspects of internal migration in Italy. A longitudinal approach
The paper investigates the internal migration in Italy between 1930 and 2010 in a longitudinal perspective. Risk and distances of migration of first and second order are
analysed for people with age 20-49. Data are collected using an ad hoc CATI
(Computer-Assisted Telephone Interviewing) system survey, involving around 2,000 respondents born and resident in Italy. A survival model is used for measuring risk of out-migration and OLS (Ordinary least squares) regression models for distance. The variables that emerge as most influencing the risk of migration are the subject’s place of residence and previous life-history. Migratory distance greatly depends on the migrants’ socio-economic background and reason for migrating. The main determinants of internal migration at individual level are education and having previously migrated at a younger age.
Parole chiave
Migrazioni interne; Italia; Indagine telefonica; Analisi spaziale; Analisi longitudinale. Keywords