«
Alliance membership impact on the Russian aviation market
»
Research Paper
Master degree in Economics
at University of Barcelona
Submitted by:
Roman Safronov
Advisors: Xavier Fageda, Joan Calzada
Abstract: This paper examines the impact of airline alliances on supply in the Russian aviation market. We use the difference-in-differences model to analyze the causal relationship between being a member of the alliance community agreements, and the number of seats and flight frequency offered at the route level. Furthermore, this paper is aimed to find out differences between private-owned and public-owned firms performances in the alliance. Using data on the international flights from European to Russian cities corresponding to the period 2002-2019, theoretical explanations on changes in number of seats are empirically tested. Our results show that the traffic growth is concentrated in dense routes. We also find that the positive impact of alliances is centered on a private S7 Airlines, while we do not find a positive effect for Aeroflot, a state-owned airline that is the largest operator in Russia.
JEL: L93 Air transportation
Keywords: competition, airlines alliance, passenger traffic, Russian aviation market
1.Introduction
Alliances between airlines have shaped the air transport market in the past three decades along with the emergence and success of low-cost carriers. Alliances became common in the early 1990s, after KLM and Northwest Airlines signed in 1989 a large-scale code-share agreement that is considered as the beginning of the global strategic alliances era. Travelers received a possibility to organize a trip on a single designated code for the first time in aviation history from many points via Amsterdam, likewise to and from a plenty of locations beyond Detroit (Wickson, 2017). After this first strategic alliance, several new competitive global alliances came into sight. The largest worldwide are Star Alliance (created in 1997), Oneworld (1999) and Sky Team (2000). Nowadays, these alliances cover more than a half of the international passenger traffic.
Airlines have a variety of incentives to participate in the alliances and the terms of the cooperation greatly depend on market characteristics. Agreements contain different features of pricing and marketing collaboration, code-sharing, schedules regulation, or the joint use of airport services like ground handling and catering. This cooperation allows carriers to combine their connections, and hence, to expand their presence to more airports. In addition, alliances increase airlines’ feeder traffic, which can be crucial for long-haul operations.
In spite of their benefits, there is a growing concern by competition authorities on the effects that alliances might have on competition and consumers’ welfare. The economic literature has shown that consumers benefit from the airline consolidation due to the removal of double marginalization in connecting flights (Bruckner and Whalen, 2000; Bilotkach, 2005; Flores-Fillol and Monquer-Colonques, 2007). Nonetheless, these benefits can disappear, when airlines gain market power and increase the prices (Bilotkach and Hüschelrath, 2013). This effect might be especially important on overlapping routes, where initially affiliated airlines were competitors. Alliances also allow participants to create entry barriers and, hence, to reduce the number of competing airlines. Indeed, the growing coverage of alliances makes complicated to ensure feeder traffic at several airports for non-allied airlines (European Commission report, 2010). Marie-J. Malé, former managing director of SkyTeam and current president of the Vanilla alliance, has indicated three key points that support the growing power of alliances: globalization of the economy, liberalization of international aviation agreements, and technological progress (Stellin, 2011), which may lead to the decrease in the competition level.
In the last years, the Russian airline market has been affected by two relevant alliances. First, on April 2006 Aeroflot became a member of SkyTeam, which is one of the three major airline alliances worldwide. As of January 2020, SkyTeam consists of 19 carriers from five continents and flies to more than 1,030 destinations in about 170 countries, operates more than 15,440 daily flights and transports for than 670 million passengers per year (SkyTeam press release, 2020). Second, on November 2010 S7 Airlines became a member of Oneworld, which was founded by American Airlines, British Airways, Canadian Airlines, Cathay Pacific, and Qantas. This alliance currently has 14 members and 30 affiliated airlines. Oneworld is also one of the three largest global alliances. It operates a fleet of 3,500 aircraft, serve about 1,100 airports in more than 180 territories with approximately 14,000 daily departures (Oneworld press release, 2020). The main objective of this research is to analyze which was the effect of these two alliances in the Russian market. First, we examine the effects of the alliances in the number of seats and flight frequency at the route level. Second, we analyze whether overlapping services of alliance partners in a route has played a role in explaining the impact of alliances. Third, and finally, we investigate the relevance of public ownership in the effects of alliances. Aeroflot is a state-owned national flag carrier with a large presence in the Russian market, while S7 Airlines is a private-owned firm. Hence, we are interested to check out, whether these two alliances have had different effects on competition.
In order to answer these questions, we use a dataset of international flights from European and former USSR countries to Russian cities from 2002 to 2019. Most of our data comes from RDC aviation (capstats statistics). Additionally, information was retrieved from online aviation databases (IATA, ICAO, EASA, Russian aviation agency (Rosaviatsia), individual airline websites, and The World Bank data). Our analysis covers the period 2002-2019 to balance the «before» and «after» periods of the creation of two alliances, so that we can follow possible changes in company performance outcomes. We have 54,208 observations at the route-level with 1,213 different routes. The sample has information on 88 airlines including major commercial, regional, and low-cost carriers operating the Russian market. Regarding the airports considered in the analysis, there are 187 non-Russian airports located in 173 cities in 42 countries (EU and EEA countries, former Yugoslavia and several countries from The Commonwealth of Independent States). Moreover, we consider 71 airports located in 68 Russian cities.
A difference-in-difference framework model is implemented to analyze the effects of the alliances. Specifically, we compare the characteristics of the routes affected by the alliance (treatment group) before and after the agreement, and we also compare them with the routes that were not affected by the alliance (control group). The empirical model makes an attempt to assess whether alliances have modified the number of seats offered and the flight frequency in the affected routes, controlling for observed and unobserved drivers of demand and supply.
The main findings of the paper are that the alliances have produced a positive impact in the number of seats offered in the affected routes, although this effect is mainly concentrated in denser routes. Hence, we do not find support for potential anticompetitive effects of alliances. However, the positive impact of alliances is reduced in routes, in which partner airlines have overlapping services. Regarding the flight frequency evolution, we obtain a positive impact of the alliances, but this is concentrated only in Oneworld alliance, that has the participation of S7 Airlines. Therefore, our hypothesis of the increase in the number of flights from Russian airports to the hubs of the Oneworld alliance was proved.
The results confirm the idea that airline ownership type has a relevant role in the impact of the alliances. Before joining to alliance, Aeroflot has already provided a large number of seats on the routes, since as a state flag carrier it was responsible of connecting an extensive network of Russian destinations. In contrast, joining the Oneworld alliance has helped S7 Airlines to have more seats and frequencies on their routes. Thus, we make a conclusion that alliance effect on competition is different in relation to the property class. The rest of the paper is structured as follows: chapter 2 reviews both theoretical and empirical literature of the alliance impact on different parameters, including among others the passenger traffic, fares and competition. Chapter 3 describes the evolution and current standings of the Russian air transportation markets and presents the main characteristics of the alliances we examine. Section 4 shows the mechanisms, data and empirical strategy implemented in this research. Section 5 provides main results from the empirical analysis. Finally, section 6 summarizes our conclusions and comment on the possible extensions of the project.
2. Literature review
The analysis of the alliances effects on competition has become an important topic in the air transportation literature in the last decades. While the theoretical literature has examined a large variety of topics regarding the impact of alliances, most of the empirical research focuses on their effects on fares and traffic. We next present the result of these studies considering the research lines that are closer to our work.
Several papers have found that alliances have a positive impact on traffic on the affected routes. Bissessur and Alamdari (1998) were among the first in the literature to recognize that alliances increase airlines’ coverage and reduce their costs. Fernandez de la Torre (1999) examined the North-Atlantic alliance between KLM and Northwest Airlines and found an increase in traffic as a direct outcome of both the strengthening of market positions on particular routes by cause of the alliance formation and the growth in network coverage. By connecting the partners’ network through hub-to-hub connections, alliances use each other member’s network to feed traffic. Park and Zhang (1998) studied the effect of regional alliances in the North Atlantic market in the 1992-1994 period and found that partner carriers traffic rises on alliance routes more, than it does on the rest of routes. Oum, Park and Zhang (2000) empirically confirmed the results of this previous paper. In particular, they studied the alliance influence on partner airlines’ by analyzing changes in passenger volume in alliance routes with those in non-alliance lines. Applying the panel data of leading alliances1 performing non-stop routes for 1992-1994 period in North Atlantic market, authors discovered that majority of collaborating airlines registered greater traffic in their alliance routes up to 66.8%, while non-alliance lines showed a decline of 3.2%. According to Iatrou and Alamdari (2005), who performed a survey of airlines-members management departments (Star Alliance, SkyTeam, Oneworld, Wings2), around 90% of respondents confirmed a traffic augmentation between one and two years since they established a cooperation with other air carriers. The authors showed that the remarkable growth in passenger volume was detected mainly on hub-hub routes. In their empirical paper, Iatrou and Skourias (2005) tested time series from 124 alliance routes within four alliances and showed that alliances give rise to an enhancement in passenger traffic of about 9.4%.
Another group of papers have examined the effect of alliances on airfares. By using a theoretical model, Brueckner (2001) investigated an alliance case, where two partners serve simultaneously a parallel flight, which was earlier served independently by each of them, and some interline flights. According to the author, cooperative pricing creates a descending trend of fares in comparison with the pre-allied case. Additionally, Brueckner and Whalen (2000) empirically assessed the alliance effect on air fares by evaluating 50 international alliance pairs. They showed that tariffs of alliance partners are about 25% less, than those of non-allied airlines, and this decline is due to the internalization of an adverse externality that is formed by the uncoordinated choice in case of the alliance omission. Correspondingly, traffic density increases. The enlargement of networks and creation of the supplementary revenue are among the main reasons why airlines choose to cooperate in alliance framework. Netessine and Shumsky (2005) studied airlines profit and noticed that a bigger number of seats is reserved for travelers with greater ticket price.
Hamilton and Morrish (2002) showed theoretically that strategic alliances stimulated airlines to develop their efficiency in the 1986-2000 period. They found a higher flight density and lower tariffs as counter-balancing forces; hence, no claim could be made for a positive effect on affiliates’ competitive position. The alliance impact on airlines’ efficiency and output are examined experimentally in Peypoch and Barros (2009), and Soderberg and Sjogren (2011). The first article used a non-parametric approach (Data Envelopment Analysis) and found that alliances increase efficiency by a two-step mechanism. At the beginning, airlines are arranged in accordance with their overall productivity, and then a truncated regression analyzes the efficiency drivers. The second paper implements a method of parametric-stochastic frontier. The relationship between aviation alliance and its efficiency is observed from distinctive points of view, that is to say: an appropriate management structure in alliances (de Man et al., 2010), as well as a partial antitrust immunity (Bilotkach and Hüschelrath, 2012). The former considers a robust alliance model, that provides an equal profit-sharing for all competitors, and decreases the likelihood of making changes, which may lead to significant expenses for members.
1 British Airways, USAir; Delta Air Lines, Swissair, Sabena; KLM, Northwest Airlines; Lufthansa, United Airlines.
2 Wings Alliance (Northwest Airlines, Continental Airlines, KLM and Alitalia) was an alliance project declared unnecessary in September 2004,
In a theoretical paper, Park (1997) studied the impact of parallel and complementary3 airline alliances on output levels and public welfare.4 As stated, complementary alliances enhance social prosperity, while parallel alliances reduce it. This result is explained in a way that parallel alliances firstly decrease a level of competition between partners, thereafter they entail an increase in prices and welfare losses. Furthermore, there are several empirical papers that have shown the positive impact of alliances on economic welfare, reporting better services as a result of a better coordination of the airlines connecting traffic, lower unit costs and lower air fares as a result of the increased traffic (Brueckner and Spiller, 1994; and Park and Zhang, 2000; Asia-Pacific Business Research Conference, 2013). In short, positive correlation has been found between alliances and consumer’ welfare.
Some papers have examined the impact of alliances on competition. Netessine and Li (2011) analyzed changes to carriers’ entry and capacity decisions after cooperating with other airlines in alliances. Their focal point is on the American alliance market for the period of 1998-2006. Although theoretical models propose that alliances should reduce competition as a consequence of the drop in the alliance production level, authors identified the partners’ intention of overlapping and expanding their capacities in markets in which they already cooperate, while acting the contrary in markets operated by rivals from other alliances. Partner air carriers discover larger demand operating their networks after the alliance formation, that leads them to raise overlapping, boost capacities, and set up higher prices (Cho et al., 2007; Hu et al., 2013). Finally, our paper also contributes to the literature on the Russian air transportation market. To our knowledge, there are very few evidences of the alliances impact on the Russian aviation industry. The existing research mostly focus on such issues as aircraft market distribution by regions (Zinchenko, 2017), the interaction between airlines in the internal market (Skrylnikova, 2007), level of development of ground infrastructure (Demin et al., 2015), and the dynamics and growth rate of passenger and freight turnover. A summary of the main results from these papers indicates that the growth rate of air passenger traffic in the Russian segment of the market remains above the global average.
3. The Russian air passenger aviation market 3.1 The aviation market in Russia
This section describes the Russian air passenger market and main characteristics of the alliances that are examine in the empirical analysis. Gerasimov and Chsherbakov (2019) have analyzed the relevance of the Russian aviation market for the country’s economy. They show that in the period 2007-2017 the share of aviation sector in the GDP has increased from 0.72% to 0.94%. However, the relevance of the market is substantially smaller than in other countries (for instance, the population of the United Kingdom is almost two times less, however a total traffic of UK airlines is 1.73 times higher, thus the share of the aviation sector in the UK is three times larger, in accordance with Oxford Economics journal), which leads to the conclusion that the Russian air transport is underdeveloped. One of the apparent reasons for this is the continuous growth of airline market concentration, so as the Herfindahl-Hirschman index (HHI) has increased from 662 (2007) to 1356 (2017).
In recent decade, Russia has taken certain steps to liberalize air services. In 2010, Russian air carriers asked the government to liberalize international air travel, mainly in the routes that connect with European countries. Aeroflot was the only airline in the USSR and after the collapse of the Soviet Union all bilateral agreements with the largest European carriers belonged solely to Aeroflot. In this regard, all other Russian airlines tried to eliminate this historically established monopoly (Tasun, 2015). As a result of the
3 Complementary alliance is the combination of existing networks by two carriers in order to build a new network and provide services for
connecting passengers. Parallel alliance is the collaboration between two firms competing on the same routes.
liberalization, between 2010 and 2013 «second» and «third» designated air carriers appeared in most of the routes connecting Russia with European countries.5 «Open skies» status is currently active at the airports of Vladivostok (since 2011), Sochi (since 2014), Kaliningrad (since 2015), and Saint-Petersburg (2020). The emerging process of liberalization has also affected other markets, primarily the Middle East and Far East.6
In spite of these agreements, Lukyanov et al. (2018) have shown that there are substantial technological, structural, and administrative barriers to enter into the Russian market. These factors impede competition and create doubts regarding its existence in the sector. Majority of local aviation experts through various media sources argue that it seems appropriate to continue the liberalization of international air travel on routes from Moscow to the most popular destinations for Russian airlines, which would undoubtedly have a stimulating effect on the increase in passenger traffic.
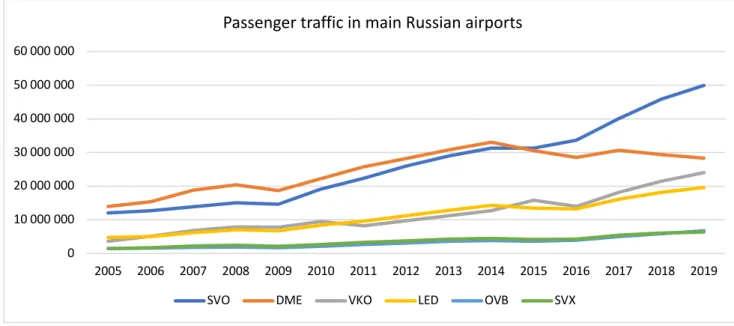
At present, Russia has 241 civil airfields, including 78 operating international airports (as reported by Rosaviatsia). The largest airports of Russia receiving domestic and international flights are located in Moscow. Sheremetyevo (Moscow, SVO, around 50 million passengers in 2019); Domodedovo (Moscow, DME, around 28 million passengers in 2019, as stated in the S7 annual reports); Vnukovo (Moscow, VKO, around 24 million passengers in 2019, as reported by Vnukovo press office); Pulkovo (Saint Petersburg, LED, around 20 million passengers in 2019, in accordance with Pulkovo press release); Tolmachevo (Novosibirsk, OVB, around 7 million passengers in 2019, in line with Tolmachevo airport press office); Koltsovo (Ekaterinburg, SVX, around 6 million passengers in 2019, retrieved from Koltsovo airport report). Figure 1 illustrates the traffic growth in all airports except in private Domodedovo airport, which has experienced the traffic slowdown for two sequential years due to the long-term deferment of its airport infrastructure development (Russian aviation insider, 2020).
Figure 1. Evolution of passenger traffic at main Russian airports from 2005 to 2019. Source: Author (based on the annual reports of 6 mentioned airports)
5An agreement was reached with Italy for the multiple appointment of airlines for Moscow-Rome and Moscow-Milan lines, and with France on
the Moscow-Paris and Moscow-Nice routes. Niki (Austrian airline) was operating under the intergovernmental agreement between Russia and Austria. The second designated carrier from two sides was introduced on the Moscow-Prague line in 2014 and ot the Moscow-Helsinki route in 2013.
6 Persian Gulf carriers (Emirates, Qatar and FlyDubai) were allowed to operate in Russia; S7 entered into a code-sharing agreement with Etihad
Airways in Moscow-Abu Dhabi route. Turkish Airlines operates direct flights to Russian regional centers and are especially successful during the summer seasons. 0 10 000 000 20 000 000 30 000 000 40 000 000 50 000 000 60 000 000 2005 2006 2007 2008 2009 2010 2011 2012 2013 2014 2015 2016 2017 2018 2019
Passenger traffic in main Russian airports
In the last years the market concentration has importantly increased. While in 2004, 99% of both the internal and international market was shared between 85 airlines, in 2019 there were 35, and in the same period the market share of the top-five airlines has increased from about 49% to 67%. The market share of the 15 largest airlines has increased less noticeably, from 70% to more than 73%, respectively. At the moment, the five biggest airlines in Russia by passenger traffic are Aeroflot, S7 Airlines, Rossiya, Ural Airlines and Pobeda, according to the Russian Aviation Insider source.
Figure 2. Annual growth rate of the total passenger traffic of Russian major airlines in 2011-2018 period, % Source: Strategic research center (2019)
Aeroflot is Russia’s public largest airline and globally among the top airlines in terms of passengers traffic. Aeroflot Group accounted for 40.7% of Russian aviation market, carrying 35.7 million passengers in 2018 with a 4.1% increase next year (37.2 million passengers in 2019). Aeroflot operates 163 regular routes across 56 countries. The second biggest airline in the country is private-owned S7 Airlines, which has the extensive network of routes (181 cities in 26 countries), and to carry 14 million passengers per year. The third biggest airline is Rossiya Airlines (75% owned by Aeroflot) with its hub in St. Petersburg Pulkovo. It recorded a growth of 4% and served 11.6 million passengers in 2019. Fourth is Ural Airlines based in Ekaterinburg Koltsovo, captured a traffic growth of 7% for passenger numbers of 9.6 million. Lastly, Pobeda (another Aeroflot subsidiary) raised its passenger numbers to almost 9.6 million as well.
Low-cost market segment competition in Russia is growing nowadays. In 2019, the share of low-cost carriers (LCC) almost reached 10% of domestic and 6% of international seats. Currently, the following LCC are operating in Russian-European market: Pobeda (Russian), Wizz Air (Hungarian), Blu Express (Italian), Meridiana fly (Italian), Pegasus (Turkish), flyDubai (UAE), smartwings (Czech), Vueling (Spanish), AirBaltic (Latvian).
Table 1. Passengers traffic flow of Pobeda in 2014-2018
2014 2015 2016 2017 2018
Passengers traffic, (in
million passengers) 0,11 3,1 4,3 4,6 7,2
Pobeda is the only national LCC, based in Moscow Vnukovo and founded in 2014 instead of another LCC called Dobrolet, which was ceased due to EU sanctions. The airline was rapidly launching new routes, so
-40% -30% -20% -10% 0% 10% 20% 30% 40% 50% 2011 2012 2013 2014 2015 2016 2017 2018
Annual growth rate of the total passenger traffic of Russian-based airlines
that the expansion has generated the 43% growth in traffic in 2019. It takes around 40% of LCC flights capacity to and from Russia (CAPA Centre for aviation, 2019).
However, according to various surveys in aviation industry, there is a little competition in internal routes segment and probably a higher level of the low-cost competition can help to stimulate the growth. The head of the Federal Antimonopoly Service declared the necessity of more competition in low-cost sector and proposed to launch a new airline to compete with Pobeda. Ministry of Transport supported this idea, however, as of May 2020 such initiative is put on hold.
Sinitsky (Infomost Consulting, 2019) underlines that competition is intense due to the aggressive strategy of Aeroflot and of its low-cost subsidiary Pobeda. It seems that the business model, where carriers suggest comparable products and compete in air fares, became weak. In this situation, the market requires airlines to differentiate themselves, search for specific passenger niches, and develop personalized offers.
Main airlines in the regional segment are Nordavia (based in St.Petersburg Pulkovo, most of the flights operated in the north-western part of Russia), Red Wings (performs regular flights from Moscow Domodedovo to the central and southern regions) and IrAero (Irkutsk airport hub, focus on Siberia and Far East regions).
The situation when the only available market for regional airlines is the limited group of customers who require a link from their regions to the closest big airport to travel long way, as noticed by Ryanair ex-deputy executive Michael Cawley, is applicable to the Russian regional market. Regional airlines are likely not able to face competition and require substantial investments. For example, according to the national development agency (Rostech), in the next years Russian regional airlines will need to buy about 800 aircraft in order to grow and not to lose the competition to foreign airlines. Moreover, according to the Federal Air Transport Agency, in the next 10 years, it will be necessary to replace about 130 old aircraft models that will be decommissioned (Volobuev, 2019).
Regional airlines play an important role in feeding traffic for trunk lines. These airlines could be monopolists on certain routes, but they occupy a small fraction of the total traffic volume. In the regional markets the merger of some airlines and home airports led to further monopolization. For instance, Gazprom-Avia is an owner of two airports in Yamal peninsula, while Komiaviatrans has 7 airports in its ownership in the Republic of Komi (Avianity, 2020).
3.2 The Alliances
Founded by five airlines, the Oneworld alliance became operational in 1999. Currently, alliance includes 14 members, as well as Fiji Airways as a connect partner, and 30 affiliated airlines on six continents.7 Oneworld passenger traffic accounts for more than 550 million passengers carried per year (by 2019). Its member airlines together operate a fleet of 3,500 aircraft, serve approximately 1,100 airports in more than 180 countries with 14,000 daily departures (Oneworld press release, 2020). Oneworld market share is 15,6%, while the leader by this parameter is Star Alliance (21,7%). Iberia is taking first place by number of codeshares among all alliance members. The number of seats has a trend to decline in two consecutive years, falling to 649 million (2018) after a peak of almost 677 million (2016). Meanwhile, the number of flights also shows a little downturn, accounting for 4,61 million in 2018, and compared to 4,63 million in 2017, with the decreasing tendency in every year after 2015 (Mazareanu, 2019).
7 This includes British Airways, Finnair, Iberia, and S7 Airlines in Europe. Cathay Pacific, Malaysia Airlines, Royal Jordanian, Qatar Airways,
SriLankan Airlines, and Japan Airlines in Asia. Additionally, Qantas in Australia, LATAM in South America, and American Airlines for North America, and the newest member Royal Air Maroc based in Africa. Alaska Airlines intends to join the alliance by summer 2021.
The integration of S7 into Oneworld took place in November 15, 2010, with the unanimous acceptation of the 10 members of the alliance. Initial information on the negotiations between S7 Airlines and Oneworld appeared in the summer of 2007 and in total the negotiations process took more than 3 years. Back in 2007, Vladislav Filev, who held the post of general director of the airline, explained that the integration in a global alliance was inevitable for such a large network carrier as S7 Airlines. British Airways was the most interested in S7 addition to the alliance, and, in general, alliance was looking for the perspective partner to expand and discover the Russian market (Aviation news journal ATO.ru).
As a result, in 2010 the Oneworld route network significantly increased by 55 destinations (including 36 Russian) with 8 new countries added (Azerbaijan, Armenia, Kazakhstan, Kyrgyzstan, Moldova, Tajikistan, Turkmenistan and Uzbekistan). At the same time, direct competition on routes practically does not arise, as Oneworld members have flied only to Moscow (SVO), St. Petersburg and a few to Ekaterinburg. Alongside with that, the overlapping of the routes was almost avoided, since S7 did not operate most part of its international flights from these airports.
Aeroflot became a member of SkyTeam alliance on 14th April, 2006. Launched in 2000, SkyTeam includes 19 airlines from five continents. As of May 2020, SkyTeam connects to more than 1,036 destinations in around 170 countries and operates more than 15,445 daily flights with the annual number of passengers equaled to 676 million (SkyTeam press release, 2020). Air France is the leader in codeshares rating within this alliance. The number of flights has been increasing for five sequential years, having a maximum of 6,18 million flights (2018) and 5,6 million as a minimum (2014). Alliance offered about 918 million seats in 2018, which is a notable growth after 842,92 million seats in 2014. Such increase is the highest among three major alliances (Mazareanu, 2020).
The integration of Aeroflot into SkyTeam was firstly announced in 2001. Participation in the alliance allowed to increase the number of jointly operated flights, while maintaining the network of its own routes. According to Vasilchenko (2010), each SkyTeam member was a natural leader in its region, so Aeroflot could strengthen Moscow's role as the main entry point to Russia. With the inclusion of Aeroflot, SkyTeam also covers new markets in CIS and Eastern Europe. In turn, the global alliance network allowed Aeroflot to expand its presence in Europe, Africa, North and South America as well as opened Middle East market. Back in history, Aeroflot was considering two alliances to join: Star Alliance or SkyTeam. The latter had an advantage, since it did not have a wide network of connections in Russia at that moment, while Lufthansa, the leader of Star Alliance, was already operating in 8 destinations across the country. Taking into account this overlapping in existed routes, Aeroflot took a decision in favor of SkyTeam. Air France and KLM did not have in their schedule any flights to Russia except St. Petersburg, CSA was flying to St. Petersburg and additionally had only a few flights to Ekaterinburg and Samara. Hence, the level of complementarity between Aeroflot and its partners was quite high in the markets of Russia and CIS. Another example is the following: Aeroflot has a route Moscow-New York, afterwards its partner Delta Airlines will distribute passengers from this flight to various locations in US, i.e. a large intercontinental part of route is implemented by Aeroflot, so as it allows to increase the passengers traffic overall. In case of Star Alliance, this is not possible, since this community has a hub in Chicago, but Aeroflot is not flying there, i.e. all its traffic which should be allocated between various locations in US has to be distributed through Frankfurt. In other words, Aeroflot becomes a traffic feeder in such a case: it delivers its passengers to Frankfurt, and from there passengers are able to fly to any place around the world.
4. Mechanisms, Data and Empirical strategy 4.1 Mechanisms
This section presents the main hypotheses about the effects of the alliances in the Russian market that will be tested in the empirical analysis. The economic literature has shown that strategic alliances select new partners considering the complementary potential of their routes (Lordan et al., 2014). In spite of this, the variety of routes usually operated by airlines may lead to different situations. First, some of the partners’ routes networks can be considered as complements and after the alliance airlines can create new routes by connecting flights. Since each carrier takes the interests of allied airlines into consideration, alliance diminishes the double marginalization and favor traffic increase due to lower air fares (Brueckner et al., 2019). As a result, alliances of complementary networks offer passengers lower price and more flight connections.
It might be a negative effect with the competition between airlines within the same alliance due it is a weaker one; and a positive cooperation effect, when airlines in same alliance eliminate the double marginalization. For instance, the route Moscow-Paris-Barcelona provides two markups if operated by non-allied airlines, and there is one markup in case of organizing a route within the same alliance. However, the fare-setting collaboration allows the alliance members to offer overlap between the A and B gateways and to increase their tariff in the AB market in anticompetitive manner. Alliance may limit seats for AB passengers and expands seats for interline travelers flowing across the gateway route, whose traffic grows in response to the lower fare they face (Brueckner, 2001).
Second, some of the airlines’ routes can be considered as substitutes (parallel alliances) and in this case an alliance can result in softer competition and higher prices (Bamberger et al., 2004). The parallel alliances are more likely to hold one primary airline on a route with the ability to control prices.
Third and finally, there is also a possibility that alliances increase intra-alliance competition. Alliances can reduce network vulnerability, lead airlines to expand their capacity and to increase overlaps between partners, even when demand does not increase. Indeed, the literature has shown that air carriers are eager to build a higher traffic in markets dominated by their alliance partners (Li, Netessine, 2011). This situation can imply a reduction in fare rates.
In order to test these different effects, our empirical analysis will examine the effect of alliances on the number of seats offered and on the frequency of flights. Our first hypothesis is that the alliances have increased the number of connections from Russian airports to the hubs of the alliance airlines. Our second hypothesis is that after the alliance there was a reduction in the number of seats offered in the existing routes, because airlines increased their market power and tried to reduce costs and increase the prices. The effect of the alliances is expected to be larger in routes where Russian airlines and members of their new alliances were competing. In routes in which there was not competition, we should not see an effect in the number of seats and flights. As a refinement of this hypothesis, we will test if overlapping has increased in existing routes.
Neither SkyTeam, nor Oneworld had previously an extensive network in Russia, thus the addition of Aeroflot and S7 Airlines respectively, were significant contributions to these organizations. We believe this fact should be reflected in the increased international passenger traffic on Russian-European routes, whether on the raise in number of seats offered or in the number of flights, or both of them.
Since our empirical research will consider the alliances on Aeroflot, a state-owned firm, and S7 Airlines, a private-owned firm, it seems important to investigate the differences of ownership in the effects of alliances.
Aeroflot is a national flag carrier with a market share of 32% on the international traffic among Russian-based airlines and that had a wide network of routes before becoming member of SkyTeam. In this sense, we expect this alliance to exploit network complementarities and facilitate the creation of new routes, but to have a neutral effect in the competition of existing routes. On the other hand, we assume that the alliance of S7 Airlines with the increased number of cooperation agreements with other airlines is about to create new routes, but also to increase a competitive effect in existing routes. Taking this into account, the third hypothesis we want to test is whether there exists a difference in the alliance impact between public and private firms.
4.2 The Data
The econometric analysis considers a dataset of international flights from European to Russian cities from 2002 to 2019. The analysis covers this particular timeframe to balance the «before» and «after» periods of the alliance agreements, so that we can follow possible changes in company performance outcome. We have 54,208 observations at the route-level. Data for the airlines market comes from RDC aviation (captstats statistics), data for income (Gross Domestic Product per capita) at the country level is retrieved from World Bank (World Bank Development Indicators), and data for population at the urban level is added from United Nations (World Urbanization Prospects statistics). Note that income data for 2019 is taken from 2018, since this is the last year with available information.
We have also gathered information from other sources for descriptive purposes, mostly from online aviation databases (IATA, ICAO, EASA, Russian aviation agency - Rosaviatsia) and airlines’ and airports’ websites. These data sources provide information about existing routes, departure and arrivals hubs, technical data about the capacity of aircraft for specific routes (number of seats, number of flights per month). ICAO provides the traffic exposure data necessary to derive trend level indicators and covers data on air carrier traffic, on-flight origin and destination, controls for international passengers and airports traffic, as well as the air carrier fleet. Rosaviatsia is the main source of the statistics for the Russian air transportation market. Official websites of S7 Airlines and Aeroflot provides annual reports, from which we extract data on international traffic, routes map (including evolution in opening new lines), and firms’ target markets.
The sample includes 88 airlines including major commercial, regional, and low-cost carriers. The carriers of primary interest are European members of Oneworld (British Airways, Finnair, Iberia, S7 Airlines) and Sky Team (Aeroflot, Air Europa, Air France, Alitalia, Czech Airlines, KLM Royal Dutch Airlines, Compagnia aerea TAROM), who have flights to Russia in their schedules. Most of airlines belonging to these alliances are former flag carriers of their countries, such as KLM in Netherlands, Air France in France, TAROM in Romania, or Finnair in Finland.
Our analysis considers 187 non-Russian airports located in 173 cities in 42 countries (EU and EEA countries plus former Yugoslavia and several countries from The Commonwealth of Independent States). As destinations, we consider 71 Russian airports located in 68 cities. Moscow-Domodedovo (DME) and Moscow-Sheremetyevo (SVO) airports are hubs of Oneworld and SkyTeam, respectively. Novosibirsk-Tolmachevo airport is also a hub of S7, although this airport is not a destination point for flights from Europe.
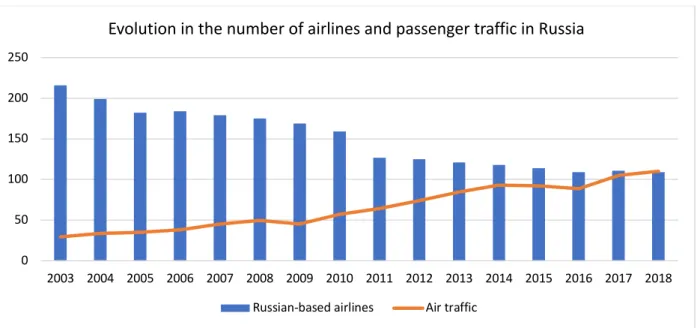
Figure 3 shows the main trends in the evolution in the number of airlines and passenger traffic in the period 2003-2018 in Russia. The Russian air market experienced an important expansion after the start of the new millennium, overcoming a period of traffic declines. The 1990s were the hardest years in the Russian history with the systemic crisis and the collapse of almost all industries, including the financial meltdown in 1998, with a substantial level of economic and political uncertainty. On average, the growth of air traffic was
10% for each year since early 2000s, and from 2010 to 2015 the air passenger traffic increased by 60%, because of the first steps done towards the implementation of more liberal aviation policy (in line with the aviation news source Avia.pro). The figure also shows an important reduction in the number of airlines in this period. Such consolidation process eliminated small airlines and implied the increase of air fares.
Figure 3. Number of airlines based in Russia (columns) and air traffic (light blue line, in millions of passengers) for 2003-2018.
Source: Author (based on the Russian research organization data, 2019)
Figure 5 shows that during this period there was also an important reduction the number of civil airports. According to Yachmennikova (2016), one of the main reasons was a lack of investments from government and private business due to not clear law regulations. She explains such dramatic decrease by the following: invisible hand of the market derailed more than a thousand small regional airports, leaving millions of people without aviation services, especially in Siberia, Far East and Far North. The belief that it is possible to shift all the state’s concerns about the airport network to the market itself was a crushing blow to the solid Soviet heritage. Figuratively speaking, market must decide whether one or another airport will work or not. As a result, most of Russian airports are located in the European continent (Figure 4), reducing the accessibility of remote Russian regions.
Figure 4. Locations of Russian civil airports. Source: Google Maps.
0 50 100 150 200 250 2003 2004 2005 2006 2007 2008 2009 2010 2011 2012 2013 2014 2015 2016 2017 2018
Evolution in the number of airlines and passenger traffic in Russia
Russia takes 7th place in terms of the seat capacity in Europe in 20188. In the latest years, a number of seats increases faster in Russian market, than in any other highly-ranked country and the upward trend continues (Sinitsky, 2019). IATA predicts that in the next two decades the air passenger volume in Russia will become larger by 77%, while this rate for the most of European territories is expected to be about 35%.
Figure 5. Number of Russian airports from 1991 to 2019, including international airports. Source: Author (based on data from Zherebtsov, 2013, and Demidova, 2019).
The densest routes connecting with Russian airports in terms of passenger traffic are Paris CDG – Moscow SVO (operated by Air France and Aeroflot), Prague Ruzyne – Moscow SVO (operated by CSA, Aeroflot and LCC Smartwings) and Amsterdam Schiphol – Moscow SVO (operated by KLM and Aeroflot). The most frequent flights are provided from all Minsk, Prague and Yerevan to Moscow.
Within the Oneworld alliance, there is a large supply on the following lines: London Heathrow – Moscow DME (British Airways and S7), Madrid Barajas – Moscow DME (Iberia and S7) and Berlin Tegel – Moscow DME.
Figure 6. Number of airlines presented at the Russian market in 2002-2019 time period. Source: Authors database
8 After United Kingdom, Germany, Spain, Italy, France, and Turkey.
0 500 1000 1500 2000 1991 1992 1993 1994 1995 1996 1997 1998 1999 2000 2001 2002 2003 2004 2005 2006 2007 2008 2009 2010 2011 2012 2013 2014 2015 2016 2017 2018 2019
Number of airports in Russia
Number of civil airports International airports
0 10 20 30 40 50 60 70 80 90 100 2000 2002 2004 2006 2008 2010 2012 2014 2016 2018 2020
Airlines and LCC in the Russian market
The number of airlines with a presence at the Russian aviation market increased importantly after 2004, probably due to the cancellation of quotas, which gave a serious incentive for new airlines to enter into the market. After this, the number of airlines has fluctuated between 70 and 90. Low-cost carriers have a moderate and stable presence in the market.
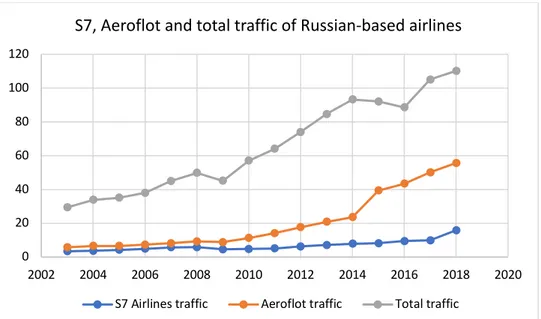
Figure 8 shows the evolution of the Aeroflot and S7 Airlines annual total passenger traffic over almost 20 years, as well as total traffic generated by all Russian-based airlines. Aeroflot remains a leader at the Russian market with the permanent rise in total passenger traffic. However, in recent years, S7 Airlines successfully use its hub in Novosibirsk (West Siberia), which allows to connect domestic and international markets; by having two hubs in different parts of the country, this firm is well-presented in both European and Asian markets, and this can explain the increase in passenger traffic. Another reason for such a growth might be the Oneworld agreements implementation.
Figure 7. S7 Airlines, Aeroflot and total traffic of all Russian-based airlines (in millions of passengers). Source: Authors database
Figure 8 demonstrates the number of new routes opened by S7 Airlines over 8 years period. The significant rise in 2017 might be explained by expanding regional network due to the arrival of Embraer E170 aircraft in the fleet and traffic augmentation from St.Petersburg Pulkovo airport.
0 20 40 60 80 100 120 2002 2004 2006 2008 2010 2012 2014 2016 2018 2020
S7, Aeroflot and total traffic of Russian-based airlines
Figure 8. Evolution of launching the new routes by S7 Airlines in 2010-2017. Source: Author (based on S7 Airlines annual reports).
Figure 9 shows the creation of new routes by Aeroflot from 2000 to 2018. 85% of these flight departures are from Moscow and mostly to domestic locations.
Figure 9. Evolution of the new routes introduction by Aeroflot in 2000-2018 period. Source: Author (based on Aeroflot annual reports).
There is a noticeable increase in the number of airports used by Aeroflot from 42 in 2006 to 77 in 2016 (Table 10 in Appendix), which could be explained by the integration with the SkyTeam alliance in 2006. The same tendency applies to S7 Airlines and its cooperation within Oneworld alliance, showing a rise from 29 in 2010 to 53 in 2018 (Table 11 in Appendix).
4.3 Empirical Strategy
The objective of our paper is to examine the impact of the integration of Aeroflot into the SkyTeam alliance in 2006 and of the S7 integration into the Oneworld alliance in 2010. In order to do this, we implement a difference-in-difference (DID) model that will consider the years of the integration of these airlines into
8 7 9 9 8 9 10 34 0 5 10 15 20 25 30 35 40 2010 2011 2012 2013 2014 2015 2016 2017
S7 annual new routes
5 9 10 8 5 4 6 6 4 6 6 9 16 9 5 13 5 5 19 0 2 4 6 8 10 12 14 16 18 20 2000 2001 2002 2003 2004 2005 2006 2007 2008 2009 2010 2011 2012 2013 2014 2015 2016 2017 2018
the alliances as an exogenous shock in the market. More specifically, we want to examine how these agreements influenced passenger traffic in the affected routes and flight frequencies.
The use of the difference-in-differences methodology allows us to measure the impact in traffic and in the flight frequencies on the routes affected by the alliances after the alliances took place (treatment group) taking as a benchmark the routes not affected in any period (control group). As a result, we can clearly separate the effect of the alliances from the general trends in the market.
Namely, Moscow – London route is treated in the framework of Oneworld, while Moscow-Paris route is in the group of affected routes within the SkyTeam alliance. For Aeroflot time period from January 2002 to March 2006 is a control period, and time period from April 2006 to December 2019 is a treatment period. For S7 Airlines, a control period starts at January 2002 and finishes at October 2010, while the treatment period takes place from November 2010 until the end of the sample data, i.e. December 2019.
Our first specification identifies the general alliance impact with the following equation:
Yitm = α + λ1Allianceitm + λ2Overlappingitm + λ3OverlappingXAllianceitm + β’Xitm + 𝛿′𝑖 + 𝜔′𝑡 + 𝜇′𝑚 + 𝜀itm (1),
where the outcome variable Yitm can be either the number of seats or the flight frequency offered by airlines
i in month m of the year t. The main explanatory variable of our diff-in-diff model is the Alliance variable,
which is a dummy variable that takes the value 1, when the route links two airports that are hubs of airlines involved in the same alliance, and 0 otherwise. For example, this variable will take the value of 1 in the route Paris (CDG) – Moscow (SVO) after 2006, which is the year when the Aeroflot membership took place. In contrast, the variable of alliance takes the value 0 in the route that link Frankfurt to Moscow (DME), because Frankfurt is a hub of Lufthansa, which belongs to Star Alliance (any Russian airline is affiliated to this alliance). The variable of alliance also takes the value 0, when at least one of the airports of the route is not a hub of an airline involved in an alliance. For instance, Alicante-Elche airport or Bratislava airport.9
The difference-in-differences impact of the alliance on the number of seats (flight frequency) is represented by 𝜆1, which is the estimate of interest. The essential identification postulation of the DID method is that the variable of interest would have pursued a parallel trend in the lack of intervention in both the control and treated groups. Consequently, the change in the number of seats (flight frequency) in the control group displays an appropriate measure of the change in the number of seats in the treated group in the absence of intervention.
The estimated model also considers a number of control variables. The vector of controls (Xitm) includes different variables that might influence the number of seats or flight frequency offered (for instance, income and population). Demand in air transportation is usually modelled as a gravity equation. Given the strong positive correlation between demand and supply, we follow this approach in our empirical equation. To this point, in gravity models demand depends positively of income and population in both endpoints of the route, and negatively of distance, although distance is captured in our context by the route-fixed effects. Introducing the population variable is important as a major driver of demand with a larger supply of seats in bigger cities and it measures population in both origin and destination regions at the urban level. GDP per capita at the country-level is presented to control for the economic status in place of origin and in Russia as a destination point, based on the idea of higher demand between more wealthy endpoints.
We also control for the intensity of competition in the route by introducing a variable for low-cost carriers to find out, how they can influence supply on the route. We use the list provided by ICAO that defines low-cost carriers as «an air carrier that has a relatively low-low-cost structure in comparison with other comparable carriers and offers low fares and rates» (ICAO Glossary). In order to examine the routes monopolization level and the general concentration of carriers at the route, we apply the Herfindahl-Hirschman index, which is based on the sum of squared shares of the seats across airlines in each particular airline route. HHI is an indicator of airline competition on the route. Finally, we include a dummy variable for overlapping that takes the value 1, when more than one airline within the same alliance is operating the route. To this point, we interact the dummy variable for alliances with the dummy variable for overlapping to check, whether the impact of alliance memberships differs when more than one airline partner in an alliance operates the route.
We use the mean number of seats across all routes in the sample to differentiate between dense routes (routes with more seats, than the mean) and thin routes (routes with less seats, than the mean sample). Such reference point makes it possible to investigate in which «traffic subgroup» the alliance impact is stronger. It clarifies whether this impact is negative or positive applying to the number of seats. To this point, a lack of competition is possible on thin routes (Fageda and Flores-Fillol, 2012).
Each regression includes route-specific fixed effects (𝛿′𝑖) to control for route-specific factors (such as distance) that do not vary over time, as well as yearly (𝜔′𝑡) and monthly (𝜇′𝑚) fixed effects to control for general trends over time. 𝜀itm is the error term.
All control variables are expressed in logs as is typical in gravity models. Logs reduce the difference between the number of seats, so if in one route there is a large number of seats and another is less, it reduces the disparity. Also, logs diminish the influence outliers and allows to interpret the coefficients as percentages.
In our second specification we have splited the general alliance variable into two separate variables, specifically for each of the SkyTeam and Oneworld alliances. This allows to capture the particular alliance effect on the airlines with different ownership forms and hence, identify which type of firm is beneficial from operating under alliance agreements. Also, at this step we integrate into our research a dummy variable for airport location (𝜏′𝑖) to control for the role of four Moscow airports. It takes value of 1 if destination airport is situated in Moscow, and equals 0 otherwise.
Yitm = α + 𝜓1Oneworlditm + 𝜓2SkyTeamitm + 𝜓3Overlappingitm + 𝜓4OverlappingXOneworlditm + 𝜓5OverlappingXSkyTeamitm + β’Xitm + 𝜏!𝑖 + 𝛿′𝑖 + 𝜔′𝑡 + 𝜇′𝑚 + 𝜀itm (2),
The control variables remain the same as in the first estimation equation. At this step, we run regressions for the entire sample and denser routes, given that such routes are the most affected by the alliances.
5. Results
This section presents the main results of our empirical examination. We first show the results of the general alliance effect on number of seats and frequency proposed. The analysis is divided into two parts, for thin and dense route. As stated before, a threshold of 4,800 seats as the mean sample is a border, which distinguishes these two types of routes.
Alliance coefficient is negative with seats parameter less than 4,800, however it is not statistically significant and we cannot clearly identify its effect. On the contrary, there is a positive impact on number of seats for dense routes after the introduction into alliance. Table 2 shows results for the general alliance impact on the number of seats offered in thin and dense routes.
Table 2. Results of the estimates – seats offered.
Dependent variable: log Seats
Thin routes Dense routes
Population of origin -0.183 (0.21) -0.965*** (0.23) Population of destination 1.117* (0.44) 1.599 (1.76) GDP of origin 0.066 (0.04) 0.275*** (0.06) GDP of destination 0.197** (0.07) 0.211 (0.22) HHI 0.295*** (0.03) 0.214*** (0.06) Overlapping 0.194*** (0.05) 0.014 (0.07) Low-cost -0.404** (0.07) -0.016 (0.02) Alliance -0.157 (0.11) 0.142*** (0.04) Interaction 0.130 (0.18) -0.042 (0.09) R2 0.19 0.35
Test joint sign 38.76*** 33.01***
Number of observations 38,709 15,499
Notes for Tables 2-5: Standard errors in parentheses (robust to heteroscedasticity, and also clustered at the route level). Statistical significance at 1% (***), 5% (**), 10% (*).
Hence, in terms of the change in number of seats, it was found a positive impact of alliances, although it is mainly concentrated in denser routes. The number of seats on the treated routes after the alliance taking place is predicted to be higher by 14.2%, than that of the control routes. Here there is no evidence found for our hypothesis, that after the alliance there was a reduction in the number of seats offered in the existing routes. Thus, we do not find support for potential anticompetitive effects of alliances. However, the positive impact of alliances is reduced in routes, where partner airlines have overlapping services.
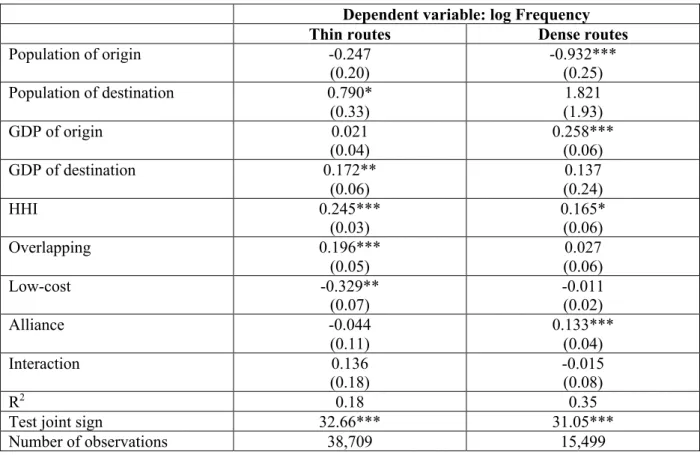
Table 3 shows similar results of the general alliance impact, which have been observed in regards of flight frequency. The offer of flights connections is expanded with the alliance agreements by 13.3% in dense lines. Alternatively, there is a 4.4% decrease when we consider thin routes, and it is not statistically significant. Route-level regressions show that alliance works for dense routes and affects large routes with a lot of traffic.
Table 3. Results of the estimates – frequency offered.
Dependent variable: log Frequency
Thin routes Dense routes
Population of origin -0.247 (0.20) -0.932*** (0.25) Population of destination 0.790* (0.33) 1.821 (1.93) GDP of origin 0.021 (0.04) 0.258*** (0.06) GDP of destination 0.172** (0.06) 0.137 (0.24) HHI 0.245*** (0.03) 0.165* (0.06) Overlapping 0.196*** (0.05) 0.027 (0.06) Low-cost -0.329** (0.07) -0.011 (0.02) Alliance -0.044 (0.11) 0.133*** (0.04) Interaction 0.136 (0.18) -0.015 (0.08) R2 0.18 0.35
Test joint sign 32.66*** 31.05***
Number of observations 38,709 15,499
Regarding the control variables in the estimation of our first specification, we observe that both population and GDP variables of the origin point are statistically significant at 1% level for dense routes, having different magnitude of the impact: origin population variable has a negative effect, while origin income positively affects the seats supply and number of departures. Such positive impact could be related with lower prices, and vice versa. Regarding the population and GDP variables in thin routes, the situation is the opposite: regressions demonstrate that they are important only in destination endpoints.
Low-cost variable has a negative sign, being statistically significant on thin routes. It leads to the suggestion, that the market of thin routes is already well-served by LCC. Thus, the alliance does not have a clear impact there. It is also interesting to mention the impact of market concentration in the airline market. HHI is statistically significant with a positive sign in all models. It is highly statistically significant at 1% level with seats as a dependent variable, and at 5% level evaluating impact of the alliance on the flight frequency. Thus, we do not find the evidence that a weaker competition leads to less supply.
Next, we implement the estimation of our second specification, where we separate a general alliance variable into two specific variables for SkyTeam and Oneworld. By doing this, we can evaluate the effect of the ownership on seats and flights supply and test our hypotheses. In the following regressions we include airport location dummy variable as the explanatory variable to check, whether airports in Moscow play a key role in distributing air connection traffic. Table 4 shows the results of evaluating the general and specific impacts with the entire sample and log seats as a dependent variable without distinguishing by traffic density.
Table 4. Results of the estimates – seats offered at the entire sample.
Entire sample Dependent variable: log Seats
General alliance impact Specific alliance impact
Population of origin -0.166 (0.17) -0.170 (0.17) Population of destination 1.322*** (0.35) 1.313*** (0.35) GDP of origin 0.132 (0.07) 0.134 (0.07) GDP of destination 0.466*** (0.07) 0.399*** (0.07) HHI -1.245*** (0.05) -1.247*** (0.05) Overlapping 0.066 (0.05) 0.030 (0.10) Alliance 0.025 (0.12) - Interaction -0.007 (0.13) - SkyTeam - 0.022 (0.03) Oneworld - 0.077** (0.02) Interaction SkyTeam - 0.016 (0.09) Interaction Oneworld - 0.039 (0.05) Airport location 0.021** (0.04) 0.034** (0.04) R2 0.31 0.31
Test joint sign 51.91*** 50.13***
Number of observations 54,208 54,208
With the introduction of separable variables for each of the alliances, we have found a positive impact of alliance, but it is concentrated only in Oneworld alliance. There is an increase by 7.7% in number of seats provided by S7 Airlines with the implementation of the alliance network agreements. Table 5 shows regression results with the entire sample and log frequency as the dependent variable.
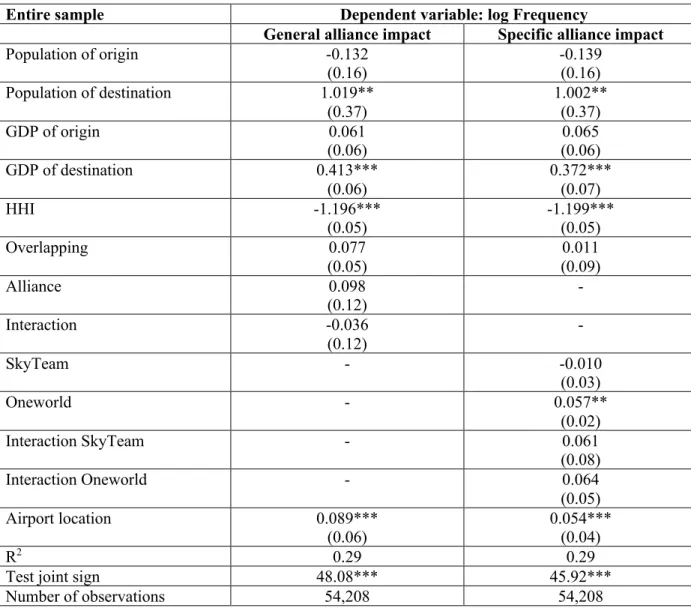
Table 5. Results of the estimates – frequency offered at the entire sample.
Entire sample Dependent variable: log Frequency
General alliance impact Specific alliance impact
Population of origin -0.132 (0.16) -0.139 (0.16) Population of destination 1.019** (0.37) 1.002** (0.37) GDP of origin 0.061 (0.06) 0.065 (0.06) GDP of destination 0.413*** (0.06) 0.372*** (0.07) HHI -1.196*** (0.05) -1.199*** (0.05) Overlapping 0.077 (0.05) 0.011 (0.09) Alliance 0.098 (0.12) - Interaction -0.036 (0.12) - SkyTeam - -0.010 (0.03) Oneworld - 0.057** (0.02) Interaction SkyTeam - 0.061 (0.08) Interaction Oneworld - 0.064 (0.05) Airport location 0.089*** (0.06) 0.054*** (0.04) R2 0.29 0.29
Test joint sign 48.08*** 45.92***
Number of observations 54,208 54,208
Based on two previous tables, we can follow the significance of Moscow airports as an interchange station between the origin and destination points of the whole route (for example, Paris-Moscow-Kazan), or as a dominance among final endpoints of the route. Hence, capital airports seem to be a concentration place to generate passenger traffic and affect the offer of number of seats or flight frequency.
In addition, we again notice a statistical significance of the Oneworld variable with a positive sign. Thus, we make a conclusion that the Oneworld alliance has increased the number of connections from Russian airports to the hubs of the alliance airlines, and accordingly, S7 performs better being treated as an alliance member. Hence, our «ownership hypothesis» has been tested, and taking into account the results regarding change in the number of seats from Table 4, we see that alliance works better for the private firm, but not for the public one.
The question arises, why the effect is stronger for Oneworld and not for Skyteam? It might be explained by the fact, that Aeroflot has a market power position and is not so much affected by the membership in SkyTeam. Before joining to alliance, Aeroflot was already provided a lot of seats on the routes, since as a national flag carrier it has a capacity to supply a big number of seats and departures by default. In contrast, alliance has helped S7 Airlines to have more seats and passengers on their routes.
6. Concluding remarks
We have empirically investigated the impact of two important alliances that affected the Russian market in the last decade period. Our empirical analysis has examined the theoretical predictions of the literature on alliances regarding the effects of traffic, frequencies and route expansion.
Regarding the change in number of seats, we obtain a positive impact of alliances, although the effect is mainly concentrated in denser routes. Moreover, the positive impact of alliances is reduced in routes where partner airlines have overlapping services. Our results indicate that alliances tend to increase the concentration on certain routes, but this does not lead to less supply. In terms of the frequency, results show that generally the alliance agreements have led to the offer augmentation of flights by 13.3% in dense lines. It is also worthwhile to mention that according to current analysis, foreign low-cost carriers might consider building their network of thin routes in Russia independently of connecting with Moscow airports, thus increasing the competition in regional market sector.
We have found that the alliance impact on competition is different regarding the ownership type of airlines. A private-owned S7 Airlines performs better being treated as an alliance member, than a state-owned Aeroflot. This stronger effect might be explained by disparate conditions before their affiliations to the alliances. Aeroflot has already provided a large number of seats on the routes, since as a national flag carrier it was responsible to connect a broad chain of locations in Russia. On the contrary, S7 Airlines was seeking an opportunity to grow and an alliance basic idea of the increased traffic showed itself exactly there. A potential limitation of this analysis is that our data lies in the geographical restriction of routes network coverage, since we mostly concentrate on European-Russian connection. Possible extension of our project would be more detailed research about the significance of the current Siberian hub of S7 Airlines in Novosibirsk and a new hub of Aeroflot in Krasnoyarsk scheduled for opening in the summer of 2020, their communication with Asia and America (including alliance partners, such as American Airlines, Cathay Pacific, Japan Airlines, Malaysia Airlines, SriLankan Airlines in Oneworld and China Airlines, Delta Airlines, Korean Air, Vietnam Airlines in SkyTeam), and the alliance impact on number of seats and departures relating to these markets.
Regarding the competition policy implications, one of the main effects on partners airlines is the increased passenger traffic, generated by the expansion of the airlines network routes. This is favorable for both the «selling» and the «operating» air carriers. The former provides tickets of the operating airline under its own marketing code and this way it reaches new markets without a must to fly there. The latter is assumed to have a bigger number of passengers on board, since tickets are distributed within several sources. Alliance airline presence can also contribute to the additional traffic of transfer passengers in airports due to the high level of connection possibilities between partners. Besides, since alliance members usually dominate in their hubs, partner airlines are supposed to receive a larger quantity of slots, that may lead to the reduced competition (especially, in relation to non-alliance carriers). This is an example of a clear anticompetitive case, which should be a concern of local authorities in order to decrease the market power of the alliance. Furthermore, with the increasing number of alliances globally, the aviation market concentration becomes higher. In such a situation, there exists a risk of collusion between the remaining carriers and that should be also supervised by responsible aviation market authorities at the international level.
References
1. Aeroflot, 2020. Annual Reports. [online] Available at: <https://ir.aeroflot.ru/ru/reporting/annual-reports/> [Accessed 25 May 2020].
2. Avianity, 2020. All Russian Airlines. [online] Available at: <https://avianity.ru/aviakompanii/rossii/> [Accessed 31 May 2020].
3. Bamberger, G., Carlton, D. and Neumann, L., 2004. An Empirical Investigation of the Competitive Effects of Domestic Airline Alliances. The Journal of Law and Economics, 47(1), pp.195-222. 4. Barros, C. and Peypoch, N., 2009. An evaluation of European airlines’ operational
performance. International Journal of Production Economics, 122(2), pp.525-533.
5. Bilotkach, V. and Hüschelrath, K., 2013. Airline Alliances, Antitrust Immunity, and Market Foreclosure. Review of Economics and Statistics, 95(4), pp.1368-1385.
6. Bilotkach, V., 2004. Price Competition between International Airline Alliances. SSRN Electronic
Journal.
7. Bilotkach, V., 2006. Airline Partnerships and Schedule Coordination. SSRN Electronic Journal. 8. Bissessur, A. and Alamdari, F., 1998. Factors affecting the operational success of strategic airline
alliances. Journal of Air Transportation, pp.331-355.
9. Brueckner, J. and Singer, E., 2019. Pricing by international airline alliances: A retrospective study. Economics of Transportation, 20, p.100139.
10. Brueckner, J. and Spiller, P., 1994. Economies of Traffic Density in the Deregulated Airline Industry. The Journal of Law and Economics, 37(2), pp.379-415.
11. Brueckner, J. and Whalen, W., 2000. The Price Effects of International Airline Alliances. The
Journal of Law and Economics, 43(2), pp.503-546.
12. Brueckner, J., 2001. The economics of international codesharing: an analysis of airline alliances. International Journal of Industrial Organization, 19(10), pp.1475-1498.
13. CAPA - Centre for Aviation. 2019. Russia's Pobeda May Face Low Cost Airline Competition. [online] Available at: <https://centreforaviation.com/analysis/reports/russias-pobeda-may-face-low-cost-airline-competition-490455> [Accessed 25 May 2020].
14. Capstats.com. 2019. Data Content | Airline Capacity and Flight Frequency Statistics | Historic Data | Airline, Airport, Country and Continent. [online] Available at: <http://www.capstats.com/datacontent.aspx> [Accessed 31 May 2020].
15. Cho, M., Fan, M. and Zhou, Y., 2007. An Empirical Study of Revenue Management Practices in the Airline Industry. University of Washington, [online] Available at: <http://faculty.washington.edu/yongpin/RM_Nov_15_07.pdf> [Accessed 25 May 2020].
16. Chsherbakov, V. and Gerasimov, O., 2019. Air transport in Russia and its impact on the economy. Tomsk State University. Ekonomika, (48), pp.283-304.
17. de Man, A., Roijakkers, N. and de Graauw, H., 2010. Managing dynamics through robust alliance governance structures: The case of KLM and Northwest Airlines. European Management Journal, 28(3), pp.171-181.