Università Politecnica delle Marche
Scuola di Dottorato di Ricerca in Scienze dell’Ingegneria Corso di Dottorato in Ingegneria Industriale
Indoor Air Quality:
Study, Optimization and Implementation of a
Novel Hybrid Air Cleaning Process
XVII edition - new series
Ph.D. Dissertation of:
Mattia Pierpaoli
Supervisor:
Prof. Maria Letizia Ruello
Assistant Supervisor:
Prof. Gabriele Fava
Ph.D. Course coordinator:
Università Politecnica delle Marche
Dipartimento di Scienze e Ingegneria della Materia, dell'Ambiente ed Urbanistica Via Brecce Bianche — 60131 - Ancona, Italy
iii
Introduction
Clean air is an essential requirement of life, together with food and water. Although the latter two have been a primary concern for many civilizations for multiple centuries, especially in more industrialized countries, shaping new lifestyles and driving new economies, air is something imposed, with no possibility of choice. Since the industrial revolution, as people started to spend most of their time in confined environments, clean air should have been considered a prerogative, as indoor air had become a leading exposure for humans. Therefore, in places of life and work, it is necessary to monitor the urban environment. For this reason, as major environmental concerns, policy directives and guidelines have recently highlighted energy use, sustainable buildings, outdoor air quality, and indoor air quality (IAQ).
It is generally recognized that Europeans spend 90% or more of their time indoors. Despite this, the quality of air is considered a secondary problem, often ignored; while it is possible to choose what to eat and what to drink, it is difficult to choose which air to breathe. However, indoor air pollution may cause serious health problems such as respiratory diseases, allergies, and lung cancer.
The most common indoor pollutants can be classified by their form: particulate or gaseous. Conventional strategies to combat the formers are source removal, dilution through ventilation and air treatment. While indoor emissions are ubiquitous and it is not always possible to remove the source, dilution through mechanical and natural ventilation and air cleaners are the generally preferred. As sustainability and energy-efficiency are becoming prerogatives in many countries, ventilation may imply energy losses, and therefore it can not be the only applicable strategy. For these reasons, air cleaners constitute a solution for removing harmful indoor pollutants.
Common indoor air treatment technologies are classified according to the type of pollutant removed: filters, electrostatic precipitators, inertial collectors, scrubbers are generally used for the removal of particles, while adsorptive media, (photo)catalysts, and plasma-operated reactors are adopted for the removal of gases. In this thesis, a combination in situ of the three previously reported methods (adsorption, photocatalysis and electrostatic precipitation) was deeply studied for the enhanced removal of indoor pollutants. The synergistic effect between each coupled process was investigated, in order to highlight the novelty of operating photocatalysis, adsorption and electrostatic precipitation in the single hybrid reactor.
Structure of the Thesis
The present thesis is divided into 3 chapters:Chapter 1: Motivation; the Indoor Air Quality topic has been introduced both with a more general bibliometric analysis, both with a particular focus on the treatment technologies adopted to control the former.
Chapter 2: Experimental; the different combinations of the three technologies considered were deeply studied, and the main parameters affecting the process were optimized. At the end of each subchapter, a comprehensive discussion of the results was reported.
Chapter 3: Conclusion; the main findings, in relation to each paired process or to the combined process, were reported, and its implementation was discussed. A critical review of the process, including strength and limitations of the process has been redacted, as well as a brief discussion about economic costs.
v
Acknowledgments
First and foremost I wish to thank my tutor, professor Maria Letizia Ruello, giving me free reins for my research and for having offered me many opportunities in these years. Maybe I took too seriously her motto “fai il pane con la farina che hai” which brought me many times to go crazy, building by myself the instrumentation that I needed. However, I have to say that it helped me a lot to understand how stuff works. This is also thanks to professor Gabriele Fava, who has been a mentor for me since my bachelor. He always supported my curiosity, and often, when I came out with a new finding (or, more often, with a new unsuccess), he was ready to listen and to discuss it (or saying “I told you!”). Fueling my desire to know and my wunderlust, I convinced myself that in order to fully understand the process that I was
investigating, I had to move from a macroscopic to a microscopic approach and to use different tools. This brought me to collaborate with professor Robert
Bogdanowicz, from the Gdansk University of Technology, that I thank so much for the all the work about carbon nanowalls and for making me feel at home in his
Nanodiamond Team.
Surely this work would not have been possible without the help of Orlando Favoni, Mirco Marcellini, Roberto Mancini, Aneta Lewkowicz, Tiziano Bellezze and Carla Conti, for having been of amazing help all this time. Since substance cannot exist without form, I have to thanks a special teacher, Ewa, for her time and for being patient with me.
Although not strictly related to this work, I'd like to give special thanks to professor Aneta Łuzkiewicz and dr. Sylwia Fudala-Książek for working together and for the trust given. As well, a good part of the knowledge about adsorbent materials is thanks to professor Antonina Bondarenko, who taught me a lot at the Lipetsk State Technical University.
Not less important, I would like to thank all my PhD colleagues, with whom I have shared moments of stress and joy, for bearing with me and for not having pummeled me about my enormous ego.
I especially thank my parents and my family, for the unconditional love and care provided my whole life.
The greatest achievement from these past four years, was not only my academic journey, but as well the special person with whom I succeed in it. I’m not only thankful for the thousands cakes prepared for me, but for having taught me to be patient and for giving me the strength to achieve what I love.
At last, I would like to thank those who did not understand me, who criticized me and the reviewers who rejected my works, because it is only thanks to the obstacles encountered and to my failures that I learned it after knowing it all.
List of publications
M. Pierpaoli, M.L. Ruello, Indoor Air Quality: A Bibliometric Study Sustainability
2018, 10(11), 3830;
doi:10.3390/su10113830
M. Pierpaoli, Lewkowicz, A., Ficek, M., Ruello, M. L., & Bogdanowicz, R. (2018).
Preparation and characterization of TiO2/carbon nanowall composite on a transparent
substrate. Photonics Letters of Poland, 10(2), 54-56. doi:10.4302/plp.v10i2.825
M. Pierpaoli, M., Favoni, O., Fava, G., & Ruello, M. (2018). A Novel Method for the Combined Photocatalytic Activity Determination and Bandgap Estimation. Methods
and Protocols, 1(2), 22.
doi:10.3390/mps1020022
M. Pierpaoli, M. L. Ruello, G. Fava - Enhanced Adsorption of Organic Compounds over an Activated Carbon Cloth by an External-Applied Electric Field. Environments
4.2 (2017): 3.
doi:10.3390/environments4020033
M. Pierpaoli, C. Giosuè, M. L. Ruello, G. Fava - Appraisal of a hybrid air cleaning process. Environmental Science and Pollution Research, Vol. 24 No14, pp. 12638-12645. doi:10.1007/s11356-016-7880-x
G. Fava, M. Pierpaoli. - A Hybrid Photocatalytic-Electrostatic Reactor for Nitrogen Oxides Removal. American Journal of Environmental Engineering and Science. ISSN:
2381-4691 Vol. 2, No. 1, 2015, pp. 7-13.
G. Fava, M. Pierpaoli. - Volatile Organic Compounds Removal in a Hybrid
Photocatalytic-Electrostatic Reactor. American Journal of Environmental Engineering and
Science. ISSN: 2381-4691 Vol. 2, No. 2, 2015, pp. 14-17.
M. Pierpaoli, M. Ficek, M. Rycewicz, M. Sawczak, J. Karczewski, M. L. Ruello and R. Bogdanowicz, Tailoring electro/optical properties of transparent boron-doped carbon nanowall grown on quartz Submitted to Materials
vii
Other publications
G. Fava, T. Naik, and M. Pierpaoli. "Compressive Strength and Leaching Behavior of Mortars with Biomass Ash." Recycling 3.3 (2018): 46.
doi:10.3390/recycling3030046
Fudala-Ksiazek, S., Pierpaoli, M., & Luczkiewicz, A. (2018). Efficiency of landfill leachate treatment in a MBR/UF system combined with NF, with a special focus on phthalates and bisphenol A removal. Waste Management, 78, 94-103.
doi:10.1016/j.wasman.2018.05.012
C. Giosuè, M. Pierpaoli, A. Mobili, M. L. Ruello, F. Tittarelli - Influence of Binders and Lightweight Aggregates on the Properties of Cementitious Mortars: From Traditional Requirements to Indoor Air Quality Improvement Materials 2017, 10(8), 978;
doi:10.3390/ma10080978
S. Fudala-Ksiazek, M. Pierpaoli, A. Luczkiewicz. - Fate and significance of phthalates and bisphenol A in liquid by-products generated during municipal solid waste
mechanical-biological pre-treatment and disposal. - Waste Management Vol. 64 (2017):
pp.28-38.
doi: 10.1016/j.wasman.2017.03.040
M. Pierpaoli, G. Fava - A Passive Opportunity for Improving Air Quality in the Schools Environment: A Real-World Scale Testing. American Journal of Environmental Sciences
ISSN: 1553-345X, Vol.12, No. 3, pp. 206-212
doi:10.3844/ajessp.2016.206.212
S. Fudala-Ksiazek, M. Pierpaoli, E. Kulbat, A. Luczkiewicz - A modern solid waste management strategy – the generation of new by-products. Waste Management. ISSN:
0956-053X Vol. 49, March 2016, pp. 516–529.
Act of conferences
M. Pierpaoli, M. Ficek, M.Rycewicz, M. Sawczak, J. Karczewski, M. L. Ruello and R. Bogdanowicz - Transparent carbon nanostructures for conductive electrodes,
Nanosmat: International Conference on Surfaces, Coatings and Nanostructured Materials, 11-14 Semptemebr 2018, Gdansk, Poland
M. Pierpaoli, M. L. Ruello, G. Fava - Electrosorption of gaseous volatile organic compounds onto technical ad-sorbents, Indoor Air, 22-27 July 2018, Philadelphia, USA
M. Pierpaoli, L. Riderelli, S. Palmieri, G. Fava, M. L. Ruello -Transparent electrospun PLA-nanofibers on 3D-printed honeycomb for a high-efficient air filtration; Indoor Air,
22-27 July 2018, Philadelphia, USA
M. Pierpaoli, M. L. Ruello, R. Bogdanowicz - Growth of boron-doped carbon nanowalls on quartz glass – FEMS Junior Euromat, 8-12 July 2018, Budapest, Hungary
M. Pierpaoli, A. Lewkowicz, M. L. Ruello, R. Bogdanowicz - Preparation and
characterization of TiO2/carbon nanowall composite on transparent substrate, OPTO
2018, 4-7 July 2018, Gdansk, Poland
M. Pierpaoli, D. Forconi, S. Monosi, M. L. Ruello - Can VOC adsorption be enhanced by an external electric field? XIV AIMAT National Congress, 13-15 July 2017, Ischia Porto
M. Pierpaoli, M. L. Ruello, G. Fava - SiO2/TiO2 composites for real scale application:
adsorptive and de-polluting properties. Healthy Buildings Europe 2017, 2-6 July 2017,
Lublin (Poland)
M. Pierpaoli, Z. Xu, V. Bondarenko, R. Wang, G. Fava. M. L. Ruello - Silica-Titania Composites for the Air De-Pollution. 5th Sino-French Joint Workshop on Atmospheric
Environment, 11-14 October 2016, Xi’An (China).
M. Pierpaoli, C. Giosuè, M.L.Ruello, G.Fava - Appraisal of a Multitasking Air Cleaner Process Based on Multiple Combined Techniques. 9th European Meeting on Solar
Chemistry and Photocatalysis: Environmental Applications, 13-17 June 2016, Strasbourg (France)
Summary
Introduction ________________________________________________________ III Structure of the Thesis _________________________________________________ IV List of publications ____________________________________________________ VI Summary ___________________________________________________________ X
CHAPTER 1:MOTIVATION _____________________________________________ 1 1.1 Indoor Air Quality: a bibliometric study ________________________________________ 2
1.1.1 Introduction... 2
1.1.2 Materials and Methods... 2
1.1.2.1 Data collection ... 2
1.1.2.2. Data analysis ... 3
1.1.3 Results ... 3
1.1.3.1. Data description ... 3
1.1.3.2 Categories and Journal co-occurring networks ... 5
1.1.3.3. Term burst ... 7
1.1.3.4. Document co-citation network ... 9
1.1.3.5. Actual and future trends ... 14
1.1.4 Discussion ... 16
1.2 Indoor Air Treatment: a comparison between scientific and patent literature _________ 18 1.2.1 Introduction... 18
1.2.1.1 Indoor pollutants ... 18
1.2.1.2 Indoor treatment technologies ... 20
1.2.2 Materials and methods ... 26
1.2.3 Results ... 27
1.2.3.1 Patent analysis ... 27
1.2.3.2 Scientific literature analysis ... 31
1.2.4 Discussion ... 33
CHAPTER 2:EXPERIMENTAL __________________________________________ 34 2.1 Introduction _______________________________________________________________ 35 2.1.1 Synergies and the “hybrid” process ... 36
2.1.2 Current work ... 36
2.2 Adsorption and Electrostatic _________________________________________________ 38 2.2.1 Introduction... 38 2.2.1.1 Electrosorption ... 38 2.2.1.2 Electroadsorptive effect ... 39 2.2.1.3 By-products generation ... 40 2.2.1.4 Electrohydrodynamic effect ... 42 2.2.1.5 Adsorbent modification ... 44
2.2.2 Materials and methods ... 44
2.2.2.1 Adsorbents ... 44 2.2.2.2 Apparatus ... 46 2.2.2.3 Data elaboration ... 48 2.2.3 Results ... 49 2.2.3.1 By-products generation ... 49 2.2.3.2 Adsorbent modification ... 50
xi
2.2.3.3 Enhanced transport of charged/neutral species ... 54
2.2.4 Discussion ... 60
2.2.4.1 O3 and NO2 generation ... 60
2.2.4.2 Surface functionalization ... 60
2.2.4.3 Enhanced mass transport by ionic wind ... 60
2.3 Photocatalysis and Adsorption ________________________________________________ 62 2.3.1 Introduction ... 62
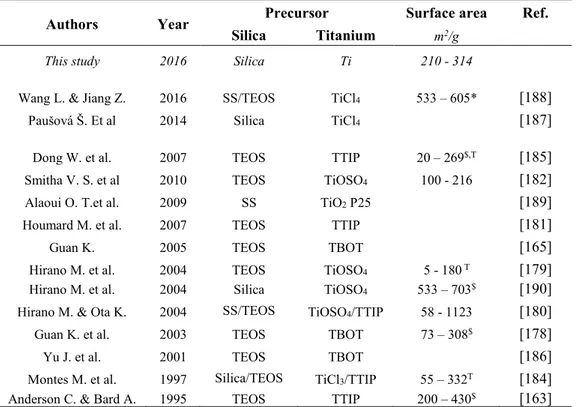
2.3.1.1 A low-cost Silica/Titania composite ... 62
2.3.1.2 The effect of Carbon type on Titania/Carbon composites ... 63
2.3.1.3 Tailoring a nanocomposite: Carbon nanowall/Titania composite ... 64
2.3.1.4 A simple activated carbon cloth/titania composite ... 65
2.3.2 Materials and Methods ... 65
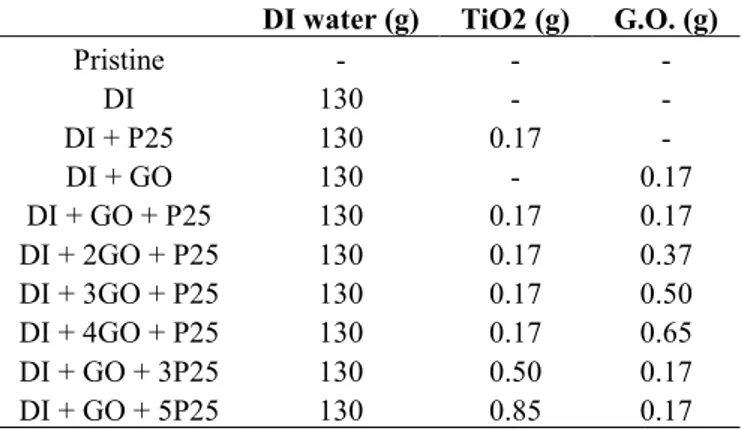
2.3.2.1 Silica/Titania composites ... 65
2.3.2.2 Carbonaceous nanomaterials/Titania composites ... 68
2.3.2.3 Carbon nanowall/Titania composite ... 69
2.3.2.4 Activated Carbon Cloth/Titania composites ... 71
2.3.3 Results ... 73
2.3.3.1 Silica/Titania composites ... 73
2.3.3.2 Carbonaceous nanomaterials/Titania composites ... 77
2.3.3.3 Carbon nanowall/Titania composite ... 79
2.3.3.4 Activated Carbon Cloth/Titania composites ... 84
2.3.4 Discussion ... 88
2.3.4.1 Silica/Titania composite ... 88
2.3.4.2 Carbonaceous nanomaterial/Titania composite ... 89
2.3.4.3 Carbon nanowall/Titania composite ... 89
2.3.4.4 Activated Carbon Cloth/Titania composite ... 90
2.4 Photocatalysis and Electrostatic _______________________________________________ 91 2.4.1 Introduction ... 91
2.4.2 Materials and methods ... 92
2.4.2.1 Sample Characterization ... 92
2.4.2.2 Experimental Procedure ... 92
2.4.2.3 Multi-LED reactor ... 95
2.4.3 Results ... 99
2.4.3.1 Enhanced removal of VOC ... 99
2.4.3.2 Enhanced removal of NOx ... 101
2.4.2.3 Multi-LED reactor ... 106
2.4.4 Discussion ... 109
2.5 Combined process _________________________________________________________ 112 2.5.1 Introduction ... 112
2.5.1.1 Appraisal of the hybrid combined process ... 112
2.5.1.2 Activated carbon cloth/TiO2 composite ... 113
2.5.2 Materials and methods ... 113
2.5.2.1 Appraisal of the hybrid combined process ... 113
2.5.2.2 Activated carbon cloth/TiO2 composite ... 114
2.5.3.1 Appraisal of the hybrid combined process ... 115
2.5.3.2 Activated carbon cloth/TiO2 composite ... 118
2.5.3 Discussion ... 125
2.5.3.1 Appraisal of the hybrid process ... 125
2.5.3.2 Effect on the ACC ... 125
CHAPTER 3:CONCLUSIONS __________________________________________ 126 3.1 A novel hybrid air cleaning process ___________________________________________ 127 3.1.1 Why a “hybrid” process? ... 127
3.1.2 The novelty of the process ... 128
3.1.2.1 Gas removal by electrostatic precipitation ... 128
3.1.2.2 Adsorption enhancement by an external-applied electric field ... 128
3.1.2.3 Earlier activation of a photocatalyst due to the corona effect... 128
3.1.2.4 Enhancement and inhibition of the heterogeneous photocatalysis by the hybrid process ... 128
3.2 Materials and processes ____________________________________________________ 130 3.3 Final considerations for the implementation ___________________________________ 132 3.3.1 Strengths ... 132 3.3.2 Weaknesses ... 132 3.3.3 Economic considerations ... 132 3.4 Future developments _______________________________________________________ 134 REFERENCES _______________________________________________________ 136 Annex A: ___________________________________________________________________ 157 Patent analysis of the Lens.org dataset ... 157
Data collection ... 157
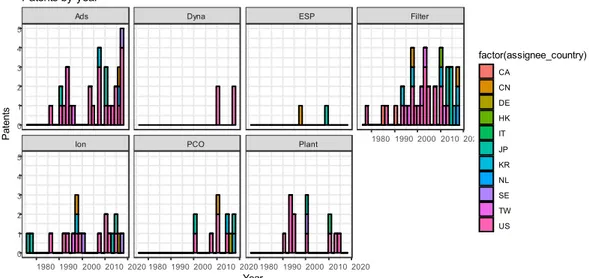
Temporal and geographical patent distribution ... 157
Top assignee ... 157
Process used ... 157
Target pollutant ... 158
Type of treatment ... 159
Annex B: ___________________________________________________________________ 161 Patents classifier algorithm ... 161
Annex C: ___________________________________________________________________ 163 Numerical simulation of an electro-enhanced adsorption process ... 163
Apparatus ... 163
DC positive corona discharge model... 163
Beuf’s approach ... 163
xiii
1.1.1 Introduction 1
Chapter 1:
Motivation
1.1 Indoor Air Quality: a bibliometric study
In paragraph 1.1, the Indoor Air Quality (IAQ) topic, in the last 38 years, is presented through a scientometric approach;
• More than 7000 publications have been clustered into few
significant research field. Among these, indoor air treatment technologies and processes account for the 3% in the IAQ-related scientific literature;
• Scientometric tools can be useful to analyze, categorize, and
identify milestone and turning points if the scientific literature. However, these tools cannot be considered exhaustive and scientific advances will probably be driven by new multidisciplinary contaminations into the discipline.
1.1 Indoor Air Quality: a bibliometric study
1.1.1 Introduction
Bibliometrics is the application of quantitative analysis and statistics to publications using different parameters, such as author citation, document co-citation, co-word analysis, and journal mapping, in order to understand emerging trends and the knowledge structure of a research field. Jointly with science mapping tools, it is possible to start from a large dataset of scientific publications in order to generate straightforward visual representations of complex structures for statistical analysis and interactive data exploration.
Using bibliometric tools to analyze the scientific literature collected by Web of Science, this article provides, firstly, an overview of the IAQ topic from 1990 to 2018, by reporting the most important publications and by collocating the existing literature in a finite number of clusters and, secondly, the latest developments and future trends. Although this work is not structured as an exhaustive review of the related literature, it does illustrate the opportunity of bibliometric techniques for exploring research gaps and new frontiers.
1.1.2 Materials and Methods
1.1.2.1 Data collection
All data were obtained from the Web of Science Core Collection (WoSCC) by Thomson Reuters prior to 1 May 2018. In this study, the keywords used for the data retrieval strategy were as follows: TS: (“Indoor air quality” OR “IAQ”). English-only document types were articles, letters, and reviews, ranging from 1990 to 2018, from the following indexes: SCI-EXPANDED, SSCI, A&HCI, CPCI-S, CPCI-SSH, and ESCI. The final dataset contained 7389 bibliographic records of Article or Letters or Review in English.
1.1.3 Results 3 1.1.2.2. Data analysis
We utilized several scientific and visual analytic methods. The statistical results are displayed in CiteSpace V [1], visualization software used for analyzing data by network modeling.
For the first analysis, the overall time span adopted was 1990 through 2018, with a 1-year time slice. The Term Source included Title, Abstract, Author Keywords, and Keyword Plus; Node Type was selected according to the type of analysis conducted; and Selection Criteria included the top 50. No pruning was selected. For the second part, in order to focus on the actual and future trends, a restricted dataset, in which only papers selected with the same criteria from 2010 to 2018, was used. A different thresholding method was adopted: Instead of selecting the top 50 articles of each time slice, CiteSpace thresholding parameters (citation, co-citation, and the cosine coefficient thresholds, shortened as: c, cc, and ccv) were set at 8;8;40, 6;6;30, and 2,2,10, respectively. This choice was justified by the three thresholding being respectively referred to: Begin, middle, and end of the selected period of time and, by applying more selective parameters for the first years, only the most relevant publications are reported. In the last period, a wider number of publications are reported.
1.1.3 Results
1.1.3.1. Data description
The distribution of yearly outputs is shown in Figure 1. The publishing trend increased from 13 publications in 1990 to 786 publications in 2017, highlighting the increased global focus on the topic. In particular, since 1990, it is possible to distinguish between two different phases. During the first phase from 1990 to 2009, a slow increase in publications occurred. The second phase occurred from 2010 to 2017, with a higher growth rate, indicating the growing interest in the topic. This distinct separation coincides with the publication of the World Health Organization (WHO) guidelines for indoor air quality [2].
Figure 1 - Temporal distribution of the bibliographic set.
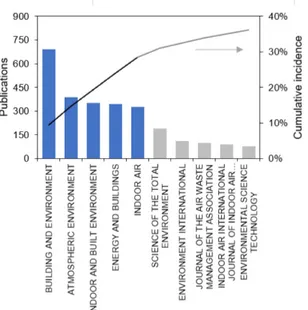
Almost 30% of the publications in the dataset were published by five scholarly journals (2102, 28.45%), each one accounting for about 350 publications. This trend is reported in Figure 2. 0 150 300 450 600 750 900 1990 1995 2000 2005 2010 2015 Publ ic at ions Year
Figure 2 - Top 10 journals with the highest number of publications. The line represents the
cumulative incidence of the entire dataset.
The top 15 contributing institutes are listed in Table 1. The University of California (3.71%) ranked first, followed by two Chinese universities: Tsinghua University (2.64%) and Hong Kong Polytechnic University (2.56%). Among the top 25 institutions, 11 are American, followed by 7 European, and 3 Chinese. However, more than one-quarter of the total records are American, followed by People’s Republic of China (PRC) (14.12%).
Table 1 - Top 15 contributing institutions.
Organizations Records % of 7389 Country
University of California System 274 3.71% USA
Tsinghua University 195 2.64% China
Hong Kong Polytechnic University 189 2.56% China
University of California Berkeley 186 2.52% USA
United States Department of Energy DOE 158 2.14% USA
Technical University of Denmark 141 1.91% Denmark
United States Environmental Protection Agency 127 1.72% USA
Lawrence Berkeley National Laboratory 126 1.71% USA
Harvard University 123 1.67% USA
Centre National de la Recherche Scientifique CNRS 91 1.23% France
Chinese Academy of Sciences 85 1.15% China
University of London 82 1.11% UK
Finland National Institute for Health Welfare 80 1.08% Finland
Uppsala University 77 1.04% Sweden
Centers for Disease Control Prevention USA 71 0.96% USA
The top 10 contributing countries, in terms of publications, are reported in Table 2. In first place, the USA accounts for 27.5% of the total literature, with 2032 records, followed by China with 1043 records (14.12%). England, Canada, and South Korea ranked third, fourth, and fifth place, respectively, with a cumulative number of
1.1.3 Results 5 publication equal to the total number of publications in 1990, followed by four European countries and Australia.
Table 2 - Top 10 contributing countries. Country Records % of 7389 USA 2032 27.50% China 1043 14.12% England 444 6.01% Canada 375 5.08% South Korea 371 5.02% Italy 369 4.99% France 355 4.80% Germany 288 3.90% Denmark 282 3.82% Australia 241 3.26%
The top 10 categories are reported in Table 3. However, only the first four constitutes the major fields. The top four categories, in order of importance, are: “Engineering”, “environmental sciences ecology”, “construction building technology”, and “public environmental occupational health”.
Table 3 - Top 10 categories.
Field Record Count % of 7389
Engineering 2839 38.42%
Environmental Sciences Ecology 2426 32.83%
Construction Building Technology 2285 30.92%
Public Environmental Occupational Health 1748 23.66%
Energy Fuels 719 9.73%
Meteorology Atmospheric Sciences 627 8.49%
Chemistry 458 6.20%
Thermodynamics 374 5.06%
Science Technology Other Topics 280 3.79%
Toxicology 275 3.72% Materials Science 184 2.49% Agriculture 142 1.92% Allergy 104 1.41% Instruments Instrumentation 104 1.41% Mechanics 102 1.38%
1.1.3.2 Categories and Journal co-occurring networks
The network of co-occurring subject categories (Web of Science categories), reported in Figure 3, highlights the relationship between the main subjects and disciplines in the field. The thickness of each link represents the density of the co-occurring category and the color map refers to the average year of the node. The color of a category ring denotes the time of corresponding utilization. The thickness of a ring is proportional to how many times the category has been used in a specified time slice. Lighter colors (yellow) correspond to newer nodes, while darker colors (blue)
are related to older nodes. This method enabled us to highlight the multidisciplinary and temporal evolution of the subject. We found that environmental sciences and engineering, construction and building technology, and public, environmental, and occupation health were the main subjects in the IAQ field. Minor categories, constituted mainly by unlabeled nodes because of their lower amount, have been grouped into larger areas. “Material science” is a linking node between chemistry, physics, and environmental studies and “public, environmental, and occupational health” belongs to the highest burst, as it connects the most populous nodes (construction and building engineering with environmental sciences).
Figure 3 - Network of co-occurring subject categories.
In order to outline the set of journals that are connected to the IAQ topic, the co-citation network at the journal level is shown in Figure 4. Like the previous figure, color and thickness reflect the temporal distribution of the cited journals. It was possible to categorize the journals into four macro areas: Medicine-related (center), energy-related (left), building-related (bottom), and environment-related (top). The biggest circles correspond to the most cited journals. The most-cited journals were the ones reported in Figure 2 but, while “Building and Environment”, “Atmospheric Environment”, “Indoor and Built Environment” are, the top three journals in terms of number of publications, the most-cited were “Indoor Air”, “Energy and Buildings”, and “Environmental Health Perspective”. Unlabeled nodes are minor journals given their number of citations.
1.1.3 Results 7
Figure 4 - Network of co-occurring Journals.
1.1.3.3. Term burst
Citation burst is an indicator of the most active part of the research. CiteSpace’s citation burst is based on Kleinberg’s algorithm [3], and it provides evidence that a particular publication (or keyword) has attracted an extraordinary degree of attention from its scientific community. The keywords in the literature can reveal the main research content, and literature citation frequency can reflect research heat. The terms (title, abstract, and keywords) having the strongest citation bursts in the dataset are reported in Table 4. The time intervals are represented by the blue line, while the periods of the burst are highlighted in red, indicating the beginning and end of each burst interval. The full list is reported in the supplementary material.
Table 4 - Terms having high citation burst strengths.
Terms Strength Begin End 1990–2018
Indoor Air-Quality 47.64 1990 1995 ▃▃▃▃▃▃▂▂▂▂▂▂▂▂▂▂▂▂▂▂▂▂▂▂▂▂▂▂▂
Sick Building Syndrome 27.26 1991 2006 ▂▃▃▃▃▃▃▃▃▃▃▃▃▃▃▃▃▂▂▂▂▂▂▂▂▂▂▂▂
Office Workers 10.43 1991 2004 ▂▃▃▃▃▃▃▃▃▃▃▃▃▃▃▂▂▂▂▂▂▂▂▂▂▂▂▂▂ Environmental Tobacco Smoke 33.26 1991 2004 ▂▃▃▃▃▃▃▃▃▃▃▃▃▃▃▂▂▂▂▂▂▂▂▂▂▂▂▂▂ Outdoor Level 9.54 1991 2008 ▂▃▃▃▃▃▃▃▃▃▃▃▃▃▃▃▃▃▃▂▂▂▂▂▂▂▂▂▂ Nitrogen Dioxide 11.89 1996 2002 ▂▂▂▂▂▂▃▃▃▃▃▃▃▂▂▂▂▂▂▂▂▂▂▂▂▂▂▂▂ Personal Exposures 10.57 1998 2005 ▂▂▂▂▂▂▂▂▃▃▃▃▃▃▃▃▂▂▂▂▂▂▂▂▂▂▂▂▂ Fungal Spores 8.63 1998 2006 ▂▂▂▂▂▂▂▂▃▃▃▃▃▃▃▃▃▂▂▂▂▂▂▂▂▂▂▂▂
Respiratory Symptoms 8.79 1999 2008 ▂▂▂▂▂▂▂▂▂▃▃▃▃▃▃▃▃▃▃▂▂▂▂▂▂▂▂▂▂ Displacement Ventilation 9.68 2002 2007 ▂▂▂▂▂▂▂▂▂▂▂▂▃▃▃▃▃▃▂▂▂▂▂▂▂▂▂▂▂ Airborne Bacteria 10.56 2002 2011 ▂▂▂▂▂▂▂▂▂▂▂▂▃▃▃▃▃▃▃▃▃▃▂▂▂▂▂▂▂ Air-Conditioning System 10.19 2004 2011 ▂▂▂▂▂▂▂▂▂▂▂▂▂▂▃▃▃▃▃▃▃▃▂▂▂▂▂▂▂ Health Effects 9.02 2005 2010 ▂▂▂▂▂▂▂▂▂▂▂▂▂▂▂▃▃▃▃▃▃▂▂▂▂▂▂▂▂ Computational Fluid Dynamics 9.48 2007 2012 ▂▂▂▂▂▂▂▂▂▂▂▂▂▂▂▂▂▃▃▃▃▃▃▂▂▂▂▂▂ Air-Conditioned Offices 13.81 2007 2009 ▂▂▂▂▂▂▂▂▂▂▂▂▂▂▂▂▂▃▃▃▂▂▂▂▂▂▂▂▂ Fresh Air 12.19 2008 2012 ▂▂▂▂▂▂▂▂▂▂▂▂▂▂▂▂▂▂▃▃▃▃▃▂▂▂▂▂▂ Ultrafine Particles 11.36 2010 2015 ▂▂▂▂▂▂▂▂▂▂▂▂▂▂▂▂▂▂▂▂▃▃▃▃▃▃▂▂▂ Practical Implications 12.12 2010 2012 ▂▂▂▂▂▂▂▂▂▂▂▂▂▂▂▂▂▂▂▂▃▃▃▂▂▂▂▂▂
Indoor Environmental Quality 16.88 2013 2018 ▂▂▂▂▂▂▂▂▂▂▂▂▂▂▂▂▂▂▂▂▂▂▂▃▃▃▃▃▃ CO2 Concentration 22.72 2014 2018 ▂▂▂▂▂▂▂▂▂▂▂▂▂▂▂▂▂▂▂▂▂▂▂▂▃▃▃▃▃
Indoor PM2.5 19.85 2014 2018 ▂▂▂▂▂▂▂▂▂▂▂▂▂▂▂▂▂▂▂▂▂▂▂▂▃▃▃▃▃
Air Conditioning System 8.00 2014 2016 ▂▂▂▂▂▂▂▂▂▂▂▂▂▂▂▂▂▂▂▂▂▂▂▂▃▃▃▂▂
Indoor Temperature 8.81 2014 2015 ▂▂▂▂▂▂▂▂▂▂▂▂▂▂▂▂▂▂▂▂▂▂▂▂▃▃▂▂▂
Energy Efficiency 8.86 2015 2018 ▂▂▂▂▂▂▂▂▂▂▂▂▂▂▂▂▂▂▂▂▂▂▂▂▂▃▃▃▃
Public Health 9.11 2015 2016 ▂▂▂▂▂▂▂▂▂▂▂▂▂▂▂▂▂▂▂▂▂▂▂▂▂▃▃▂▂
Air Temperature 9.50 2016 2018 ▂▂▂▂▂▂▂▂▂▂▂▂▂▂▂▂▂▂▂▂▂▂▂▂▂▂▃▃▃
Residential Buildings 15.25 2016 2018 ▂▂▂▂▂▂▂▂▂▂▂▂▂▂▂▂▂▂▂▂▂▂▂▂▂▂▃▃▃ Indoor Air Temperature 14.62 2016 2018 ▂▂▂▂▂▂▂▂▂▂▂▂▂▂▂▂▂▂▂▂▂▂▂▂▂▂▃▃▃
Energy Saving 12.56 2016 2018 ▂▂▂▂▂▂▂▂▂▂▂▂▂▂▂▂▂▂▂▂▂▂▂▂▂▂▃▃▃
Thermal Comfort 11.83 2016 2018 ▂▂▂▂▂▂▂▂▂▂▂▂▂▂▂▂▂▂▂▂▂▂▂▂▂▂▃▃▃
Outdoor PM2.5 15.36 2016 2018 ▂▂▂▂▂▂▂▂▂▂▂▂▂▂▂▂▂▂▂▂▂▂▂▂▂▂▃▃▃
From Table 4, the initial “IAQ” burst was coincident with the “sick building syndrome”, “office workers”, “environmental tobacco smoke”, and “outdoor level” term bursts. The term “sick building syndrome” (SBS) is used to describe when building occupants experience acute health and comfort effects that can be linked to the time spent in a building. The first studies were conducted in offices [4,5] in which tobacco smoke was the major pollutant [6,7], as the smoking ban in working and public places had not yet been implemented, together with the presence of contaminants from the outdoor air. By that time, several specific pollutants, like nitrogen dioxide (NO2), fungal spores, and airborne bacteria, were present as strong citation bursts for the 1996–2011. Notably, volatile organic compounds (VOCs) appeared with burst strength lower than the threshold (arbitrarily set to 7.0, which is equal to the median value of the citation burst distribution) in different time intervals; for this reason, they are not reported in Table 4.
All the citation burst still active started after 2013. The introduction of other physical and psychological aspects of indoor life led to the definition of Indoor Environmental Quality (IEQ), within which IAQ occurs. In this last time interval, pollutants with a strong, still active burst are related to fine particulate matter (PM2.5), carbon dioxide (CO2), and “energy saving” fields. Also, the “residential buildings” term appears, which may indicate the shift of academic attention from the work place to private homes, together with increased attention focused on building energy saving and thermal comfort of occupants
1.1.3 Results 9 1.1.3.4. Document co-citation network
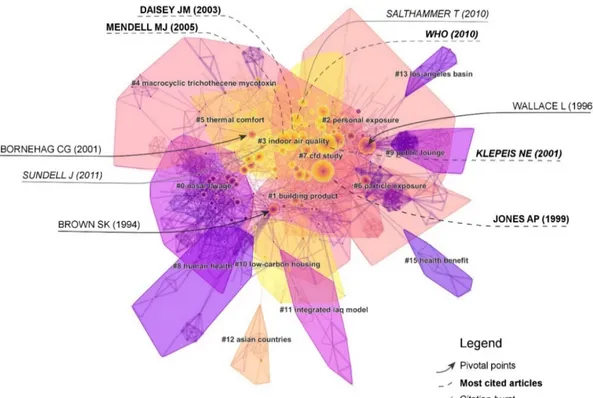
A document co-citation network represents a network of references that have been co-cited by a set of publications. Time was divided into a number of one-year slices, and an individual co-citation network was derived from each time slice. In order to reduce the dimension of every single slice, the top 50 most-cited publications in each year were used to build a network of cited references in that particular year. Subsequently, individual networks were merged. The merged network reported in Figure 5 depicts a spatial visualization of the network, which represents the development of the IAQ topic over time, showing the most important footprints of the related research activities. Each colored node represents a cited reference.
Figure 5 - Landscape views of the resulted network. The arrow indicates the pivotal points;
the most cited articles are written in bold and the citation bursts in italic.
The network in Figure 5 is divided into 19 co-citation clusters. These clusters are labeled by index terms from their own citers. The numbers in front of the cluster’s name are identifiers rank the size of the clusters. The “silhouette” value is a descriptor of the homogeneity of a cluster, and it ranges between −1 and 1; higher values indicate meaningful clusters [8], while the “modularity” measures the extent to which a network can be divided into independent blocks, which ranges from zero to one [9]. The network has a modularity of 0.7437, which is considered to be high, suggesting that the specialties in IAQ are clearly defined in terms of co-citation clusters. The average silhouette score of 0.2579 is low mainly because of the presence of numerous small clusters. Different colors indicate the time when co-citation links in those areas appeared for the first time. Purple areas were generated earlier than yellow areas. Important publications have been reported in the network visualization.
The importance of clustering publications lies in identifying the most important thematic macro areas and to see how they are related to each other. Cluster descriptors in Figure 5 are reported in Table 5. The “size” column refers to the number of
publications within the cluster. The “name” tag was generated by the Log-likelihood algorithm from the articles’ indexing terms [10]. The Log-likelihood algorithm was chosen as it better reflected the cluster topic. The “description” column was manually filled after analyzing the top articles of each cluster having high coverage value. The “range” is the period in which the cluster evolves, or the period covered, by the various publications within the cluster. A straightforward visual representation of this parameter is reported in Figure 6.
Table 5 - Clusters description.
# Size Silhouette Name Description (Years) Range
0 145 0.866 Nasal Lavage Correlation between physical/chemical parameters and occupants symptoms. 1980–1999 1 125 0.725 Building Product Gaseous pollutants: Source, modeling, concentrations. Indoor sources. 1973–2010 2 109 0.766 Personal Exposure Personal exposure to particulate matter. 1981–2006 3 105 0.753 Indoor Air Quality (IAQ) Air quality in school and residential homes. 1992–2017 4 63 0.908 Macrocyclic Trichothecene Mycotoxins Asthma, bacterial and fungal aerosols. 1958–2011 5 43 0.884 Thermal comfort Thermal comfort, relative humidity, HVAC. 1970–2016 6 41 0.916 Particle exposure Risk assessment. Environmental tobacco smoke. 1982–2013
7 41 0.94 CFD study Ventilation. CFD modeling. 1980–2009
8 35 0.962 Human Health Epidemiology of SBS and related symptoms 1975–1995
9 27 0.912 Public Lounge Environmental tobacco smoke. 1969–1996
10 17 0.971 Low-Carbon Housing Air purification techniques. Numerical modeling. 1974–2011
11 16 0.974 Integrated IAQ Model VOC emissions. 1960–2001
12 14 0.999 Asian countries * 1998–2010
13 11 0.997 Los Angeles Basin * 1975–1990
15 10 0.989 Health benefit * 1974–1989
* The cluster shows a high silhouette, but it’s difficult to identify a common topic. VOC, volatile organic; HVAC, Heating, Ventilation and Air Conditioning; CVD, Computational Fluid Dynamics.
Cluster #0 is the largest cluster, containing 145 publications and having a silhouette value of 0.866. It is labeled as “nasal lavage”. The first five publications, with the highest coverage in this cluster, are by Wieslander [11,12], followed by Brooks [13], and Nordstorm [14]. They all investigated the health effects (nasal and ocular) of sick building syndrome in hospitals and public facilities. This cluster collects the first comprehensive studies between built environments through monitoring of chemical and physical parameters (pollutants concentrations, temperature, and humidity) and symptoms of indoor occupants. Publications ranged between 1980 and 1999.
The second largest cluster (#1) has 125 members and a silhouette value of 0.725. While it is the lowest among all clusters, it had a relatively high level of homogeneity.
1.1.3 Results 11 The cluster is labeled “building product”. This second cluster is related to the factors are connected to the presence of gaseous pollutants. The top five, in order of citations, are: Ozone [15], VOC emission from building products [16], NOx and O3 concentration [17], terpene/ozone mixtures [18], and carbonyl compounds [19]. It ranges from 1973 to 2010.
The third largest cluster (#2) has 109 members and a silhouette value of 0.766. It is labeled “personal exposure”. It is representative of the personal exposure to fine particulate matter (PM2.5 and PM10). Articles with the highest coverage are by Bahadori [20], Janssen [21], and Micallef [22]. This cluster, as with the previous one, started after the previous one, but it terminated more recently. It covered 1981–2015.
The fourth largest cluster (#3) has 105 members and a silhouette value of 0.753. It is labeled “indoor air quality”. This cluster collects studies of indoor pollution in schools. While all the population is vulnerable to air pollution, the children are the most at risk. This constitutes a trend of actual interest, starting in 1992 up to current. The measurement of pollutant concentrations [23–25] and the risk assessments [26– 28] are the main topics in this cluster.
The fifth largest cluster (#4) has 63 members and a silhouette value of 0.908. It is labeled “macrocyclic trichothecene mycotoxin”. The trichothecene mycotoxins are a group of toxins produced by some fungi. Some of these substances may be present as contaminants in mold and transported through aerosols. This cluster is representative of bacterial and fungal aerosols, as well the role of environmental factors in asthma. This cluster extends from 1958 to 2011.
The sixth largest cluster (#5) has 43 members and a silhouette value of 0.884. It is labeled “thermal comfort” and includes research papers on thermal personal comfort, Heating, Ventilation and Air Conditioning (HVAC), and the effect of relative humidity. This cluster extended from 1970 to 2016.
The seventh largest cluster (#6) has 41 members and a silhouette value of 0.916. It is labeled as “particle exposure” and collects publications about the environmental tobacco smoke. This cluster started in 1982 and ended in 2013, probably due to the implementation of non-smoking laws, which reduced the exposure to these pollutants. Figure 6 shows the timeline visualization in CiteSpace, in which clusters are distributed along the horizontal timeline, reported in the top view. In black are the top two items ranked by centrality, while the colors represent the top three most cited articles. The full list of articles, ordered by coverage for each cluster, is reported in the supplementary file.
Figure 6 - Timeline view of the clusters.
Most-cited articles
The top-ranked item by citation counts is a comprehensive review of the relationship between indoor air pollution and health by Jones [29] in Cluster #6, with 262 citation counts. The second most-cited article is by Klepeis [30] in Cluster #2, with the publication of the National Human Activity Pattern Survey (NHAPS): A two-year probability-based telephone survey, sponsored by the U.S. Environmental Protection Agency (EPA), to assess the population exposure to environmental pollutants, with 261 citation counts. The third most-cited article is by Daisey [31] in Cluster #3, with 233 citation counts. In this review, data about ventilation rates, pollutants concentrations, and symptoms related to indoor air contaminants in schools were collected. The results highlighted the limited knowledge on the topic and it was a starting point for all current research on IAQ in schools, as shown in Figure 6, Cluster #3. The fourth is the “Indoor Air Quality Guidelines” by the World Health Organization (WHO) in 2010 [2] (Cluster #3) with 151 citation counts. The guidelines identified in benzene, carbon monoxide, formaldehyde, naphthalene, nitrogen dioxide, polycyclic aromatic hydrocarbons, radon, trichloroethylene, and tetrachloroethylene the selected indoor pollutants. The choice was made for three reasons: (1) These compounds have indoor sources, (2) they are known because of their hazardousness to health, and (3) they are often found indoors in concentrations of health concern. Particulate matter (PM) was exempt from the list, as it appears into the WHO guidelines on particulate matter were updated in 2005 [32], which also apply to indoor spaces. Mendell [33] in Cluster #3, who reviewed the literature on school environments and performance, had the same number of citations.
1.1.3 Results 13 Citation bursts
As previously reported, citations bursts are a strong indicator of scholarly impact in terms of the attention of the research community. Table 6 reports the first five
citation bursts. The top-ranked item by citation bursts is the WHO guideline for indoor air quality [2], in Cluster #3. The second is a multidisciplinary review of the scientific literature on ventilation rates and occupant health by Sundell [34] and the third is by Klepeis [30]. Following these are two reviews about the relationship between indoor and outdoor particles by Chen et al. [35] and about formaldehyde by Salthammer [36]. These first five publications bursts belong to Clusters #2 and #3. Clusters with numerous nodes with strong citation bursts can be considered an emerging trend, so for this reason, Cluster #3 is of a particular interest.
Table 6 - Top 5 citation bursts.
Bursts References Cluster
44.37 World Health Organization (WHO) Guidelines For Indoor Air Quality [2] 3 37.81 Ventilation rates and health: Multidisciplinary review of the scientific literature [34] 3 33.83 The National Human Activity Pattern Survey (NHAPS): A resource for assessing exposure to environmental pollutants [30] 2 28.03 Health Effects of Fine Particulate Air Pollution: Lines that Connect [37] 3
27.76 Formaldehyde in the Indoor Environment [36] 3
Pivotal points
Nodes that have high betweenness centrality scores, as defined by Freeman [38], are an indicator of how strongly a reference connects references associated with two or more clusters. Centrality is normalized to the unit interval of [0, 1]. The sigma score (Σ) of a node is a composite metric of the betweenness centrality and the citation burstness of the node, computed as (𝑐𝑐𝑐𝑐𝑐𝑐𝑐𝑐𝑐𝑐𝑐𝑐𝑐𝑐𝑐𝑐𝑐𝑐𝑐𝑐 + 1)𝑏𝑏𝑏𝑏𝑏𝑏𝑏𝑏𝑏𝑏𝑏𝑏𝑏𝑏𝑏𝑏𝑏𝑏 [9].
The 1994 Brown paper (centrality = 0.14, Σ = 3.22) [39] is a typical pivot node; it is a strong contact point mainly between the two biggest clusters, and to a lesser extent between Cluster #8 and Cluster #10, as shown in Figure 5. This review systematically compared the concentration of VOCs in the indoor air of buildings of different classifications and categories, drawing mainly from the articles in Cluster #0 (1980– 1999). Results suggested that indoor concentrations were significantly elevated above those outdoors, indicating that they were emitted from indoor sources. The aspect of source emission and modeling was afterward deepened by the publications gathered in Cluster #1 (as reported in Table 5).
Contemporary to the work of Brown about the analysis of the relationships between VOCs is the work of Wallace (centrality = 0.13, Σ = 9.05) [40], in which particle concentrations and sources in homes and buildings were summarized in detail. The conclusions suggested tobacco smoking as the leading source of indoor PM and secondary, cooking. Many links to Cluster #9 (topic—environmental tobacco smoke) highlight this aspect. Different from the previous study, PM infiltrations from the outdoors were found to contribute significantly to indoor PM. These first two papers have the highest centrality for Clusters #1 and #2, respectively.
The work of Bornehag (centrality = 0.06, Σ = 2.47) [41] is part of Cluster #5 (topic—“thermal comfort, relative humidity, HVAC”). In this study, the relationship
between “dampness” in building and health was considered, concluding that there is evidence for a strong association between them. Dampness is usually related to the presence of microbial agents (supporting the closeness to Cluster #4) as airborne molds and bacteria. However, due to the limited knowledge about the mechanisms behind the association between ‘dampness’ and health effects, it is difficult to intervene to limit this problem, unlike other known major pollutants.
1.1.3.5. Actual and future trends
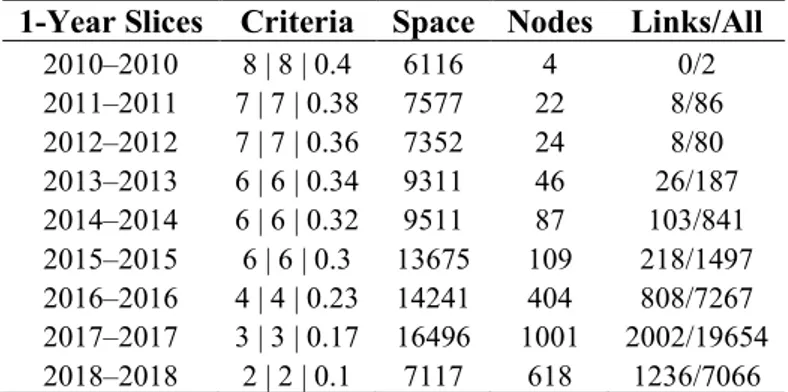
In the second part of the analysis, a restricted dataset (from 2010 to 2018) was used. The results of the selection are reported in Table 7. For each year slice, in the “Criteria” column, the interpolated citation, co-citation, and the cosine coefficient thresholds are reported [42]. The “Space” column reports the number of articles having at least one citation within the related year-slice.
Table 7 - Description of the new restricted dataset, resulting from the thresholding. 1-Year Slices Criteria Space Nodes Links/All
2010–2010 8 | 8 | 0.4 6116 4 0/2 2011–2011 7 | 7 | 0.38 7577 22 8/86 2012–2012 7 | 7 | 0.36 7352 24 8/80 2013–2013 6 | 6 | 0.34 9311 46 26/187 2014–2014 6 | 6 | 0.32 9511 87 103/841 2015–2015 6 | 6 | 0.3 13675 109 218/1497 2016–2016 4 | 4 | 0.23 14241 404 808/7267 2017–2017 3 | 3 | 0.17 16496 1001 2002/19654 2018–2018 2 | 2 | 0.1 7117 618 1236/7066
In this last period, the most active institutions are reported using a geographical distribution map, which was created using “Generate Google Earth Maps” in CiteSpace (Figure 7). The colors on the maps show the institution that published papers about IAQ during the last eight years. The most active areas are colored in red. Notably, this map only highlights the quantity and not the quality of the publications.
1.1.3 Results 15 Figure 7 shows that countries and territories in Europe, Northeast U.S., and East Asia participated actively in IAQ research in the recent years. The results of the actual geographical map were consistent with the total contribution by country, reported in Table 2, which referred to the complete dataset.
Articles with high citation bursts in the development of IAQ, between 2010 and 2018 are reported in the following list, ordered in ascending initial burst date. References with strong values in the “Strength” column can be considered relevant in the last eight years for the IAQ field. The “Topic” column summarizes the content of the publication. The “Begin” and “End” columns report, respectively, the beginning and end of the citation burst.
The first milestone, in the last eight years of study, is the IAQ guidelines published by the WHO. Notably, 10 of the 25 publications reported in Table 8 are related to the school environment, and this constitutes a major topic. Another topic common between articles having a strong citation burst is the relationship between indoor and outdoor pollutants, followed by studies on ventilation.
Table 8 - A list of 25 articles having a strong (“strength”>5) citation burst
References Topic Strength Range 2010–2018
Yu, C.W.F.,
2010 [43] VOCs and formaldehyde emissions 15.73 2011–2014 ▂▃▃▃▃▂▂▂▂
WHO, 2010 [2] IAQ: WHO guidelines 23.65 2012–2015 ▂▂▃▃▃▃▂▂▂
Yu, C.W.F.,
2011 [44] IEQ assessment: Standards and certifications 13.93 2012–2013 ▂▂▃▃▂▂▂▂▂ Chen, C., 2011 [35] Indoor/outdoor particles relation 11.44 2013–2015 ▂▂▂▃▃▃▂▂▂
Dimitroulopoul
ou, C., 2012 [45] Ventilation in European dwellings 8.58 2013–2015 ▂▂▂▃▃▃▂▂▂ Zhang, Y.P.,
2011 [46] A review on fan-driven air cleaning technologies 7.18 2013–2015 ▂▂▂▃▃▃▂▂▂ Salthammer, T.,
2010 [36] Indoor Formaldehyde 8.76 2013–2015 ▂▂▂▃▃▃▂▂▂
Sundell, J., 2011 [34] Ventilation rates and health 16.36 2013–2015 ▂▂▂▃▃▃▂▂▂
Almeida, S.M.,
2011 [47] Children exposure to PM in primary schools 19.63 2013–2015 ▂▂▂▃▃▃▂▂▂ Lim, S.S., 2012 [48] burden caused by different risks Risk assessment of disease 11.43 2014–2015 ▂▂▂▂▃▃▂▂▂
Hospodsky, D.,
2012 [49] Human occupancy as a source of indoor airborne bacteria 5.41 2014–2015 ▂▂▂▂▃▃▂▂▂ Satish, U., 2012 [50] decision-making performance Effects of CO2 on human 5.93 2014–2015 ▂▂▂▂▃▃▂▂▂
Geiss, O., 2011 [51] VOC in public buildings, schools, kindergartens 5.15 2014–2015 ▂▂▂▂▃▃▂▂▂
Pegas, P.N.,
2011 [52] Outdoor/indoor air quality in primary schools 8.67 2014–2015 ▂▂▂▂▃▃▂▂▂
Guo, H., 2010 [53] PM2.5 in school 9.39 2014–2015 ▂▂▂▂▃▃▂▂▂
Logue, J.M.,
Pegas, P.N.,
2010 [55] Outdoor/indoor air quality in primary schools 10.06 2014–2015 ▂▂▂▂▃▃▂▂▂ Qian, J., 2012 [56] bacteria and fungi in classroom Emission rates of airborne 6.31 2014–2015 ▂▂▂▂▃▃▂▂▂ Wichmann, J.,
2010 [57] Indoor/outdoor relationships PM2.5, soot and NO2: 6.54 2014–2015 ▂▂▂▂▃▃▂▂▂ Branis, M.,
2011 [23] PM in school gyms 6.69 2014–2015 ▂▂▂▂▃▃▂▂▂
Pegas, P.N.,
2011 [58] Indoor air quality in schools 9.93 2014–2015 ▂▂▂▂▃▃▂▂▂ Pegas, P.N.,
2012 [59] Pollutants inside school 6.43 2014–2015 ▂▂▂▂▃▃▂▂▂
Annesi-Maesano, I.,
2013 [60] IAQ in school 5.20 2014–2016 ▂▂▂▂▃▃▃▂▂
Fabi, V., 2012 [61] Occupants' window opening behavior 5.38 2015–2016 ▂▂▂▂▂▃▃▂▂
Mendell, M.J.,
2013 [62] Classroom ventilation and reduced illness absence 6.77 2015–2016 ▂▂▂▂▂▃▃▂▂
1.1.4 Discussion
The categories and journals co-occurrence analysis showed the multidisciplinary nature of the IAQ topic and the most relevant categories. Although only a few journals are now the most active, the network of co-occurring journals reported an articulated structure, groupable into four macro thematic areas: Medicine, energy, buildings, and environments. Temporal patterns showed IAQ is a theme that has changed over time, often due to new external stimuli (different sources of pollution, different environments, and new emerging countries), and the result of new laws enacted, due to a greater awareness of the topic, such as non-smoking laws. Cluster analysis found 15 well-defined clusters, of which two (Cluster #2, “personal exposure” and Cluster #5, “thermal comfort”) are still active.
This study, although not comparable to a systematic and in-depth study of the issue, has allowed us to delineate the past and present of IAQ research. The analysis of when the meaningful terms had a citation burst, together with the study of the cluster timeline, shows how the concept of IAQ has blossomed, starting from a medical point of view, i.e., from the study of the symptoms of SBS in places of work. Over the years, the focus has shifted to the characterization of pollutants and risk assessment. With the introduction of the ban on smoking in public places and workplaces, one of the prevailing indoor sources has been greatly reduced.
At the same time, academic attention initially focused on workplaces, and then moved to public buildings, especially schools and hospitals. The implementation of non-smoking laws has reduced the focus on the Environmental Tobacco Smoke (ETS), despite the recent introduction of electronic cigarettes on the market.
Although many studies have been completed on indoor and outdoor sources of pollutants and risk assessments on poor air exposure, in many parts of the world, these sources have been abruptly reduced (ETS, for example), so IAQ remains important.
From the presence of new sources, ignored until a few years ago as niche or because they were non-existent (3D printers, electronic cigarettes), the field has
1.1.4 Discussion 17 evolved from the need to make workplaces as appropriate and pleasant as possible (by thinking of a broader concept of Indoor Environmental Quality, in which more environmental parameters are considered to increase productivity), due to the ubiquitous use of new available technologies (low-cost sensors and DNA sequencing techniques), to the new frontiers in indoor chemistry and transformation of indoor pollutants. These are just a few examples of the challenges that the scientific community working on the issue of IAQ has encountered in recent years, without considering the research based on non-major fields. These challenges range from the impact of clothing on exposure, to smart technologies, from the study of phytoremediation and materials able to passively improve air quality [63–65] to new technologies and purification processes [46,64,66–68]. The monitoring of indoor airborne pollutants is a necessary step for assessing personal exposure to pollutants not previously considered. Many of the chemicals presently found in indoor environments were not present in the past, and concentrations have varied over time due to the use of different building materials, new consumer products, electrical appliances, and cleaning products. For this reason, new monitoring campaigns, as well as new sampling methods, are required. Passive samplers are popular and convenient for distributed and long-term exposure assessment, but they cannot provide a short time-resolved picture of the indoor air, which can be completed by using more expensive analyzers. Widespread low-cost sensors are valuable resource that could be coupled with well-established monitoring techniques because, even if they have recently shown an improvement in power consumption, sensitivity, and resolution, they still have problems in selectivity. So, at the time of writing the present article, only laser scattering-based sensors for PM measurement provide acceptable results [69,70].
The collection of big data obtained from ubiquitous sensor networks [69,71,72] requires determining how to process and extract useful information from the raw data, and semantic frameworks can be a useful tool to address this challenge [73].
From another point of view, 1.2 billion people from developing countries are without access to electricity, while nearly 3 billion people worldwide are exposed to the threat of household air pollution every day from the use of solid fuel for cooking, heating, and lighting [74,75].
These are only a few aspects the indoor air community has to consider. Scientometric tools can be useful to analyze, categorize, and identify milestone and turning points in the scientific literature. However, these tools cannot be considered exhaustive and scientific advances will probably be driven by new multidisciplinary contaminations into the discipline.
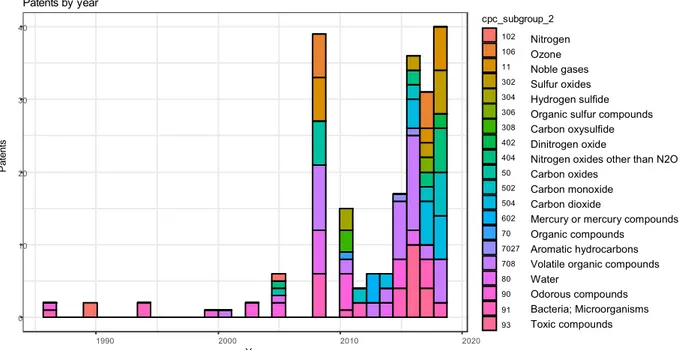
In Paragraph 1.2, a comparison between scientific production and patent literature about indoor air quality control techniques has been conducted;
• despite the presence of many different technologies for the
removal of pollutants, out of 111 registered patents, the majority comprised of filtration and adsorption processes;
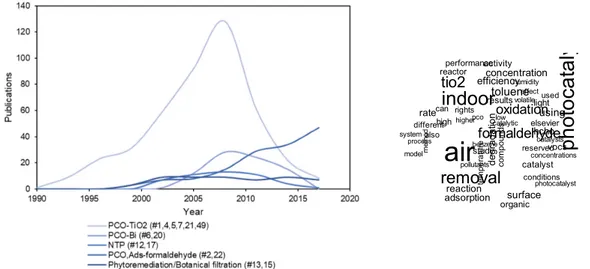
• photocatalysis is the major topic in the scientific literature,
starting in 1990, dramatically increasing in 1998, reaching a peak in 2008 and decreasing up to nowadays, while its presence in the patent literature starts in 2010;
• non-thermal plasma oxidation, botanical filtration, and
phytoremediation are novel treatment technologies. Around the latter two, it is shown an intense and recent patent activity.
1.2 Indoor Air Treatment: a comparison between
scientific and patent literature
1.2.1 Introduction
1.2.1.1 Indoor pollutants
Indoor air pollution is a complex issue, consisting of a multitude of pollutants, occurring in confined environments, which may pose threats to human health. As a result of the bibliometric study, presented in the previous chapter, pollutants’ studies can be clustered into three macro areas: particulate pollutants, gaseous pollutants, and microbiological pollutants. This type of classification is particularly useful from a control technology perspective, as different technologies are more effective on a specific class of pollutants.
Gaseous pollutants
Organic compounds
Both the European and the American definition of VOC is an organic compound having an initial boiling point less than or equal to 250° C, measured at a standard atmospheric pressure of 101.3 kPa [76,77].
VOCs are ubiquitous in indoor environments. They are commonly present in consumer products, cleaning products, furnishing and building materials, paints, office equipment, and they are generated by human activities, such as cleaning, tobacco smoking, and cooking.
The World Health Organization (WHO) categorizes indoor organic pollutants by how easily they are emitted:
1.2.1 Introduction 19 • Very volatile organic compounds (VVOCs)
• Volatile organic compounds (VOCs) • Semi-volatile organic compounds (SVOCs)
While the VOC and VVOC indoor emission are generally easily assessed, SVOC, (including pesticides, plasticizer and fire retardants), require a much longer monitoring period, and only recently the public attention focused on this last type of pollutants.
Gallego et al. [78] identified 113 VOCs in indoor environments, with a total VOC concentration of 1.33 ±1.53 mg/m3 in a case study where the primary source was outdoor. Previous studies reported similar results, with the total volatile organic compound (TVOC) concentration of about 1.1 mg/m3 average [39] and the mean concentration of each VOC is generally between 5 μg/m3 and 50 μg/m3.
Among the variety of VOCs occurring in indoor environments, alkanes and aromatic compounds comprise the major classes.
To some VOC have been associated with adverse respiratory effects [43], and to others have been classified as known human carcinogens [79].
Inorganic compounds
Inorganic gases are mainly represented by gaseous compounds such as NO2, SO2, O3, CO, and they are generally traffic-related pollutants, and the presence in the indoor environments is due to their penetration from the outdoor. Many activities involving combustion (i.e., cooking, heating, incense burning, tobacco smoke), may dramatically increase indoor levels.
The NO2 natural background means concentrations are in the range 0.4–9.4 μg/m3, while indoor average, with unvented gas combustion appliances, may reach 200 μg/m3, with short-term episodes up to 2000 μg/m3. Normal healthy people experienced pronounced decrements in pulmonary function for concentration equal to 4700 μg/m3 (2.5 ppm), for short-term NO2 exposure [80].
In the last decades, SO2 concentration in the environments showed a decline, mainly due to changes in fuel use. However, the coal-burning activity can result in local episodes of higher concentrations. WHO guidelines [32] report as 24-hours limit concentration 125 μg/m3, while for the annual 50 μg/m3.
Ground-level ozone (O3) is a pollutant. In the environment, O3 is formed by the action of short-wavelength radiation from the sun on nitrogen dioxide, and it can be enhanced by the presence of VOCs. Background levels of O3, are in the range 40–70 μg/m3. Indoor ozone concentrations can be significantly increased by many sources, such as ozonizers, electrostatic filters, and photocopying machines. Short-term acute effects for ozone exposure, in healthy adults, have been observed at a concentration threshold of 160 μg/m3. The health risk to prolonged exposition includes respiratory symptoms, pulmonary function changes, and airway inflammation [80].
Carbon monoxide (CO) is produced by the incomplete combustion of carbon-containing fuels; indoor concentrations are generally comprised between 1 and 10 mg/m3 [2,81]. Among the health effect of exposure to CO, fatigue, reduced brain function, cause eye irritation, headaches, confusion, it can be fatal at very high concentrations because of its oxygen intake inhibition.
Particulate/fibrous pollutants
According to the aerosol science terminology, dust is defined as solid particles larger than 0.5 μm, which can deposit on surfaces. The majority of house dust particles are of biological origin in the order of tens of micrometers [23,49,82].
Fibers, instead, are characterized by a length-to-diameter ratio of a least 3:1, by a length of more than five μm and a diameter of fewer than three μm [82]. They can be classified in natural or artificial and organic or inorganic.
Their diameter-based classification is of particular interest when we want to compare them with their effect on the human body. The inhalable fraction remains in the mouth and head area, while the thoracic fraction penetrates the airways of the respiratory system. At last the respirable particulates, the smallest fraction, can infiltrate most deeply into the alveolar region and penetrate the organism.
Figure 8 – Distribution of the particulate found in the region
One of the most known pollutants within this family is asbestos, which, in the past, has been widely used in materials construction. This particular mineral (exhibiting roughly a 1:20 aspect ratio) has been found to cause mesothelioma and several types of cancer.
However, particulate matter can be not hazardous by itself, but for the molecules, they can vehicle. For instance, SVOC or endocrine disruptors can be adsorbed on the surface of dust and particles, even in appreciable amounts [83].
Biological pollutants
Biological pollutants found indoor comprise animal allergens, viruses, bacteria, and related endotoxins, molds, which release spores and microbial volatile organic compounds (MVOC). Allergens produced by house dust mites are considered to be the most important causes of hypersensitivity pneumonitis, allergic rhinitis and some types of asthma. Bacteria and fungi, present in damp areas, may cause building-related severe disease as well, ( e.g., the Legionella bacteria).
1.2.1.2 Indoor treatment technologies
Three basic strategies may be applied to reduce indoor pollution, in order to improve IAQ: source reduction, dilution ventilation, and active control systems. While the first one is not always actable, increasing ventilation does not necessarily involve the reduction of pollutant concentrations above a safe limit; nevertheless it may imply
1.2.1 Introduction 21 to bring in more pollutants from the outside, and it is inconsistent with energy saving policies. For these reasons, purification/treatment technologies deserve special attention nowadays. Their effectiveness widely varies, because both of the implemented process, both of the used material. Zhang et al., from the analysis of 59 literature study, come to the point that none of the reviewed technologies was able to effectively remove all indoor pollutants, that some of them are mostly ineffective, and may produce harmful by-products [46].
In the follow section are reported the commont techniques to remove pollutants from the indoor air and they are summarized in Table 10.
Mechanical filtration
Mechanical filtration is one of the most widely used air purification technique for removing suspended particles because of its simplicity of use most economical means. The minimum requirement is defined as a “fan-filter unit,” where a filter media is placed upstream the fan. This technique is effective on particles, which are captured by interception, impact, diffusion, electrostatic deposition or gravitational settling; for this reason, filter media undergoes to a progressive decrease of the removal efficiency, jointly with an increase of the pressure drop. A typical filter efficiency for individual filtration mechanisms and total filtration efficiency is reported in Figure 9. It is possible to observe that three fundamental mechanisms act concurrently and with different intensity, according to the particle size.
Figure 9 – Mechanisms defining the collection efficiency of a typical filter media
Mechanical filter efficiency generally depends on the type and the material of the filter; from the air flow and the size of the particulate. The three most commonly used operating parameters that characterize an air filter are the filtration efficiency, the pressure drop across the filter and the dust-holding capacity. Filtration efficiency is defined as
η=1−C
down/C
up Equation 1Here, Cup and Cdown represent the particle concentrations (particles/cm3) upstream and downstream of the filter, respectively.