Università Politecnica delle Marche
Scuola di Dottorato di Ricerca in Scienze dell’Ingegneria
Curriculum in “Ingegneria biomedica, elettronica e delle telecomunicazioni”
---
Estrazione non invasiva del segnale
elettrocardiografico fetale da registrazioni con
elettrodi posti sull’addome della gestante
Non-invasive extraction of the fetal electrocardiogram from
abdominal recordings by positioning electrodes
on the pregnant woman’s abdomen
Tesi di dottorato di
Angela Agostinelli
Abstract
The heart is the first organ that develops in the fetus, particularly in the very early stages of pregnancy. Compared to the adult heart, the physiology and anatomy of the fetal heart exhibit some significant differences. These differences originate from the fact that the fetal cardiovascular circulation is different from the adult circulation. Fetal well-being evaluation may be accomplished by monitoring cardiac activity through fetal electrocardiography (fECG). Invasive fECG (acquired through scalp electrodes) is the gold standard but its invasiveness limits its clinical applicability. Instead, clinical use of non-invasive fECG (acquired through abdominal electrodes) has so far been limited by its poor signal quality. Non-invasive fECG is extracted from the abdominal recording and is corrupted by different kind of noise, among which maternal ECG is the main interference. The Segmented-Beat Modulation Method (SBMM) was recently proposed by myself as a new template-based filtering procedure able to provide a clean ECG estimation from a noisy recording by preserving physiological ECG variability of the original signal. The former feature is achieved thanks to a segmentation procedure applied to each cardiac beat in order to identify the QRS and TUP segments, followed by a modulation/demodulation process (involving stretching and compression) of the TUP segments to adaptively adjust each estimated cardiac beat to the original beat morphology and duration. SBMM was first applied to adult ECG applications, in order to demonstrate its robustness to noise, and then to fECG applications. Particularly significant are the results relative to the non-invasive applications, where SBMM provided fECG signals characterized by a signal-to-noise ratio comparable to that characterizing invasive fECG. Thus, SBMM may contribute to the spread of this noninvasive fECG technique in the clinical practice.
Chapter index
Fetal electrocardiography: extraction of the non-invasive fetal electrocardiogram ... i
Chapter 1 Physiological background ... 1
1.1 Physiology of the fetal heart ... 1
Development of fetal heart ... 1
Feto-maternal compartment ... 2
Fetal presentations ... 4
Anatomy of the adult heart ... 4
Anatomy of the fetal heart: differences with respect to the adult heart ... 5
1.2 Origin of the electrocardiographic signal ... 6
Cardiac activity at cellular level ... 6
Cardiac activity at tissue level ... 8
Cardiac activity at cutaneous level ... 8
1.3 Characteristics of the electrocardiographic signal ... 9
Cardiac vector ... 11
1.4 Characteristics of the fetal electrocardiographic signal ... 11
Clinical Information from fetal electrocardiographic signal ... 13
Chapter 2 Non-invasive fetal electrocardiography ... 16
2.1 Introduction to fetal cardiac monitoring: cardiotocography and invasive fetal electrocardiography ... 16
2.2 Non-invasive fetal electrocardiography ... 19
Electrodes features ... 19
Electrode configurations ... 21
Abdominal signals recorded on the maternal abdomen ... 23
Automatic extraction of fetal electrocardiographic signal... 27
Automatic processing of fetal electrocardiographic signal: features extraction ... 30
Chapter 3 The “Segmented-Beat Modulation Method”... 32
3.1 Template-subtraction techniques ... 32
3.2 The “Segmented-Beat Modulation Method” ... 33
Chapter index
2. ECG estimation ... 34
3.3 “Segmented-Beat Modulation Method” for electrocardiogram estimation from noisy recordings ... 34
Validation studies: simulation and clinical study ... 36
Analysis of the results in simulation and clinical study... 39
Discussion of the obtained results ... 43
Chapter 4 Application of the Segmented-Beat Modulation Method for fetal electrocardiogram extraction ... 46
4.1 Fetal electrocardiogram extraction by Segmented-Beat Modulation Method with optimal R-peak detection ... 46
Signal-to-noise ratio computation for fetal electrocardiogram ... 48
Results obtained by applying SBMM in invasive and non-invasive fetal recordings .. 49
Discussion of the obtained results ... 51
4.2 Optimal fetal R-peak identification in non-invasive fetal electrocardiogram ... 54
Pan-Tompkins algorithm ... 55
Improved Pan-Tompkins algorithm for fetal R-peak identification ... 55
Signal characterization and statistics ... 57
Results obtained by applying PTA and IFPTA in invasive and non-invasive fetal electrocardiograms ... 58
Discussion of the obtained results ... 60
Conclusion ... iii
Introduction
Fetal electrocardiography:
extraction of the non-invasive fetal
electrocardiogram
High-risk pregnancies are becoming more prevalent. The possible causes of complicated pregnancies can be preterm delivery, fetal oxygen deficiency, fetal growth restriction, or hypertension [1-3]. Early detection of these complications is fundamental to permit timely medical intervention, but is hindered by strong limitations of existing monitoring technology. The most common method to monitor the fetal health condition is cardiotocography (CTG), i.e. the monitoring of the fetal heart rate (HR) and its variability (HRV) in response to the utero activity [4]. Currently, in obstetrics practice, fetal HR is obtained by two different ways: non-invasively by a (Doppler) ultrasound probe on the maternal abdomen, or, more rarely, invasively by an electrode fixed on the fetal scalp [5]. The first is relatively inaccurate but is non-invasive and applicable in all stages of pregnancy [6]. The latter is more accurate but it can be applied following rupture of the membranes and sufficient dilatation, restricting its applicability at only the last phase of pregnancy [5]. Also, besides the accuracy issue, CTG has a high sensitivity but a low specificity [4]. This means that in most cases of fetal distress, CTG reveals specific patterns of HRV, but these patterns can also be revealed for healthy fetuses. Consequently, the result is a complicate diagnosis of the fetal conditions. Thus, to prevent not necessary interventions, additional information to CTG are required. Monitoring of the fetal health condition by the fetal electrocardiogram (fECG), as a supplement of CTG, provides an added value due to the more information which can be derived from fECG morphology [7]. Unfortunately, the application of fECG in obstetrical diagnostics is limited because at present fECG can only be reliably measured by an invasive scalp electrode. To overcome this limited applicability, many attempts have been made to record a non-invasive fECG by applying electrodes on the maternal abdomen, but these attempts have not yet led to approaches that permit widespread clinical application [5]. This is due to the low signal-to-noise ratio (SNR) which characterized the non-invasive recordings. From a mathematical point of view, the non-invasive recording can be considered as a summation of three components:1) fECG (or signal of interest), 2) maternal ECG (or primary
Introduction
interference) and 3) noise of physiological or not physiological nature. These components have the same frequency content (about 0,5-100 Hz) and then, they result overlapped in frequency. To extract the signal of interest, such as fECG, traditional linear filtering cannot be applied because works under fixed bands. Thus, further signal processing techniques are required. Many techniques have been proposed for fECG extraction and can be summarized in linear or nonlinear decomposition techniques (among which the independent component analysis is the most commonly used), template subtraction and adaptive filtering. Thus, the aim of this thesis is to propose the extraction of fECG signal from the non-invasive recording by a new template-based technique, called Segmented-Beat Modulation Method (SBMM) [8-11]. SBMM is developed and implemented at the Department of Information Engineering of the Polytechnic University of Marche. Covered by Italian patent, now is waiting for international extension. Differently to common template-based techniques present in the literature, SBMM is able to reproduce the regular physiological ECG variability from which it is possible to derive clinically useful information. At first proposed for ECG estimation from noisy recordings, SBMM was applied to fECG estimation from the non-invasive recordings.
Physiological background
Chapter 1
Physiological background
In this chapter, the physiological background of fECG signal is covered. In addition, several parameters that can be derived from the fECG are discussed. Although this chapter deals about of the clinical evaluation of fECG, it does not present an overview of the state-of-the-art of signal processing techniques for extracting and analysis of the fECG. These techniques are discussed later in more detail.
1.1
Physiology of the fetal heart
Development of fetal heart
The heart is the first organ that develops in the fetus, particularly in the very early stages of pregnancy [12] (see Fig. 1.1). Already between 3th and 7th week after fertilization, a
simple tube assumes the shape a four-chambered heart, as shown in Fig. 1.2. Generally, the heart begins to beat by the 3rd week of life and the blood is pumped in a separate closed circulatory system. Between 7th to 9th week, the fetus can be externally monitored by ultrasound imaging, even if the quality of these images is not excellent. In addition, the ultrasound imaging cannot measure the cardiac waveforms and beat-to-beat variability of HR. At 20th week, the fetal heart can be heard and usually is characterized by a frequency between 120-160 bpm. At 6th week of gestation, brain waves can be recorded, the skeleton is completed and most reflexes are present. However, the embryo is only 0,5 cm long. Between the 12th and 14th week of gestation, when the fetus weighs around 30 gr and is about 7 cm long, the muscles begin to develop and spontaneous movements can be observed. Only at 26th week, the fetus begins to inhale and exhale. Of course, the fetus is not breathing air and the blood oxygenation follows a separate circle. The normal gestation time is approximately 40 weeks [13]. Although the fetus is capable of living outside the womb already from 23th-24th week, this would be considered premature at
Physiological background
birth. Indeed, at 23th week the chance of viability outside of womb is around 15%, while it rising (around 56%) at 24th weeks and (around 79%) at 25th week.
Fig. 1.1. The fetus and its heart in the early stages of development [14].
Feto-maternal compartment
Fig. 1.3 show the simplified anatomy of the feto-maternal compartment. The fetus is surrounded by several different anatomical layers with different electrical conductivities [15], as reported in Table 1. The highest and lowest conductivity are found in the amniotic fluid and the vernix caseosa, respectively. Both these layers surround the fetus completely. In maternal abdomen compartments, the skin and the subcutaneous fat have a poor conductivity (about ten times smaller than the muscle tissue [15]). However, these two layers represent the interface between the electrodes and the internal tissue and have considerable influence on the recorded fECG. All of these different tissues and layers consist a so-called volume conductor, in which the fetal cardiac signals propagate up to the maternal body surface. The volume conductor is not constant. During the gestation, its electrical conductivity and its geometric shape continuously vary. Particularly, in the second half of gestation (from 20th week onward) when the amniotic fluid, the placenta and
the fetus itself are all increased in volume [16]. The vernix caseosa (layer at very low conductivity) forms between 28th and 32nd week of gestation [15], and electrically shields
Physiological background
the fetus. However, the fECG recording on the surface of the maternal abdomen become very difficult. In normal pregnancies, the vernix caseosa slowly dissolves between 37th and 38th week of gestation [15].
Fig. 1.2. Development of the fetal heart during gestation in chronological order (from a to f) [14].
Physiological background
Fetal presentations
During the first two trimesters of pregnancy, the fetus has not a specific presentation and moves about a lot. By the middle of the third trimester, the fetus commonly settles in a head-down position known as the vertex presentation, which is more appropriate for birth [17]. However, as shown in Fig. 1.4, the fetus may also settle in other less probable presentations. The presentation of the fetus influences the fetal cardiac signals recorded from the maternal body surface over different leads [18].
Fig.1.4. Different fetal presentations and the percentage of incidence at the end of gestation [14]
Anatomy of the adult heart
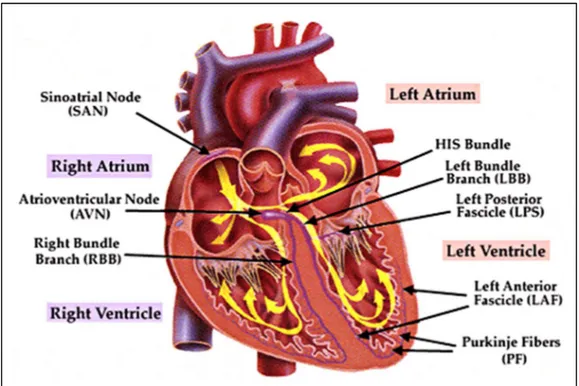
The adult heart is a muscular organ that consists of two separate pumps (right and left pumps) [19]. The right pump pumps the blood through the lungs and the left pump pumps the blood through the peripheral organs. Each of these parts is composed of two chambers: an atrium (upper) and a ventricle (lower). While the atrium helps the blood to move into the ventricle, the ventricle thrusts the blood through the pulmonary or peripheral circulation. The heart has a specialized system for generating rhythmical impulses, which cause rhythmical contractions of the heart muscle, and conducting these impulses rapidly through the heart. When this system normally works, atria contract a few moments ahead of ventricles by allowing the filling of ventricles, before they thrust the blood through the lungs and peripheral circulation. The fibers of this specialized conducting system have the capability of self-excitation, a process that cause an automatic rhythmical discharge and the subsequent contraction. The fibers of the sinoatrial (SA) node exhibit this capability in largest extent and, therefore, the SA node normally controls the rate of contractions of the complete heart. Particularly, the fibers of SA node contract
Physiological background
and the generated impulses subsequently propagate through the heart. After the depolarization, the cell exhibits a refractory period and no excitation can occur. At the end of the refractory period, the SA node is again the first to self-excite, and for this reason, the SA node is responsible for the of contractions of the heart. The fibers of SA node trigger an action potential that propagates rapidly through both atria and from there through the His (or atrioventricular- AV) bundle into the ventricles. The His bundle is the one that mainly delays the transmission of action potentials from the atria into the ventricles, by allowing time for the atria to empty their contents into the ventricles before ventricular contraction begins. Fig. 1.5 shows an illustration of the conduction path of action potentials through the heart. The distal part of His bundle passes downward in the ventricular septum and splits into two branches (left and right bundle). Each branch spreads downward to the apex of the ventricle, by progressively splitting into smaller branches that spread around each ventricular chamber and back towards the base of the heart. In addition, each part of His bundle ends with Purkinje fibers that become continuous with the cardiac muscle fibers. These fibers have characteristics quite opposite of those of the AV node. In order to allow all ventricular muscle fibers to contract almost simultaneously, the cardiac impulse has to appear at each muscle fiber at approximately the same time. For this reason, the Purkinje fibers are relatively large fibers that transmit the action potentials at velocities about six times larger than transmission velocities in cardiac muscle fibers.
Anatomy of the fetal heart: differences with respect to the adult heart
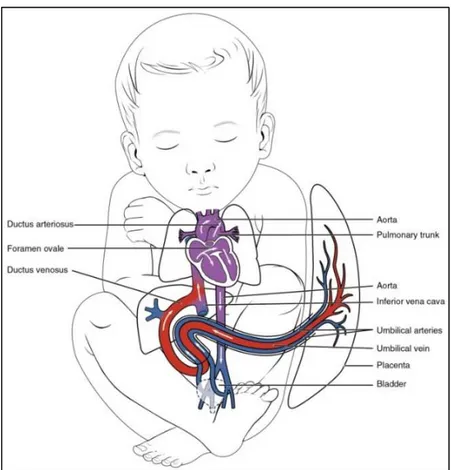
Relative to the adult heart, the physiology and anatomy of the fetal heart exhibit some significant differences. These differences originate from the fact that the fetal cardiovascular circulation is different from the adult circulation [20-22] (see Fig. 1.6). In the adult, gas exchange (i.e. the secretion of carbon-dioxide from the blood and the input of oxygen in the blood) takes place in the lungs [19]. From the lungs, the oxygenized blood flows through the left part of the heart into the peripheral circulation. Since this peripheral circulation is larger than the pulmonary circulation, the left ventricle has to generate a substantially higher pressure than the right ventricle to ensure sufficient perfusion to the organs. Consequently, the muscular mass of the left ventricle is larger than the mass of the right ventricle. In the fetus, gas exchange takes place in the placenta [23]. As a result, the fetal blood circulation works differently from the adult. First of all, the left and right parts of the fetal heart are connected by the foramen ovale and ductus arteriosus (see Fig. 1.6). The foramen ovale is a gap in the septum that divide both sides of the heart, while the
Physiological background
ductus arteriosus is a switching between the pulmonary artery and the aorta. Because of these interconnections, the left and right ventricles both generate the same pressure. However, in the fetal circulation, the right ventricle is responsible for about 60% of the total cardiac output whereas the left ventricle responds for the remaining 40% [20]. As a result of this higher output, the right ventricle of the fetal heart has a muscular mass exceeding that of the left ventricle.
Fig. 1.5. Basic anatomy of the human adult heart with the main components of the action potential conduction system indicated.
1.2 Origin of the electrocardiographic signal
Cardiac activity at cellular level
At rest, the potential of the intracellular fluid is negative with respect to the potential of the extracellular fluid [19]. This is caused by the different concentrations of Na+, K+, and
Ca2+ across the cell membrane. When an action potential propagates along the cell, this
action potential causes an increase in the Na+ permeability of the membrane.
Physiological background
the potential of the intracellular fluid with respect to the potential of the extracellular fluid. The cell is then depolarized. Besides the increase in Na+ permeability, the propagation of the action potential also causes an increase in the K+ and Ca
2+ permeability. These
permeability increases force the K+ ions to flow from the interior of the cell to the
extracellular fluid and force the Ca2+ ions to flow from the exterior to the intracellular
fluid. However, the increase in K+ and Ca
2+ permeability arises more gradually than the
increase in Na+ permeability. In addition, Ca
2+ permeability decreases earlier than K+
permeability. Thus, the intracellular potential first rapidly increases to positive values due
Fig. 1.6. Basic anatomy of the human fetal heart with the main differences with respect to the adult heart.
to the Na+ inflow. Subsequently, the potential remains at a plateau for a short while due to the inflow of Ca2+ and outflow of K+ ions. Finally, the potential returns to its rest value
due to the persisting outflow of K+ ions. Thus, the cell is repolarized. In fact, towards the end of the plateau, K+ permeability increases to also ensure a rapid return to the rest potential. It should be noted that only cardiac cells behave as descripted above. Moreover,
Physiological background
also the nodal cells, which are responsible for the self-excitation of the heart behave differently [19]. Generally, propagation of the electrical impulses from cell to cell can occur in passive or active way. Passive propagation consists of the electrical conduction of impulses that are too small to cause the depolarization of the cell. In this case, the cells work as a coaxial wire that conducts the impulse but gradually reduces the impulse amplitude due to leakage currents to the cell membrane. Instead, active propagation occurs without degradation of the impulse amplitude because the depolarization of a particular cell causes an impulse in the adjacent cell that starts the depolarization of cell.
Cardiac activity at tissue level
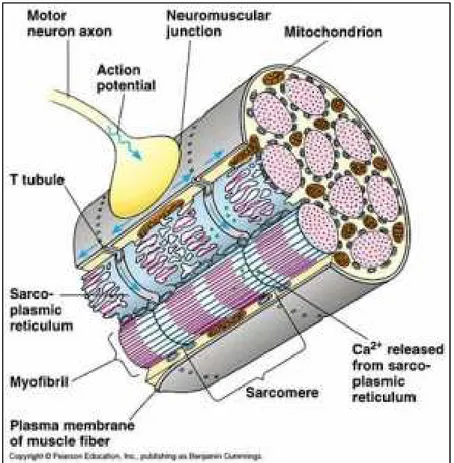
Next to effects at the cellular level, the propagation of the action potential has also effects at the tissue level. Indeed, the contraction of the heart needs to be converted to mechanical activity. This conversion is accomplished in two steps: 1) the electrical impulse starts a chemical process that 2) in turn starts the mechanical activity [19]. The propagation of the action potential causes the release of large quantities of Ca2+ ions from the sarcoplasmic
reticulum into the myofibrils (see Fig. 1.7). Then, the attractive forces between the actin and myosin filaments are involved by causing the scrolling of these filaments on themselves. This is the actual contraction of the muscle. Besides this mechanical effect, the propagation of the action potentials also has an electrical effect on the tissue. As mentioned before, the depolarization of a particular cell causes a potential difference compared to the adjacent cells that are not yet depolarized. Consequently, the border between a depolarized cell and a cell at rest acts as a dipole. Moreover, as the action potentials rather uniformly propagate through the cardiac tissue, adjacent fibers virtually simultaneously depolarize; and thus, the depolarization wave travels through the heart.
Cardiac activity at cutaneous level
In general, the tissues surrounding the traveling dipole are conductive, and the depolarization wave acts as a source of circular current. These currents spread in all the body surface and the skin impedance causes potential differences [24]. As the depolarization wave travels through the cardiac tissues, the potential at a specific position on the skin is not constant but varies with the traveling dipole. The representation of the skin potential as a function of time is called the ECG signal and can be measured by positioning electrodes on the skin [19].
Physiological background
1.3 Characteristics of the electrocardiographic signal
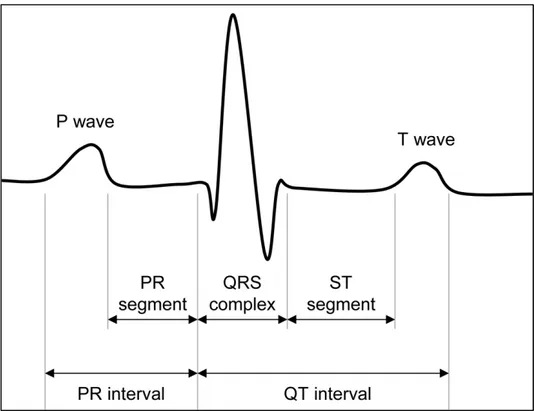
The ECG is a representation of the skin potential as a function of time. Indeed, the use of the word “potential” is not completely correct in this context because ECG generally constitutes a representation of the potential difference between two electrodes [19]. ECG can be described by means of a few characteristic waves (P, Q, R, S, T, and eventually U), which are associated with specific physiological events; segments (PR and ST) and intervals (PR and QT) between these waves. Fig. 1.8 shows an example of a typical ECG signal. Particularly, the P-wave is associated with the depolarization of the atria [19]. When the atria are completely depolarized, the electrical field generated by the traveling dipole is zero and the ECG consequently has zero amplitude. This isoelectrical period lasts until the action potential has propagated through the AV bundle to the Purkinje fibers and,
Physiological background
in the signal, is represented by PR interval. QRS complex is associated with ventricular depolarization. The amplitude of QRS complex exceeds the amplitude of P-wave drastically because the amount of muscle fibers in the ventricular walls is much larger than the amount of muscle fibers in the atrial walls. The reason for this is that the ventricles pump the blood into the peripheral circulation whereas the atria pump the blood only into the ventricles. As a result of this and because the atrial repolarization coincides with the ventricular depolarization, the repolarization of the atria cannot be distinguished in ECG. After that the ventricles are completely depolarized, the electrical field is again zero and the ECG has zero amplitude. The repolarization wave of the ventricles propagates in the opposite direction to the depolarization wave and is represented in the signal by T-wave. Because of the reversed propagation direction and the inversion of the signs in the resulting depolarization wave, T-wave has the same polarity of the QRS complex. Besides as the aforementioned potential-difference between two electrodes, ECG can also be considered as the projection of the electrical field generated by the traveling dipole in the lead vector that describes the positions of the involved electrodes with respect to one another [25]. Thus, it can be said that ECG is a one-dimensional projection of the three-dimensional electrical field generated by the traveling dipole.
Physiological background
Cardiac vector
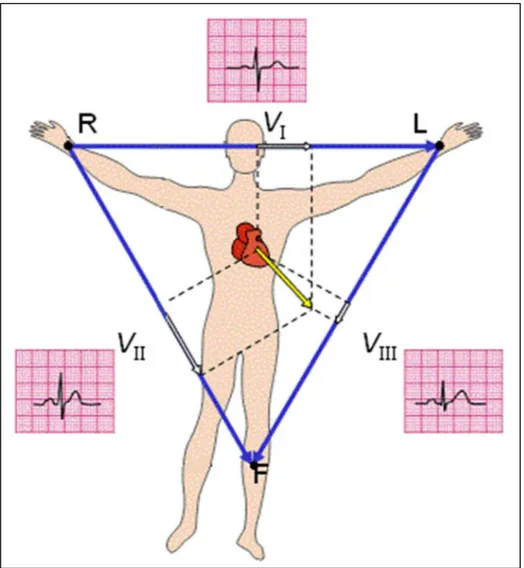
The traveling dipole produces a varying electrical field in the heart, which a first approximation can be described by a single vector: the cardiac vector [25,26]. When the orientation of the cardiac vector on the cutaneous level is perpendicular to the lead vector between two electrodes, both these electrodes measure the same electrical field amplitude and hence the bipolar ECG amplitude is zero. In other words, the projection of the cardiac vector into the lead vector determines the instantaneous ECG amplitude. This is illustrated in Fig. 1.9, in which the three vectors composing the triangle are the lead vectors and the amplitude of the ECG is determined by the amplitude of the projection of instantaneous cardiac vector into these lead vectors [27]. In addition, this relation between the electrical field, the lead vector, and the ECG amplitude implies that the varying electrical field can be used to describe the ECG at the body surface. Consequently, one of the main interests in fECG monitoring is the description of this electrical field vector over time: the fetal vectocardiogram (VCG) [28]. Generally, the fetal VCG is the three-dimensional representation of the time-path of the cardiac vector during one cardiac cycle [29]. Fig. 1.9 shows a two-dimensional illustration of the fetal VCG. In fact, this represents a simplification of the actual physiology. As the cardiac vector originates from the dipole wave, the origin of the vector travels with this wave through the heart. In the simplification used in the definition of the fetal VCG, however, the origin of the cardiac vector remains stationary [30]. In general, the fetal VCG consists of three closed loops associated with atrial depolarization, ventricular depolarization, and ventricular repolarization [28]. The ventricular depolarization loop (the largest of these loops) exhibits one particular direction for which the cardiac vector has maximum amplitude. This direction is referred to as the electrical axis of the heart or the main heart axis [19]. For adults, the main heart axis is on average tilted 57° with respect to the transverse plane, i.e. approximately corresponding to the direction from the right shoulder to the left ankle (Einthoven lead II), but deviations from -30° to 90° are considered normal [19].
1.4 Characteristics of the fetal electrocardiographic signal
The fetal heart is among the first organs that develop in the fetus and, after 7 weeks of gestation [5], is characterized by an anatomic conformation similar to that of an adult heart (four cameras, two atria and two ventricles) [14]. Consequently, from a
Physiological background
morphological point of view, fetuses and adults have rather similar ECG signals containing the same basic waves: P wave, associated to atrial depolarization; QRS complex, associated to ventricular depolarization; and T wave, associated to ventricular repolarization. Still, the mechanical function of the fetal heart differs from that of the adult heart because of some structural differences required by a different blood circulation in the prenatal period. After birth, the left ventricle pumps blood into the body for delivering oxygen whereas the right ventricle pumps blood into the lungs for acquiring oxygen. As above said, in the fetus the oxygen is supplied by the placenta [31] and therefore blood is not pumped into the lungs for this purpose. Both ventricles pump blood throughout the body (including the lungs). Particularly, the left ventricle supplies blood to the heart itself and to brain, whereas the right one to all the inferior parts of the body. The cardiac output
Fig. 1.9. Two-dimensional illustration of the vectocardiogram (VCG, in yellow) and the instantaneous projection of the cardiac vector.
Physiological background
of the right ventricle is greater than that of the left ventricle and this yields an abundance of cardiac muscle in the right part of the fetal heart. Thus, in the fetus the cardiac electrical axis is direct toward the right ventricle [14], whereas in the adult it points toward the left ventricle (which is the ventricle with the largest mass [22]). Consequently, the fetal VCG, which is the vector that indicates the magnitude and direction of the electrical forces generated by the heart during one complete cycle [31]) is oriented differently from the adult VCG, and each fECG representation (which is the projection of the fetal VCG into the appropriate lead vector) differs from the corresponding adult ECG representation [31].
Clinical Information from fetal electrocardiographic signal
Several clinical evaluations, not necessarily directly related to the fetal heart, can be derived from the analysis of the fECG signal. Several parameters of the fECG complex can be associated with the fetal condition [5,31] and below the most common ones are reported. For instance, the dimensions of the fetal heart and hence the size of the fetus can be estimated from the lengths of the intervals in the ECG, while also indications for fetal oxygen deficiency can be discerned.
Fetal Growth Parameters
Intrauterine growth restriction (IUGR) refers to poor growth of a fetus in the mother's womb during pregnancy. In this pathological state, the fetus is at risk of hypoxia [1], condition which is associated with increased perinatal morbidity and mortality and consequently, the IUGR represents a major problem in the perinatal medicine. Since the fECG provides information about fetal growth rate and oxygenation [1], it can also be used for IUGR assessment. In the fECG signal, the P-wave duration and the QRS complex duration indicate the time needed for atrial and ventricular depolarization, respectively. Such intervals are determined by both the size of the cardiac muscle and the conduction speed of the action potentials. Hypothesizing the latter to be constant, each wave has a duration that depends on the dimension of the related cardiac rooms. As the heart grows proportionally to the fetus, both the P wave duration and the QRS-complex duration can be used to estimate the size of the fetal heart [5,31] and, consequently, to assess the presence of IUGR.
Supraventricular Arrhythmias
Supraventricular extrasystoles (SVES) are heartbeats that originate in the nodal cells of the ventricles rather than in the SA node [19]. In the fECG signal, the occurrence of SVES
Physiological background
is shown with a widened QRS complex of opposite sign, while the P-wave, representing contraction of the atria, is absent. In most cases, SVES are sporadic and innocent and hence not relevant for fetal monitoring [5,31]. However, in the cases in which SVES are due to congenital heart diseases (like the supraventricular tachycardia, bradycardia or premature atrial contractions [32,33], fECG visualization could become of vital importance. since permits timely detection of the congenital fetal heart disease and its treatment during pregnancy or immediately after birth.
ST Segment Variability
The capability of the fetal heart to distribute the blood to the body depends on the critical balance between energy production and energy consumption. Normally, the availability of oxygen exceeds its request, and the fetal heart utilizes aerobic (i.e., oxygen dependent) metabolism to generate energy. In this case, the energetic balance is positive and the fECG morphology is normal. On the contrary, if the available amount of oxygen decreases and the requested amount persists, the energy balance becomes negative and myocardial hypoxian emerges [34]. In the fECG, the effect of myocardial hypoxia is commonly reflected in a morphological change of the ST segment, which becomes elevated or depressed (the Cochrane Library provides a support to interpret fetal ST waveform [35]). The fetus responds to the negative energy balance by suddenly increasing adrenalin to start glycogenolysis, a process in which stored glucose is utilized for generating energy. Changes in the ST segment will then indirectly reflect the fetal capacity of metabolic compensation [5,31].
Fetal Movements
Maternal perception of fetal movements is the oldest and most commonly used method to assess the well-being of the fetus starting from the 20th week of gestation [36]. At first, the
fetal movements are weary and infrequent, but in the second half of pregnancy, they become stronger, more frequent, and increasingly linked to fetal heart-rate patterns and fetal eye movements, and identify fetal behavioral states that are indicators of maturity and integrity of the fetal nervous system [5,31]. Severe and sustained reductions of fetal movements indicate fetal distress, often preceding fetal death. Fetal movements only temporally influence the morphology of the fECG, whereas fetal distress, which associates to a sustained decrease of fetal movements, causes prolonged variations of the fECG, in particular of the ST segment. Abnormalities in the ST segment persisting for longer than
Physiological background
15 seconds have been associated to critical fetal states, whereas shorter episodes to the fetal movements.
All the parameters discussed above illustrate that fECG monitoring can have added value compared to the electronic fetal monitoring. Not only the fetal heart rate (HR) can be assessed more accurately and more reliably, but also the fetal growth, fetal oxygenation and fetal movement parameters provide information about fetal distress. This raises the question why fECG monitoring has not been used as a standard in clinical practice since many years. One of the answers to this question is the lack of signal acquisition and processing techniques that enable determination of the fECG with sufficient accuracy and reliability in all stages of pregnancy.
Non-invasive fetal electrocardiography
Chapter 2
Non-invasive
fetal electrocardiography
In this chapter, a brief overview of the fECG monitoring (invasive and non-invasive fECG) is provided with special emphasis on clinical applicability of the non-invasive fECG and analysis problems related to this signal.
2.1 Introduction to fetal cardiac monitoring: cardiotocography and
invasive fetal electrocardiography
The assessment of procedures for accurately monitoring the fetal cardiac activity has always occupied a prominent role in the biomedical research because of its importance in safeguarding the life and the health of the unborn child. Indeed, congenital fetal heart defects are among the most common birth defects and the leading cause of birth deaths [2]. Moreover, several pathologies and complications, even not directly linked to the fetus heart, such as fetal hypoxia (a deprivation of an adequate supply oxygen that, if prolonged, can lead to irreversible neurological diseases), show abnormalities in the cardiac activity as side effect [3,7]. Premature diagnosis of such cardiac defects and activity abnormalities during pregnancy may allow the treatment of the pathologies in the early stages of the fetus development and may prevent a permanent disease or, in the worst cases, a fatal outcome [3]. The idea that fetal heart rate could be used to determine fetal well-being was first proposed by Killian in the 1600’s [37], but it remained unnoticed until 1818 when Mayor and Kergaradec described the method of auscultating fetal heart sounds by placing the ear next to the maternal abdomen [37]. Later, Kergaradec further suggested that fetal heart sounds could be used to determine fetal viability and life [38]. In 1833, Evory Kennedy, an English physician, published a textbook on Obstetric Auscultation, mentioning the possible correlation between fetal heart rate patterns and fetal health, and
Non-invasive fetal electrocardiography
recommended auscultation of the fetal heart rate as a tool of intrapartum monitoring [39]. Improvements of such technique lead to use an acoustic sensor, the fetal stethoscope or fetoscope, capable to capture the beating activity of the fetal heart valves opening and closing [37]. This technique remained practically unchanged until the advent of electronic fetal monitoring, that has its origin in 1906, when Cremer first attempted recording of the fECG by using silver electrodes positioned on the abdomen and vagina and connected to the galvanometric apparatus [38].
Nowadays two techniques are mostly used for fetal cardiac monitoring: the CTG and the invasive (or direct) fECG. CTG consists of simultaneous recordings performed by two separate transducers, an ultrasonic sensor, that continuously emits ultrasound and detects motion of the fetal heart by the characteristic of the reflected sound, and a pressure transducer, that provides information on the uterine contractions. Although the transducers can be either external or internal, CTG is usually performed in a noninvasive fashion, with the two sensors strapped to the mother abdominal wall. For what concerns fetal cardiac monitoring, the CTG provides information regarding the fetal heart rhythm, including baseline heart-rate and heart-rate variability, accelerations, decelerations and trends. When first introduced, this practice, which became almost universal for hospital births, was expected to reduce the incidence of fetal demise in labor and cause a reduction in cerebral palsy. Still, in recent years there has been some controversy as to the utility of the CTG in low-risk pregnancies, and the related belief that over-reliance on the test has led to increased misdiagnoses of fetal distress and hence increased (and possibly unnecessary) cesarean deliveries [4]. The 4th annual Confidential Inquiry into Stillbirths and Deaths in Infancy analyzed intrapartum deaths due to asphyxia in babies weighting more than 1500 gr (Maternal and Child Health Research Consortium Confidential Enquiry into Stillbirths and Deaths in Infancy, 4th annual report 1997 CEMACH, London). The inquiry reported that the interpretation of the CTG component of obstetric care was questionable in more than 50% of deaths. This is not entirely surprising as the clinical algorithm directing interpretation of fetal heart-rate records is largely based on empirical observations of recordings in human labor. Large intra- and inter- observed differences in CTG interpretation are well-recognized even among experts [39]. In many cases of birth asphyxia, retrospective review demonstrates the ambiguity of CTG leading to a failure to recognize fetal distress. Analysis of such cases has led several countries to recommend that all staff involved in intrapartum care should receive regular training in CTG
Non-invasive fetal electrocardiography
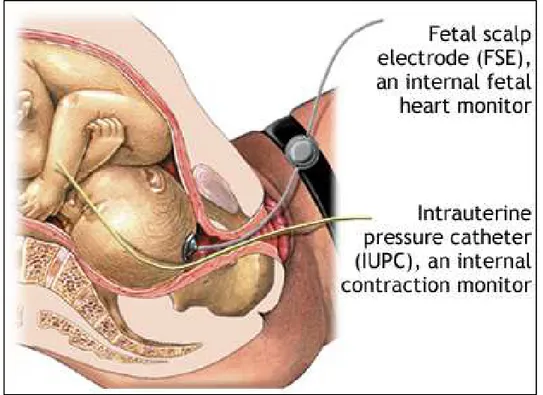
interpretation. Invasive fECG is the second most common technique for fetal cardiac monitoring, principally used in the USA. It consists of a recording of the electrical activity of the fetal heart through the insertion of the spiral electrode on the fetal scalp (see Fig. 2.1), and thus, its applicability is limited only to the labor, because the insertion of the electrode requires the chorioamniotic membranes to be ruptured and a sufficient dilatation of the uterine cervix. Also, the presence of monitoring instrumentation in the uterine cavity penetrating the fetal skin may cause infection and fetal injury. However, compared to the CTG, invasive fECG provides much more information on heart health state since the signal morphology reflects all the phases of the fetal cardiac cycle and not only the heart rate. Indeed, in case of labor at risk, invasive fECG can be combined with the CTG, and thus we talk about “STAN” monitor [40-44]: a monitor that analyzes ST segment of the fECG and, in combination with CTG, can
Fig. 2.1. Electrodes configuration for invasive fECG: insertion of the spiral electrode on the fetal scalp
be used to assess fetal hypoxia [45]. Unfortunately, STAN can only be applied during labor since it’s based on the invasively recorded fECG. Thus, in case of fetus that suffers of asphyxia before dilatation, ST analysis (evaluated by STAN) does not assess the fetal
Non-invasive fetal electrocardiography
condition correctly [40]. Generally, CTG should lead to a correct diagnosis and subsequent intervention by the physician. However, if ST analysis has already started, this potentially results in an earlier diagnosis. Then, combined with the fact that ST segment alone cannot discriminate between sustained asphyxia and normal oxygen levels [46], this address the need for a non-invasive method to record the fECG.
2.2 Non-invasive fetal electrocardiography
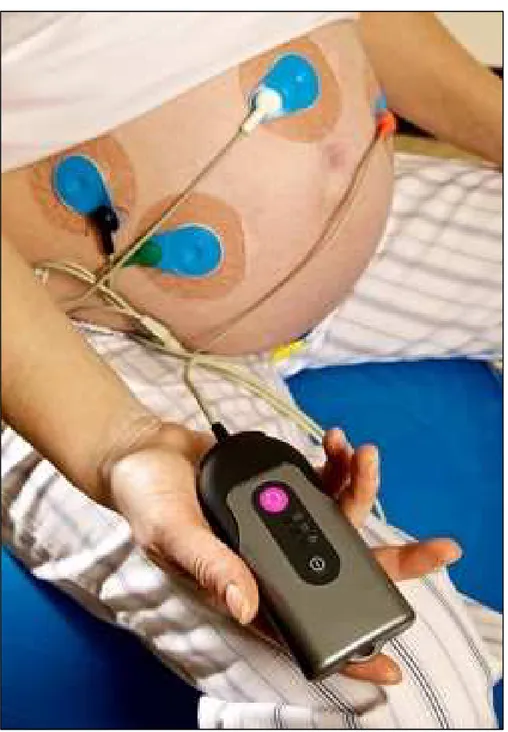
Non-invasive (or indirect) fECG was first attempted in 1958 by Hon [47]. It represents an alternative technique to the invasive fECG for overcoming its invasivity-related limitations. It consists of the recording of the fetal-heart electrical activity by means of electrodes positioned on the maternal abdomen [48] starting from the 37th week of gestation (see Fig. 2.2). The feature of non-invasiveness makes this kind of fECG recording a potentially promising method in the field of prenatal diagnostics. However, the abdominal measured signals include a mixture of electrophysiological signals (mostly maternal ECG but also maternal and fetal electromyograms, fetal electroencephalogram, movement artifacts) and noise. Consequently, the signal-to-noise ratio of these recordings is quite low, and detection, processing and interpretation of the non-invasive fECG are very challenging tasks. Despite has been known for over 40 years and, during these years, the several efforts to improve the signal to noise ratio of the recording [14], the non-invasive fECG technique has not yet reached reliability sufficient to be used in daily clinical practice and is still a current research topic among physicians and biomedical engineers.
Electrodes features
The non-invasive fECG signal is obtained by applying electrodes on the pregnant-woman abdomen, thus representing the interface between the woman body and the electronic measuring apparatus. Such electrodes derive the electrophysiological signal by transforming, through chemical reactions, the ionic currents (which flow in the body) in electronic currents (used by measurement electronic instruments). In order for this conversion to happen, the sensors are constituted by a metal in contact with a salt solution. The passage of electric current from the body to an electrode can be understood by considering the electrode-electrolyte interface, with the electrolyte that represents the body fluid containing ions. Then, a net current crosses the interface passing from the electrod to
Non-invasive fetal electrocardiography
the electrolyte. Electrodes can be ideally classified in perfectly polarizable or perfectly non-polarizable, depending on what happens when a current passes the electrode-electrolyte interface. When a current is applied to perfectly polarizable electrodes, no actual charge crosses the electrode–electrolyte interface. Then, the current across the interface is a displacement current, and the electrode behaves as a capacitor. Instead, when a current is applied to perfectly non-polarizable electrodes, this passes freely across
Fig. 2.2. Electrodes configuration for the non-invasive fECG: positioning the electrodes on the maternal abdomen
Non-invasive fetal electrocardiography
the electrode–electrolyte interface requiring no energy to make the transition. Thus, there are no overpotentials. Clearly, real electrodes can only approximate these two ideal types of electrodes [49,50]. For example, the silver/silver chloride (Ag/AgCl) electrode, widely used in electrocardiography, approaches the characteristics of a perfectly non-polarizable electrode [50] and represents a good compromise between the quality of the recorded signal and cost. Because the biopotentials are recorded from the skin surface, the sensor-skin interface has also to be taken into account. When applying an electrode on the sensor-skin, a transparent electrolyte gel containing Cl- is generally used to maintain a good contact and reduce the impact of the skin on the impedance by making its dry outer layer ion conductive [51]. Moreover, the skin area under the electrode must be slightly abraded (through the cotton imbued with abrasive paste) to remove the most superficial stratum of the skin, i.e. the stratum corneum, that is poorly conductive. Thus, the contact impedance between the sensor and the skin is minimized and the recorded signal quality is optimized.
Electrode configurations
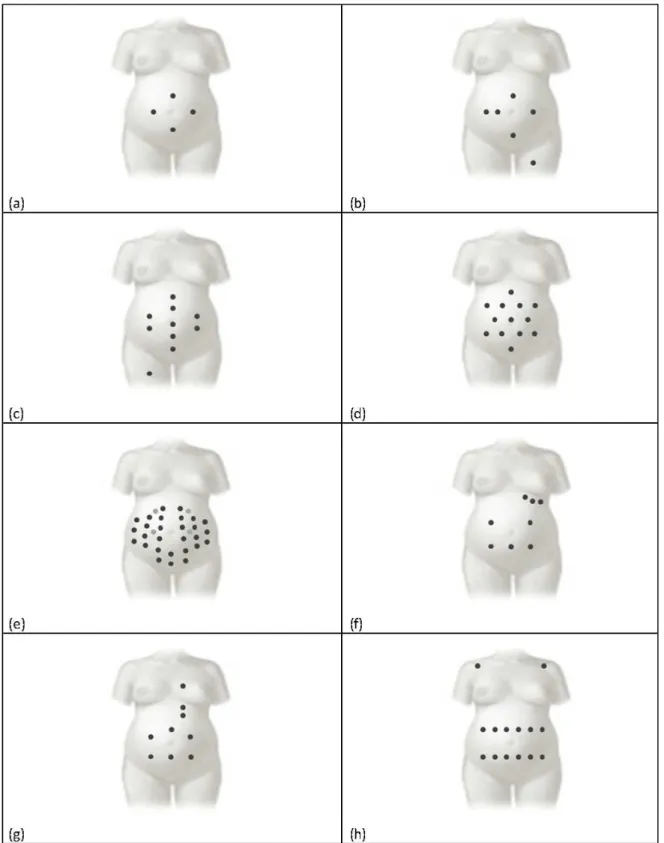
In abdominal recordings for non-invasive fECG, the signal morphology depends not only on electrodes placement, but also on fetus position. Consequently, definition of an optimal electrodes location is not possible [49], even though some different configurations have been proposed in literature in the attempt to standardize the recording procedures (see below) [5]. Globally, electrode configurations for non-invasive fECG recordings can be grouped into two classes: pure abdominal configurations and mixed configurations (see Fig. 2.3). Differently from the former, the latter also provide pure maternal ECG tracings.
Pure abdominal electrode configurations
Configuration with four electrodes. According to this configuration proposed by Karvounis et al. [52], signals are acquired using four electrodes placed on the mother’s abdomen [53-55]: the common electrode is located on the symphysis pubis while the other three are positioned in a crescent fashion around the navel (to the left, above and to the right of the navel), as to making a cross whose central point is the navel itself (Fig. 2.3 panel a). Configuration with six electrodes. In 2012 Jezewski et al. [55] proposed to locate six electrodes: three aligned on the navel (two to the right and one to the left), one placed above the navel, a reference one on the pubic symphysis, and a common mode reference one, with activeground signal, on the left thigh (Fig. 2.3 panel b). This configuration represents a variation to the original configuration proposed in 1981 by Bergveld and Meijer [56,57], in which one electrode is positioned on the back instead that on the thigh.
Non-invasive fetal electrocardiography
Fig. 2.3. Electrode configurations for abdominal recordings. Pure abdominal configurations consider four (panel a), six, (panel b), ten (panel c), thirteen (panel d) and thirty-two (panel e) electrodes, respectively. Instead mixed configurations consider eight (panel f), nine (panel g) and fourteen (panel f) electrodes [5].
Non-invasive fetal electrocardiography
Configuration with ten electrodes. This configuration, proposed by Marossero et al. [58], considers ten electrodes displaced as follows: four electrodes are vertically aligned at the center of the maternal abdomen (two above and two under the navel), two couples of electrodes are applied on the right and on the left of the line identified by the previous four, the reference electrode is placed at the abdomen center near the navel, and the ground electrode is located on the right thigh (Fig. 2.3 panel c).
Configuration with thirteen electrodes. Martens et al. [59] proposed an electrode 6-pointed star configuration characterized by the placement of 13 abdominal unipolar electrodes (Fig. 2.3 panel d). The average of all potential recorded by each electrode is considered as the common reference.
Configuration with thirty-two electrodes. This configuration, proposed by G. Clifford et al. [60], consists of a set of 32 abdominal electrodes placed on basis of anatomic landmarks (the navel, xiphoid process, pubic symphysis, axilla, and spine) to allow for an excellent coverage of the maternal abdomen, sides, and back (Fig. 2.3 panel e).
Mixed electrode configurations
Mixed configuration with eight electrodes. This configuration, presented by A. Mahmoud et al. [61], considers eight electrodes, of which five are abdominal (three around the navel and two in line with it), and three thoracic (on the left side, under the udder; Fig. 2.3 panel f) [62]. Abdominal electrode records a noisy mixture of maternal and fECG signals, while the thoracic ones detect the pure maternal ECG.
Mixed configuration with nine electrodes. Sameni et al. [63] proposed a configuration which includes nine electrodes, six abdominal ones located around the navel, and three thoracic ones vertically aligned in correspondence to the maternal heart (one above and two under the heart; Fig. 2.3 panel g).
Mixed configuration with fourteen electrodes. This 14-electrode configuration proposed by Vullings et al. [64] considers positioning 12 electrodes in two horizontal lines on the maternal abdomen, respectively under and above the navel, and one electrode on each maternal shoulder (Fig. 2.3 panel h).
Abdominal signals recorded on the maternal abdomen
From a mathematical point of view, each lead of the recording (aLead) obtained placing the electrodes on the abdomen of a pregnant woman after the 37th week of gestation can be seen as a summation of three signal components: fECG (fECG), abdominal maternal ECG (amECG), and noise (aNoise) [5]:
Non-invasive fetal electrocardiography
= + + . (2.1)
The fECG represents the signal of interest. Theoretically it is characterized by a frequency band between 0.5 Hz and 100 Hz (as shown in Fig. 2.4 [31]), even though a bandwidth of 0.5-45 Hz results usually enough for most practical applications [65-67]. Fetal QRS-complex amplitude is strongly dependent on analyzed lead, gestational age and fetus position. Typically, it does not overcome 60 μV. The amECG is the most predominant interference in the aLead. It is characterized by a frequency bandwidth similar to the one characterizing the fECG, but its amplitude can be up to 10 times higher (as shown in Fig. 2.5 [31]). Typically, maternal QRS complexes reach 100-150 μV of amplitude. Eventually, aNoise is a mixture of interferences that can or cannot have a physiological origin. It can be further decomposed in low-frequency noise (lfNoise), inband noise (ibNoise), and high-frequency noise (hfNoise): the lfNoise, characterized by a high-frequency band between 0 and 0.5 Hz, typically includes baseline drifts and wandering due to respiration; instead the hfNoise includes interferences that are characterized by frequency components wide above 40 Hz (till few hundreds of Hz) such as the powerline grid (50 Hz or 60 Hz), activity from the uterus and abdominal muscle activity (up to 200 Hz), and others. Eventually, ibNoise is characterized by all those noise frequency components that fall into the fECG bandwidth, and thus are the most difficult to be eliminated.
Physiological interferences
As the maternal body acts as a conductor, several other electrophysiological signals that do not originate from the fetus are recorded by electrodes [28]. Besides the amECG, these interferences include the electrohysterogram (EHG, i.e. activity from the uterus) [68,69], and electromyogram (EMG, i.e. abdominal muscle activity), as shown in Fig. 2.5. The EHG has a frequency content ranging from 0 Hz to approximately 3 Hz [70], whereas the EMG exhibits frequencies ranging from 0 Hz to 200 Hz [71]. These interferences (also with the amECG) already show the difficulty of fECG extraction and hence explain the wide range of techniques proposed to achieve this extraction.
Non-physiological interferences
Although many non-physiological interferences exist, such as imperfections in the analog-digital converter of the recording equipment, the non-physiological interferences are dominated by the powerline [72]. The interference from the powerline is centered around
Non-invasive fetal electrocardiography
50 Hz (in Italy) with harmonics at multiples of 50 Hz and can be suppressed from the composite signal by a combination of notch filters with fixed cutoff frequencies [72].
Fig. 2.4 Frequency content of both fECG and amECG (the dip around 50 Hz is due to a notch filter to suppress the powerline interference) [31].
Fig. 2.5 Segment of composite abdominal fECG recording. The contribution of the EHG is reflected by wandering of the baseline. This baseline wander is emphasized by the additionally drawn dashed arc [31].
Non-invasive fetal electrocardiography
Volume conductor interference
In addition to the signals that corrupt the fECG in aLead, fECG analysis is complicated for another reason as well. Changes in the volume conductor between the fetal heart (on the one hand) and the abdominal electrodes (on the other hand) can distort or attenuate/amplify the fECG [73-76]. In general, these changes originate from movement of the fetus, development of the vernix caseosa [74,77], and the movement of the mother. As previously says, fetal movement is reflected in fECG as spatially correlated changes in the morphology of fECG waveform. In terms of the fetal VCG, movement of the fetus is reflected as a rotation of the VCG. However, fetal movement not only causes the fetal VCG rotation with respect to the electrode configuration on the maternal abdomen, but it also causes changes in the distance between the fetal heart and electrodes [78]. In case of electrophysiological-signals conduction (from the fetal heart to the maternal abdominal surface) not uniform, changes in distance cause both distortion and attenuation/amplification of fECG [74,76]. In case of uniform conduction, only attenuation or amplification of fECG signal is expected. Particularly, in case the fetal movement causes the decrease of distance between the heart and a particular electrode, amplification of the corresponding fECG is expected. Conversely, attenuation of fECG is caused by an increase in the heart-electrode distance. From about 28th week of gestation, the fetus develops a protective layer called the vernix caseosa [74,77,79,80]. The vernix caseosa isolates the fetus electrically from its surroundings, making virtually impossible to record a fECG on the maternal abdomen. However, from about 32th week of gestation this protective layer starts to break down, partly canceling the isolated environment and thus restoring the possibility to record fECG signal. As a consequence of this collapse of vernix caseosa, new conduction paths for the electrical signals arise [77]. These conduction paths represent a transition from uniform conduction before 28 weeks of gestation to non-uniform conduction after 32 weeks of gestation, significantly affecting non-invasive fECG recording [28]. After about 37th week of gestation, the vernix caseosa dissolves in the
amniotic fluid restoring the uniform conduction characteristics of the volume conductor [74]. Thus, we can say that the limitations in fECG analysis due to fetal movement and non-uniformity of the volume conductor are mainly expected between 28th and 37th week of
gestation. Another change in the volume conductor that causes fECG-signal distortions recorded on maternal abdomen is caused by fetal breathing. By filling its lungs with amniotic fluid [81], the fetus changes the impedance of conduction path from its heart to
Non-invasive fetal electrocardiography
the abdominal electrodes, affecting the recorded fECG signal. A last cause of changes in the volume conductor is the movement of the electrodes, resulting from movement of the mother. Movement of the electrodes causes the conductive layer between the skin and the electrodes to change and hence causes a change in the properties of the volume conductor. This conductive layer is generated by the thermal excitation of metallic ions in the electrode. These ions spread through the electrolyte, forming a layer balancing the electrode charge. Although the ions can move freely through the electrolyte, the speed of movement is limited and hence electrode movement is likely to disturb the electrode-skin bias [82], resulting in artifacts in the recorded fECG.
Automatic extraction of fetal electrocardiographic signal
Automatic extraction of fECG from aLead usually includes three main steps [5]: aLead prefiltration and amECG cancellation [82] (Fig. 2.6), as described below. Prefiltration of the aLead signal is usually performed in a linear fashion by application of a bandpass (0.5-45 Hz) filter. Such filter, indeed, can be seen as a cascade of a high-pass filter (cutoff: 0.5Hz) and a low-pass filter (cutoff: 45 Hz) which are finalized at attenuating lfNoise and hfNoise, respectively. The resulting filtered signal (faLead; Fig. 2.6) [5] is then composed by fECG, amECG, and ibNoise:
= + +
(2.2)
Usually ibNoise cannot be neglected. Typically, at most one or very few leads of a multilead recording show a signal-to-noise ratio sufficiently good (i.e., an ibNoise level sufficiently low) for a successful fECG extraction.
Several automatic procedures for fECG extraction from faLead involve amECG cancellation (see Fig. 2.6) [5]. Since the frequency bands of fECG and amECG are strongly overlapped so that linear filtering cannot be applied for their separation, but further processing techniques are required. Thus, fECG is mathematically represented by a subtraction between faLead and amECG, and the process may or may not involve amECG estimation:
Non-invasive fetal electrocardiography
Overview on fECG extraction procedures
Many techniques have been proposed for the extraction of fECG. If pure abdominal electrode configurations are used, the extraction of fECG can occur directly from faLead by means of linear [62,83-87] or nonlinear [88-90] decomposition techniques, among which the independent component analysis (ICA) [62] is the most commonly used, or by template subtraction [57,91]. Instead, if mixed electrode configuration are used, fECG can be extracted using adaptive filtering that, in addition to faLead, also uses the mECG recorded by the electrodes located in the woman thorax or shoulder [92,93]. A detailed description of each single technique reported in literature is very hard to report here. Consequently, only technical hints of the most commonly used technique will be provided.
Fig. 2.6 Automatic fECG extraction from an abdominal recording (aLead) consisting in an initial prefiltration and subsequent maternal ECG (amECG) cancellation [5].
Independent component analysis
ICA [5] is a blind source separation technique that can be used for fECG extraction under the hypothesis of statistical independence of fECG and amECG. The ICA can be applied in case of multi-lead abdominal recording, and works under the assumption that the signals from different leads are linear combinations of the independent source signals generated by the maternal heart and fetal heart [62]. To separate the various source signals, the so called separating matrix S is used:
Non-invasive fetal electrocardiography
where fECG and faLead are matrices containing fECG signals and faLead signals of all available leads. ICA finds the independent components by maximizing the statistical independence of the estimated components. The higher the number of available abdominal recordings, the better fECG extraction is. However, recording a large number of channels makes the procedure difficult to apply and not comfortable to the pregnant woman. Consequently, the clinical use of such approach is limited.
Template subtraction
The suppression of amECG by template subtraction [5], which can be applied to a single-lead abdominal recording, uses the repeatability of maternal ECG beats to obtain fECG [56]. The maternal beat is assumed to be an amplitude-scaled version of a common ECG beat waveform, and is called template. Maternal heart rate is hypothesized constant during the registration, so that all beats are characterized by the same length (which matches the length of the template). The calculation of the template is directly possible from the faLead, and involves various signal processing steps [91]. First, the maternal R peaks are identified using, for example, the Pan-Tompkins’ procedure [94] combined with a threshold criteria finalized to distinguish maternal R peaks from fetal R peaks. Then, the segmentation of each maternal beat is accomplished in order to have the corresponding PQRST complexes which are, in the most classic approaches, averaged to get the template [56]. More rarely, the template is computed from all segmented beats using particular adaptive filters [95]. After calculation of the template, each maternal ECG beat is estimated by synchronizing and amplitude-scaling the template to the maternal beat identified in the faLead. This process can include a cross-correlation optimization. After estimation of all maternal beats, they can be concatenated to provide and estimation of amECG signal [56].
Adaptive Filtering
The extended Kalman filter [92], an extension of standard Kalman filter [96] to nonlinear systems, is usually used to perform an adaptive filtering for fECG extraction [5]. Then, the extraction of fECG from faLead with adaptive filtering needs two measurements: a primary input, represented by faLead, which contains the signal of interest and the disturbing interference (amECG), and a secondary input, represented by mECG, highly correlated with amECG. The transformation of mECG into amECG can be determined minimizing the mean square error between the primary input faLead and mECG [92]. Using neural network is another technique for adaptively extracting fECG from faLead
![Fig. 1.1 . The fetus and its heart in the early stages of development [14].](https://thumb-eu.123doks.com/thumbv2/123dokorg/2968811.27135/9.892.170.749.249.590/fig-fetus-heart-early-stages-development.webp)
![Fig. 1.2 . Development of the fetal heart during gestation in chronological order (from a to f) [14]](https://thumb-eu.123doks.com/thumbv2/123dokorg/2968811.27135/10.892.169.747.283.596/fig-development-fetal-heart-gestation-chronological-order-f.webp)