1
POLITECNICO DI MILANO
SCHOOL OF CIVIL, ENVIRONMENTAL AND LAND MANAGEMENT ENGINEERING MASTER OF SCIENCE IN CIVIL ENGINEERING FOR RISK MITIGATION
A WebGIS prototype to show the impact of the Grand Ethiopian Renaissance Dam on Egypt fresh water availability
Supervisor:
Professor Daniela Carrion
Master Thesis By:
Nevin Mustafa Abuelela Ibrahim Mohamed
3
Contents
Acknowledgements ... 6 Abstract ... 7 Sommario ... 8 Introduction ... 9Egypt, Grand Ethiopian Renaissance Dam (GERD) and Nile River, current situation and what is predicted ... 11
1- Introduction: ... 11
2- Nile River, the current situation and current hazards: ... 11
3- The Grand Ethiopian Renaissance Dam (GERD): ... 15
3-1- Side effects of the construction of the Grand Ethiopian Renaissance Dam in the Downstream territory: ... 16
4- Current water situation in Egypt: ... 17
4-1- Water resources in Egypt and water shortage: ... 17
4-2- Water demand in Egypt: ... 19
4-3- The most critical regions that will be affected by the water shortage: ... 20
4-3-1- The High Aswan Dam and lake Nasser: ... 21
4-3-2- Toshka lakes and Toshka valley: ... 22
4-3-3- The Delta region on the downstream of the Nile current situation and potential hazards: ... 23
5- The filling scenarios of the Grand Ethiopian Renaissance Dam reservoir: ... 25
Remote sensing data processing to monitor changes in water and vegetation presence over time ... 34
1- Introduction: ... 34
1-1- Landsat imagery for earth observation ... 34
1-2- Landsat 7 ... 35
1-2-1- Solving the SLC problem using ArcGIS software: ... 37
1-3- Convert the Digital Number (DN) to Top of Atmosphere (TOA) reflectance: ... 39
1-4- Clouds: ... 43
2- Indices for vegetation and moisture monitoring ... 44
2-1- the Normalized Difference Vegetation Index (NDVI)... 44
2-2- The Normalized Difference Water Index (NDWI): ... 45
2-3- The Normalized Difference Moisture Index (NDMI): ... 45
3- Satellite data processing to show the impact of the GERD on the downstream territory ... 47
4
3-2- Data Analysis: ... 49
1-1- The Normalized Difference Vegetation Index (NDVI): ... 50
1-2- The Normalized Difference Water Index (NDWI): ... 52
1-3- The Normalized Difference Moisture Index (NDWI): ... 54
Design and prototype implementation of a WebGIS to show the situation before and after the Dam construction. ... 57
1- Introduction ... 57
1-1- What is WebGIS? ... 57
1-3-3- Medium client architecture ... 67
1-3-4- Distributed Architecture ... 68
1-4- The Web-based platform used in this study (GeoNode) ... 69
1-4-1- Architecture of GeoNode Components ... 69
2- Methodology ... 71
2-1-1- The Conceptual Model (Entity Relationship Diagram) ... 71
2-2- Preparing layers and documents to be added to the prototype WebGIS “GeoNode” ... 75
2-3 Installation of GeoNode ... 75
2-3-1- Uploading layers, Documents and Creating Maps ... 76
a- Uploaded layers ... 76
b- Uploading Documents: ... 80
c- Producing Maps ... 81
An example of map showing how the impact of the Grand Ethiopian Renaissance Dam (GERD) on the Downstream country could be assessed through the GeoNode Platform ... 82
2-2-3- Analysis performed on the map: ... 83
1- Query Applied to Vector Data: ... 83
2- Analysis applied to Raster Data: ... 84
Conclusion ... 86
References: ... 88
6
Acknowledgements
Firstly, I would like to thank my supervisor, Professor Daniela Carrion for her effort, patience, guidance and support, without her effort, this thesis could not be completed in this organized way. She was always available for my questions and to guide me on the right way to complete this thesis.
Secondly, I would like to thank Professor Nader Noureldeen Mohamed, professor of land Reclamation and water resources, Faculty of Agriculture, Cairo University for the valuable researches that he sent to me and which I used in the first chapter of my thesis.
Thirdly, I would like to thank my friends who gave me support to continue working to finish this thesis and who helped me with their valuable advices
Finally, I would like to thank my family and my mother who were always helping me and supporting me from the beginning of my life.
7 Abstract
The objective of this study is to share information with the public about the impact of the Grand Ethiopian Renaissance Dam (GERD) on Egypt, which is the downstream country of the Nile River and which depends on its water as for 95%. The study is divided into three parts, the first one is a literature review about the impact of the construction and reservoir filling of the GERD on Egypt.
The second part is the presentation of the remote sensing analysis which was performed to monitor the current situation in the Delta region and which can be used to assess the changes during the filling and operation period of the dam. Landsat 7 ETM+ satellite images were processed to determine the Normalized Difference Vegetation Index, the Normalized Difference Water Index and the Normalized difference Moisture Index. These indices provide information about the vegetation health, moisture and water presence.
Then, a prototype design and implementation was performed on the WebGIS GeoNode platform to share the impact of the GERD on Egypt territory with the public. The Entity Relatioship Diagram of the WebGIS has been designed, with the layers necessary to the user to be able to monitor the situation. The layers which are included in the prototype consist of 2 vector layers, 24 raster layers, 3 documents and 24 figures, illustrating the situation from 2011 to 2018, the predicted scenarios of the filling period of the GERD Reservoir and the predicted scenarios of the long term effect after the filling period of the GERD reservoir. Styling was performed in Geonode, and queries were foreseen to help the user exploit the system.
8 Sommario
L'obiettivo di questo studio è quello di condividere informazioni con il pubblico sull'impatto della grande diga dell'Etiopia (Grand Ethiopian Renaissance Dam, GERD) in Egitto, Paese a valle del fiume Nilo che dipende dalle sue acque per il 95%. Lo studio è diviso in tre parti, la prima è una revisione della letteratura sull'impatto della costruzione e del riempimento del bacino idrico della GERD in Egitto.
La seconda parte è la presentazione delle analisi di immagini telerilevate che è stata eseguita per monitorare la situazione attuale nella regione del Delta e che può essere utilizzata per valutare i cambiamenti durante il periodo di riempimento e funzionamento della diga. Immagini satellitari Landsat 7 ETM + sono state elaborate per determinare l'indice di vegetazione (Normalized Difference Vegetation Index, NDVI), di contenuto d’acqua (Normalized Difference Water Index, NDWI) e di umidità (Normalized difference Moisture Index, NDMI). Questi indici forniscono informazioni sulla salute della vegetazione, umidità e presenza di acqua sul territorio.
Infine, un prototipo di WebGIS è stato progettato e implementato nella piattaforma GeoNode, per condividere l'impatto della GERD sul territorio egiziano con il pubblico. Il Diagramma Entità Relazioni del WebGIS è stato progettato, con gli strati informativi necessari all'utente per essere in grado di monitorare la situazione. Gli strati informativi inclusi nel prototipo sono costituiti da 2 layer vettoriali, 24 layer raster, 3 documenti e 24 figure, che illustrano la situazione dal 2011 al 2018, gli scenari previsti nel periodo di riempimento del bacino della GERD e gli scenari previsti dell’effetto a lungo termine. E’ stato definito lo stile degli strati informativi in Geonode e sono state previste delle query per aiutare l'utente a sfruttare il sistema.
9
Introduction
Nile River is considered the source of life to the Egyptian People, in the past, the ancient Egyptians built their civilization around the Nile River bank, and till now, the Nile river is the main source of fresh water to the Egyptian people, it gives about 95% if the fresh water resources in the country of Egypt. The Nile river water in the Egyptian land (the Downstream) is coming from two sources, the first one and the most important one is the Ethiopian high land, which share a seasonal flow of about 85% of the water in the Downstream through the Blue Nile branch of the Nile River. In 2011 Ethiopia announced the start of the construction of the Grand Ethiopian Renaissance Dam (GERD) to Produce Electricity for their people. From that date, the Egyptian people have fears about the future of their main water resource as long as the Ethiopian Authority did not announce any mission of how this dam will affect the water going to the downstream specially in the filling period of the GERD Reservoir which it is predicted to start in December 2020 (Mohamed, 2018).
This study’s objective is to show the impact of the GERD in the Downstream territory to the public with a WebGIS, which collects published information and satellite image processed data, which can allow the monitoring of the effect of the water availability over the territory.
The current situation of the vegetation cover and of moisture and water has been explored to better understand the situation before the start of the GERD reservoir filling using the remote sensing technology. Landsat 7 ETM+ satellite images were processed to obtain the values if the Normalized Difference Vegetation Index (NDVI), the Normalized Difference Water index (NDWI), and the Normalized Difference Moisture Index (NDMI) in the Delta region in the Downstream of the Nile River. In addition, the same procedure can be applied in the future, to monitor these indices during and after the filling period of the dam.
Sharing Geo-information with public is now possible because of the WebGIS technology, in this study the GeoNode portal was used to design a prototype to share the information regarding the impact of the GERD on the downstream territory of Egypt.
10
This study is composed by three parts:
1- The overview of the impact of the GERD on the downstream territory based on published researches and of the situation of the downstream territory before the filling of the GERD reservoir.
2- The monitoring of the change of the vegetation, moisture and water from the year of 2011 till the year of 2018 using the remote sensing technology by getting the NDVI, NDWI, NDMI.
3- A prototype of the WebGIS using the GeoNode platform was designed to share the obtained data with the public.
11
Egypt, Grand Ethiopian Renaissance Dam (GERD) and Nile River, current situation and what is predicted
1- Introduction:
This chapter is collecting information about the impact of the Grand Ethiopian Renaissance Dam on the downstream territory of Egypt, including information about the Nile River, the Grand Ethiopian Renaissance Dam. In addition, the Nature of the Downstream territory now, before the filling period of the GERD’s Reservoir, during and after that is analyzed through scientific literature.
2- Nile River, the current situation and current hazards:
Nile river is located in the western part of Africa continent and it is the longest river in the world. The Nile Basin covers an area of 3.18 million km2, nearly 10% of the
African continent (Mohamed, 2017). The Nile Basin is divided into two sub basins. The first one is the Eastern Nile sub basin or Ethiopian Highland which provides the downstream with fresh water through the Blue Nile river which is the eastern part of the river, sharing 85% of the total Nile water. The Eastern Nile sub basin is considered as seasonal steady flow during the summer and autumn months (June– November). The second sub basin includes the Great Equatorial lakes which share only 15% of Nile’s water which is transported to the downstream territory through the White Nile river with steady flow over the year (Mohamed, 2017). Figure 1 shows the Nile river basin and shared countries.
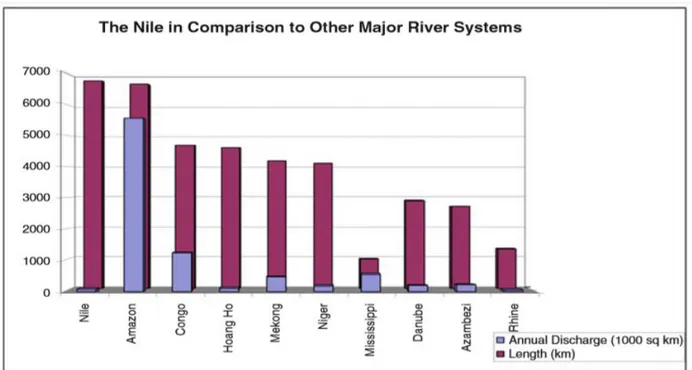
Although the Nile river is the Longest river in the world, it has a very short amount of water in comparison to the other long rivers in the world. Figure 2 shows the histogram of the longest rivers in the world with the water shared percentage.
12
Figure 1 the Nile river basin (Whittington,et al, 2006)
13
Figure 2 the Annual Discharge of the longest rivers in the world
(source: International Rivers; people, water. Life. https://www.internationalrivers.org/)
As seen in figure 2, the water share in the Nile River is very small in comparison to the other long rivers like Amazon River which share about 20% of the global fresh water.
As a result, there is a problem of water scarcity in Africa, the whole continent shares only 9% of the fresh water in the world for about 15% of the global population (Mohamed, 2017). According to a study made in 1996 by the United Nations Environment Program (UNEP) the northern part of Africa will face a crisis in water scarcity by the year of 2025 (Karyabwite, 1999). Table 1 shows the distribution of the international renewable fresh water for each continent in the world and Figure 3 shows a map of water availability in Africa.
14
Table 1 Distribution of international renewable freshwater (Mohamed, 2016)
15
3- The Grand Ethiopian Renaissance Dam (GERD):
The Grand Ethiopian Renaissance Dam (GERD) is considered the largest dam in Africa and one of the 10 largest dams in the world. It is located on the Blue Nile River immediately upstream of Sudanese border in the Benishangul-Gumuz Region of Ethiopia, with a catchment area of nearly 200,000 km2 and a storage capacity of
74 billion cubic meters height of 50 meters and a power plant capacity of 6000 MW. During the year of 2011, Ethiopia announced about the decision of building a new dam in the Nile River to produce electricity for the Ethiopian people. In the year 2014 the Ethiopian authority started building the Dam and the plan was to finish constructing it by 2017 (Mohamed, 2017, Ibrahim, 2017), but according to some problems happened in the construction process, the final construction time was postponed 4 years later. The first turbine will be operated by December 2020 so, the start of reservoir filling is also in the year of 2020 which could be the beginning of water scarcity period in Egypt.
According to Wheeler K. G. et al. (2016) another aspect that could worry the downstream people is that the US Bureau of Reclamation (1964) conducted a study on behalf of the government of Ethiopia that identified four potential dam sites on the Blue Nile, including one which has now become the location of the GERD. This means that the GERD could be the first of a series of four dams that could lead to an environmental disaster in the future because the four dams need more time to fill their reservoir which means additional time of fresh water scarcity in Egypt. This could damage the agriculture in Egypt and also could severely affect the environmental balance which could also lead to emigration of people to other countries in the world.
The construction of the grand Ethiopian Renaissance Dam (GERD) will have a negative impact on the water resources of Egypt, especially during the period of the filing of the dam reservoir (Ibrahim, 2017). There is no exact information from the Ethiopian Authority about the water percentage reduction for the Nile River in the downstream of the GERD. The Egyptian Authority has some fears about the Dam volume and if there will be a plan to build more dams as written in the US Bureau of Reclamation study (1964). In fact, in that study, there is a plan to build four dams on the Nile River and the GERD is one of them. The Nile river water is considered as 95% of the fresh water resources in Egypt (El-nashar et al, 2017) and
16
that means that any reduction of the Nile river water share from the Egyptian side will have a huge negative impact on the economy, in other words, the downstream territory is too much vulnerable to any reduction of water.
This study is collecting some data about the predicted impact (positive and negative impact of the construction of the Grand Ethiopian Renaissance Dam (GERD)) on the downstream territory of Egypt. The GERD reservoir filling period has not been agreed yet among the riparian territories of the Blue Nile river (Egypt, Sudan and Ethiopia).
3-1- Side effects of the construction of the Grand Ethiopian Renaissance Dam in the Downstream territory:
▪ Enabling Ethiopia to fully control the Blue Nile revenue will reduce the electricity production of the High Aswan Dam (HAD) and its Reservoir by 20%. The Nile flow into Egypt could be cut by 12-25% during the filling period; ▪ Destruction of a huge number of acres of agricultural area;
▪ Reduction of cultivated irrigated pelvic area.
▪ Decrement of the water level in the Nile and branches and canals which will affect the navigation and Nile cruises;
▪ Increment of the Environmental degradation an, pollution and an imbalance in the natural system of life in North Lakes due to Water shortage;
▪ Increment in sea water intrusion in coastal aquifers in North Delta;
▪ Threaten to Groundwater quality and increased salinity in these reservoirs; ▪ Land reclamation programs in Egypt will be affected like Toshka project,
Toshka project is a land reclamation project was started in the toshka Area and irrigated by Lake Nasser over capacity water that goes to the toshka lakes this is illustrated in section 4-3-2;
▪ Decrement in the generating of energy from the High Asswan Dam, which may be as high as between 20 and 40%. In other studies, between 10 to 20% which is also considered a great percentage of reduction;
▪ Increment in hazard, in case of collapse of the dam, the flowing water will sink Sudanese cities, especially Khartoum. (Ibrahim, 2017).
17
4- Current water situation in Egypt:
4-1- Water resources in Egypt and water shortage:
One of the most difficult challenges in Egypt is the fully dependency on the water from the Nile river: the Egyptian share from the Nile is about 55.5 billion cubic meters (BCM) with population more than 100 Million people. According to that percentage there is already a problem of water shortage in Egypt because the
person share of water is less than 1000 m3. According to the dry climate of Egypt
there is no rainfall water considered to be used, average rainfall in Egypt is estimated at 1.8 BCM per year (Ibrahim, 2017). Egypt has four different groundwater aquifers: the Nile Aquifer, the Nubian Sandstone Aquifer, the Moghra Aquifer and the Coastal Aquifer (Ibrahim, 2017). The underground water represents less than 5% of the water usage in Egypt, given that it is nonrenewable water resource, people cannot depend on it. The first aquifer contains groundwater in the Nile Valley and Delta region. The second aquifer category is located in the “Western Desert-Nubian Sandstone Aquifer”. Non-renewable groundwater utilization is estimated at a rate of 1.65 Billion m3 /year (BCM/year). It is mostly located at the Western Desert Oases with 0.5 BCM/yr. On the other side, the groundwater abstractions in Delta, Sinai and New Valley regions is about 5.1 BCM/yr. It is estimated that about 200,000 BCM of fresh water are stored in the New Valley's Oasis aquifer only. The water is at the depth of 60-100 m around the area of East-Oweinat. In Sinai, groundwater is mainly encountered in three different water bearing aquifers (Abdel-Shafy et al, 2016). Figure 4 represents the location of the groundwater aquifers in Egypt and figure 5 represents the portion of water from the Nile River and the main usage of it. Table 2 shows the different water resources in 2005 in Egypt, the table shows that the main resource of water is the Nile River portion of water, about 55.5 BCM/year, and the second source is the recycled water from the agriculture non-reclaimed drainage water, about 7.5 BCM/year. The ground water portion (nonrenewable resource of water) is about 0.9 BCM/year and the rainfall water is about 1.3 BCM/year.
18
Table 2 water resources in Egypt in the Year of 2005 (Mohamed, 2018)
19
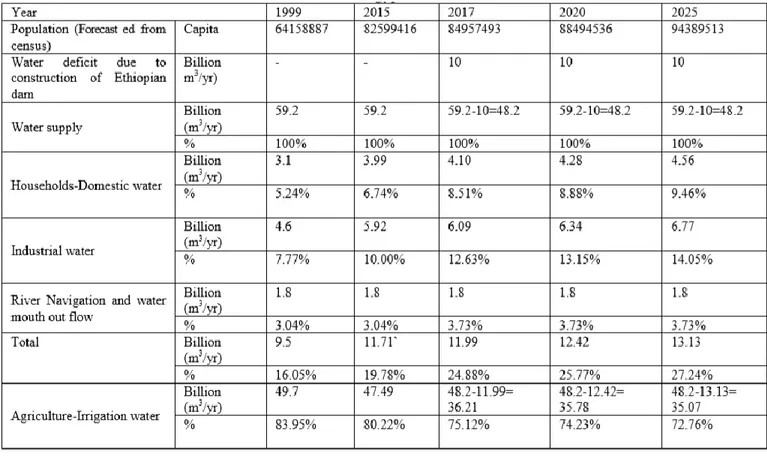
4-2- Water demand in Egypt:
Water in Egypt is used mainly in agriculture, industry and domestic uses, according to Ibrahim (2017) the forecasting water demand from the year of 1999 till the year of 2025 is illustrated in table 3. Ibrahim (2017) assumed t the downstream share of Nile River will be facing about 10 BCM constant reduction from the year of 2017 till the year of 2025. This cannot be very accurate because the water reduction will not correspond to a constant rate and the filling of the GERD reservoir has been postponed to the year of 2020. However, the Ibrahim study is still useful because it summarizes the water demand classified as house hold use, industrial water, river Navigation and agriculture.
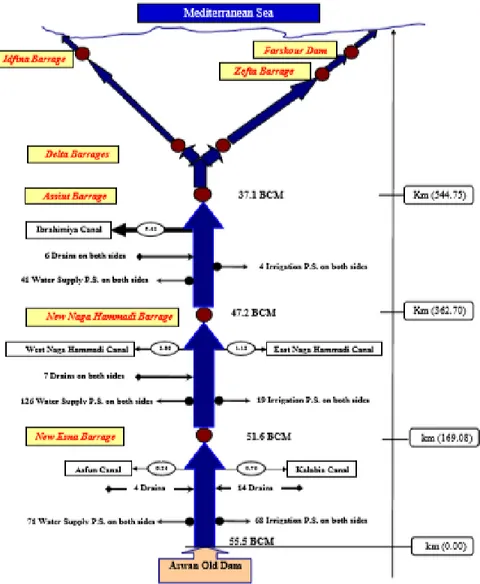
20
Figure 5 Nile river reaches in Egypt, (Abdelhaleem, et al, 2015)
4-3- The most critical regions that will be affected by the water shortage:
There is no doubt that the water shortage will affect the whole downstream region, but this study concerns about the main affected zones by the water crises. One of these regions is the southern part of Egypt where there is the High dam in Aswan and lake Nasser, where the water shortage may result in a reduction on the electricity production from the Aswan High Dam. Also, the so called Toshka Valley will be affected, where there are the four Toshka artificial lakes which were constructed to reach more than the full capacity of Lake Nasser, when its level rises. After the construction of the GERD, the water share of Nile River will be less and
21
there will be no chance for Lake Nasser to reach its full capacity, so a project like Toshka Valley will be threatened by water shortage. The other territory which will be severely affected by the water shortage is the northern part of the Nile River, where there is the Delta region. It is one of the oldest Deltas in the world which is already threatened by the salinization of the sea water from the Mediterranean sea and soil degradation. These threats will be discussed in the following sections.
4-3-1- The High Aswan Dam and lake Nasser:
The High Aswan Dam (HAD) was built between 1960 and 1970 in order to control the flow of the Nile River and also to produce hydro power energy. The HAD is a multipurpose project for sustainable irrigation development, hydropower and navigation improvement. There is no doubt that the HAD is the cornerstone for Egypt’s sustainable agricultural plans and many other developments (Abu-Zeid et al, 1997).
The High Aswan Dam (HAD) was constructed on the River Nile, 7 km south of Aswan. Its type is a rockfill dam with grout curtain and clay core. Its total length is 3600 m and its height 111 m above the river bed. The storage capacity of its lake is
162 km3. The HAD is equipped with hydropower plant with installed capacity of 2.1
million MW and power generation of 10 000 MkWh yearly. Its hydropower station capacity is 109 kWh per year. The main goals of the construction of the High Aswan
Dam can be summarized as written in Abu-Zeid et al (1997) research: ▪ full control of the Nile flow at Aswan in the far south of Egypt;
▪ regulation of the discharge downstream of the dam to match the actual water needs for different requirements;
▪ protection of the Nile Valley and Delta from high floods and drought hazards that could persist for several consecutive years;
▪ generation of cheap and clean hydroelectric power;
▪ realization of horizontal land expansion by reclaiming new lands;
▪ change in the system of basin irrigation (one crop per year), to perennial irrigation (two or more crops per year);
▪ expansion in rice and sugar-cane cultivation to limit imports; ▪ improvement of navigation through the Nile and navigable canals;
▪ realization of great flexibility in agricultural planning, crop patterns and intensified agriculture (Abu-Zeid et al, 1997).
22
The artificial lake Nasser extends from southern Egypt to northern Sudan and has a surface area of 5,248 km2 and a total volume capacity of 162.3 km3. This capacity
varies depending on the extent of the annual flood upstream. Although approximately 84 BCM flow each year to Lake Nasser in Egypt, heavy use of the lake’s waters means that only about 0.4 BCM reaches the Mediterranean Sea. (Mohamed, 2017).
So, it is predicted a Reduction of the electricity production of the High Dam and Aswan Reservoir by 20%, water shortage in the river with an average of 10 billion cubic meters and the Nile flow into Egypt could be cut by 12-25% during the filling period (Ibrahim, 2017). In addition, this will increase the concentration of water pollution and will affect negatively the fishing heritage in the Nile river downstream.
4-3-2- Toshka lakes and Toshka valley:
Toshka Region is located southwest of Aswan, about 1,000 km south of Cairo. The Toshka Depression has an average diameter of 22 km which could receive the
overfloods that may reach the Aswan High Dam with a capacity of 120 billion m3.
Thus, Toshka lakes are a natural drain of Lake Nasser. Toshka, basically, is a free spillway discharging the water of Lake Nasser when it exceeds its highest storage level of 182 m. It is a 22-km long, manmade canal connecting Toshka Bay with the Toshka Depression and works as a safety valve for Lake Nasser, upstream of the High Dam. Toshka Canal is the main core of the Toshka Project. It is a new canal conveying excess water from Lake Nasser through a giant pumping station that elevates the water to flow through the canal to reclaim and irrigate 540 acres (Mohamed, 2018).
Figure 6 shows the situation of the Toshka valley and Toshka lakes in November 2018 and figure 7 shows the same area as a topographic map. The two maps show that the lakes have almost disappeared, there is only a small part of the first lake and this shortage of water happened before the start of the filling of the GERD reservoir. After the filling of the GERD reservoir, it is predicted that the water in Lake Nasser will not reach its full capacity for about 15 years and that means that the Toshka project will be damaged according to the lack of water in that area.
23
.
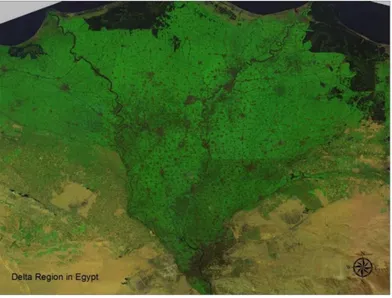
4-3-3- The Delta region on the downstream of the Nile current situation and potential hazards:
The Nile valley and delta region of Egypt are considered as the oldest agriculture land in the world. The delta region in the downstream of the Nile river suffers from the land degradation hazard. The cultivated area of the Nile Delta is 4.354 million feddan(1) about 93% of which are old dark lands of alluvial soils that have a texture
which ranges from heavy clayey to clay. This area represents 71.6% of the total old alluvial land in Egypt of 6 million feddan and 55.5% of the total officially cultivated lands of 8.6 million feddan including 2.6 million feddan in new reclaimed lands. Land degradation in the Nile Delta land includes salinity, alkalinity, soil compaction and nutrient depletion, water logging, pollution and contamination, seawater intrusion, and urban encroachment; these are considered the current hazards of the Delta region. There are three main sources of salt in the Nile Delta which are irrigation water, shallow water table, and Mediterranean seawater intrusion, and there is no initial salinity because the delta soils came from Ethiopia highland
(1)1 Feddan = 4,200.833 Square meters.
Figure 7 the location and current situation of Toshka lakes (satellite image taken in November 2018)
24
through the Nile water. The average of salt-affected soils in the North Delta is 46%, in the middle delta 36%, and in the south delta 24% with total average in the delta of 37%. Nile Delta soils have been formed through the Nile flooding by adding about 5 mm of Nile siltation layer/year. Nowadays, the delta soils lose a thickness of about 1 mm of soil layer/year. Along the Nile River, there is a total of 56 large drains discharging water and transporting pollutants from industrial and settlement areas and 72 drains discharging water mainly from agricultural areas. Officially, delta land reuses annually about 10 BCM of the agricultural drainage water from the total amount of agricultural drainage water (untreated and not reclaimed) that has a total volume of drainage water of 15 BCM. Including the unofficial reuse, it may reach 12 BCM, because the farmer is obliged to use agricultural drainage water due to the absence of fresh irrigation water especially in the farms that are located at the tail of the irrigation canal. The amounts of the reuse of drainage water have a huge contamination. Sprawl is one of the main problems that threaten the limited highly fertile land in the Nile Delta. Urbanization is an inevitable process due to progress and development. However, the encroachments of urban settlements on the expense of agricultural lands may pose dire consequences. It was estimated that land encroachment reached in 2008 about 720,000 feddan within 36 years. Therefore, changes of the land cover and the environmental impact of these changes should be carefully considered (Mohamed, 2016).
25
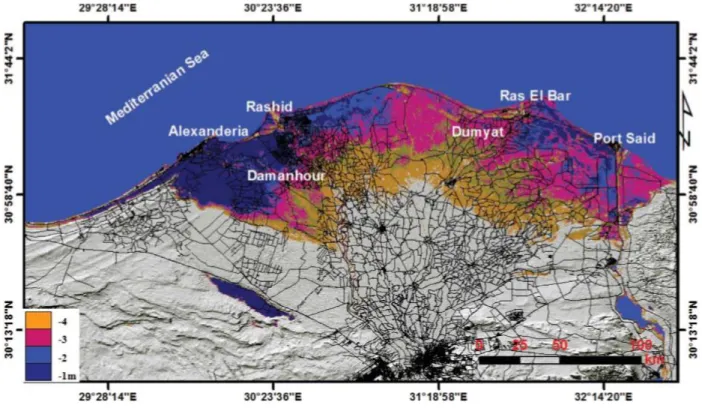
According to Mohamed et al. (2017) the building of the GERD will cause a reduction of the ground water table in the Delta region which will lead to increase of the sea water intrusion and this will depend on how much will be the decrement of the ground water table. In Mohamed et al (2017) study, four scenarios were made to measure the seawater intrusion of according to the decrease if the Ground Water level by 1m, 2m, 3m, 4m. Figure 9 shows the results of the seawater intrusion in the Delta region.
Figure 9 the sea water intrusion in the delta region according to the decrement of the ground water level by 1,2,3,4m
As shown in figure 9, the highest intrusion of the sea water in the delta region is according to a decrement of the ground water table by 4 meters. The left part of the Delta which includes Alexanderia, Rashid and damanhour can be affected by more intrusion of the sea water level than the right part where Dumyata, Ras El Bar, and Port Said are.
26
The filling period of the Grand Ethiopian renaissance dam reservoir is a crucial factor of the severity of the impact of water shortage in the downstream country.I The dam reservoir capacity is 74 billion cubic meters so if the GERD reservoir filling period was 3 years, the water shortage from the downstream countries could be about 24 billion cubic meters. This is more than 40% if the Egypt’s share of the water from the Nile, which could lead to a water shortage crisis in Egypt. To have a clearer vision of the effect of filling period of the GERD reservoir, in this study, more than one research has been taken into consideration to better understand the extent of the effect of the filling period of the dam reservoir.
The first study was done by Mohamed (2017) who mainly constructed 3 scenarios of the GERD reservoir filling period (3 years, 5 years, 5 years with a reduction of 0.5 BCM from the water share that could be used for the developing of the agriculture in Ethiopia and Sudan).
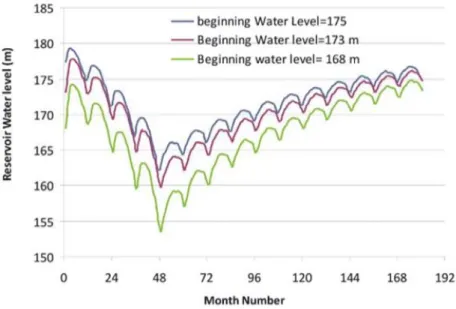
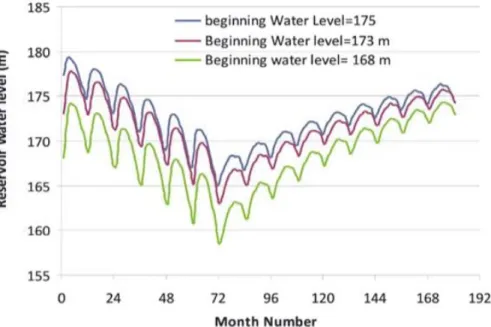
The first scenario is the three-year filling period: he considered that the initial water level in the Nasser lake is 175, 173or 168 m. Figure 10 shows his results as the effect of the three-year filling period of the GERD on the water level in Nasser lake. Figure 11 shows the effect of the five-year filling period of the GERD on the water level in Nasser lake.
27
As shown in figure 10 and 11, the minimum value of the water level in Nasser Lake is 162.138 m, 159.7 m and 153.4m for an initial level of Nasser lake of 175m, 173m and 168m respectively for the filling period of 3 years. It was increased to be Figure 12 the water level in Nasser lake according to 5 years filling scenario of the GERD reservoir (Mohamed, 2017)
Figure 11 the water level in Nasser lake according to 5 years filling scenario of the GERD reservoir and water shortage of Nasser lake of 0.5 BCM (Mohamed, 2017)
28
175.28, 174.66 and 173.29 by the end of routing period. There is no doubt that the 5 year filling period of the GERD reservoir gives a better result for the minimum water level in the HAD reservoir (Nasser Lake). There is another factor which could affect the water level in Nasser Lake: the irrigation Expansion in Ethiopia and Sudan. This factor was considered as 0.5 BCM of water shortage on Nasser lake yearly and figure 12 represents the behavior of Lake Nasser water level due to this factor. It is clear from figure 12 that the minimum water level could be less than 160 BCM and the water level will not return to the original water level before the consruction of the GERD.
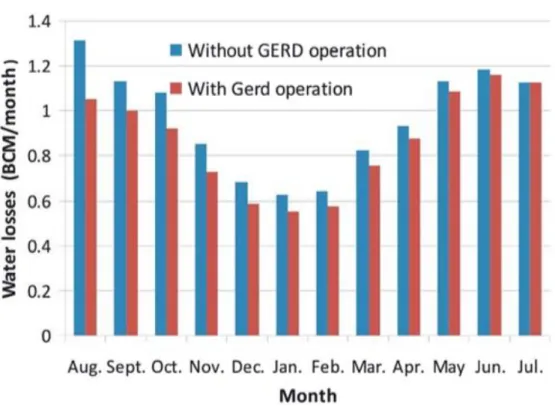
One of the good impacts of the GERD on Egypt is the reduction of the Evapouration lost from the lake Nasser but this reduction is not comparable to the reduction of the water level of Nasser lake shown before. Figure 13 shows the differences in the evapouration before and after the filling of the GERD reservoir.
Figure 13the Monthly water losses from Nasser Lake due to the Evaporation before and after the filling of the GERD (Mohamed, 2017)
The total amount of water losses due to evaporation from Nasser Lake for one year is about 11.523 BCM and after the filling of the GERD, the loss is reduced to be 8.376 BCM.
29
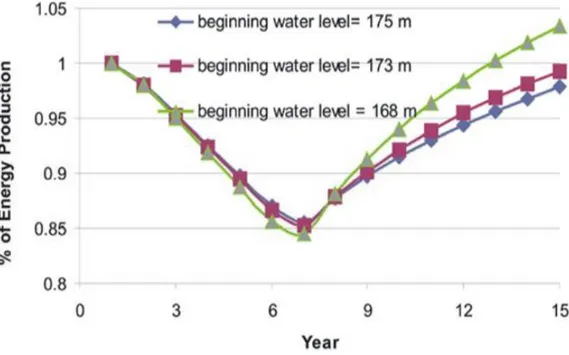
The hydropower generated from the High Aswan Dam (HAD) is proportioned to the head water level of the lake Nasser, so for the 5-year filling period scenario the hydropower generation is illustrated in figure 14.
Figure 14 The hydropower generation change due to the 5 years filling period of the GERD (Mohamed, 2017)
It is shown that the minimum level of the hydropower generation from the HAD is reached by the end of the filling period to be about 0.85 of the original value as a result of the reduction of the head water level on the Nasser Lake. Then, the curve increases gradually until it reaches its original value by the end of the routing period, which is 15 years.
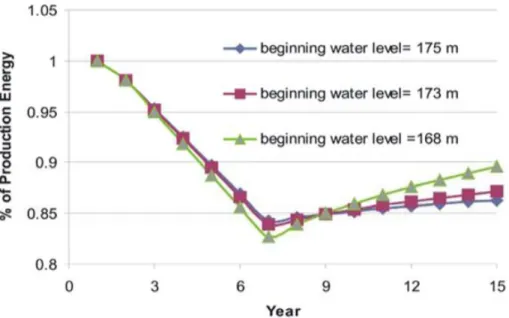
Figure 15 shows the hydropower generation of the Aswan High dam regarding to the 3rd scenario of 0.5 BCM yearly water shortage due to the agriculture Expansion
30
Figure 15 The hydropower generation change due to the 5 years filling period of the GERD and 0.5 BCM yearly water shortage
It is clear from figure 15 that the hydropower generation does not return to the original value before the filling of the GERD reservoir but it hardly reaches 0.9 of the original value 15 years after the filling period (Mohamed, 2017).
The second study was done by Wheeler et al. (2016). This study is comparing 4 main scenarios for a filling period of the GERD reservoir. It is not clear the number of years that will be taken to fill the dam reservoir, but the scenarios are based mainly on the presence of a HAD safeguard policy or not and also on the presence of the management of draught seasons between the GERD and the HAD. In other words, there are four scenarios describing the probability of occurrence of severe water shortage (water level will be below the minimum water level) in front of the HAD according to the filling of the GERD reservoir and the long term after the filling of the GERD on the HAD water shortage. These scenarios are listed below:
a- no HAD drought management policy and no GERD-HAD safeguard policy, b- HAD drought management policy and no GERD-HAD safeguard policy, c- no HAD drought management policy and GERD-HAD safeguard policy, d- HAD drought management policy and GERD-HAD safeguard policy.
Table 4 shows the result of this study, it is clear from the table that the lowest probability of severe water shortage in front of the HAD will occur when there is a
31
management of the drought season and a safe guard policy between the GERD and HAD policy (scenario 4) (Wheeler et al, 2016).
Table 4 the probability of occurrence of Severe water shortage in front of the HAD according to the filling of the GERD reservoir
The 3rd study was done by Tesfaye et al. (2016). It analyzed 3 scenarios, 5 years
filling period, 6 years filling period and 7 years filling period, and estimated from them the average percentage of power changes in Egypt, Sudan and Ethiopia. Table 5 illustrates the study results in terms of power generation change during the first 13 years from the start of the Dam reservoir.
32
Table 5 the average power changes in Egypt, Sudan and Ethiopiaduring the first 13 years after the start of the filling of the GERD reservoir
Then, the study estimated the losses of the agriculture depending on the Nile water which are mostly located in Egypt according to the 3 Scenarios of the filling of the GERD reservoir. Table 6 illustrates the losses of agriculture area due to the filling period scenario of the GERD reservoir.
34
Remote sensing data processing to monitor changes in water and vegetation presence over time
1- Introduction:
The remote sensing made it easy to get satellite images for anywhere in the world and provided with the possibility to make analyses on the satellite images that enable to get information about the changes of the Earth’s surface and about the environment. In this chapter, the analysis was performed to track the changes in the vegetation cover, moisture and water from the year of 2011 till the year of 2018, in order to understand the current situation in the downstream area (the Delta Region) of the Nile river. These analyses are mainly based on the calculation of the normalized difference vegetation index (NDVI), the Normalized difference water index (NDWI) and the Normalized Difference Moisture Index (NDMI). Also statistics on the results have been computed to understand the current situation about vegetation, moisture and water that exist in the downstream territory. In this study, Landsat images have been taken into account, because they are free of charge and becaouse of the availability of a long serie dating decades in the past. Of course, other satellite images could be used, such as Sentinel optical images, which are free as well, but which cover the most recent years.
1-1- Landsat imagery for earth observation
Remote sensing is widely used to monitor the environmental and land cover changes on the Earth. The Landsat satellite constellation has the longest history and major use for monitoring the earth surface from space. Since the first Landsat satellite in 1972, a series of progressively advanced multispectral imaging sensors, named TM—Thematic Mapper, have been included extending from Landsats 4 (1982), 5 (1984), 6 (1993, dispatch fizzled) to 7 (1999) (Enhanced Thematic Mapper Plus, ETM+).
The Landsat TM and ETM+ imaging sensors have recorded many images with an almost constant record of worldwide land surface data since its initiation. Landsat provides medium spatial resolution images. For example, Landsat ETM+ has a spatial resolution of 30 m for the multispectral bands and 60 m for the thermal infrared band. Since Landsat has a long history of data, it is extremely useful to
35
delineate the vegetation cover and to monitor the spatiotemporal vegetation changes.
The Landsat satellite instruments have taken millions of images. The images, which are archived in the United States and at Landsat receiving stations around the world are a resource for global change research and applications in agriculture, cartography, forestry, geology, regional planning, education and surveillance. These images can be viewed, for example, through the United States Geological
Survey USGS Earth explorer website (USGS, http://earthexplorer.usgs.gov/).
1-2- Landsat 7
Landsat 7 is a satellite from Nasa organization, which was launched from Vandenburg Air Force Base on April 15, 1999. It is designed for a 705 km with a 5000-pound class satellite, sun synchronous, orbit for earth mapping with a 16-day repeated cycle. Its payload is a single nadir pointing instrument, the Enhanced Thematic Mapper Plus (ETM+).
The landsat 7 ETM+ sensor image consists of 8 spectral bands, bands 1 to 7 has 30 meters spatial resolution and band 8 has 15 meters spatial resolution. All bands can collect one of two gain settings (high or low) for increased radiometric sensitivity and dynamic range, while Band 6, the thermal infrared band, collects high and low gain for all scenes. Landsat 7 ETM+ band is acquired at 60-meter resolution but is resampled to 30 meter in delivered data product. Approximate scene size is 170 km north-south by 183 km east-west. Table 7 represents the landsat 7 ETM+ bands and technical functions (Stanganelli, 2016).
On May 31, 2003, the ETM+ instrument Scan Line Corrector (SLC) failed. The SLC consists of two small mirrors that rotate around an axis in the same time with the motion of the main ETM+ scan mirror.
The function of the Scan Line Corrector (SLC) is to compensate for the forward motion (along-track) of the spacecraft so that the resulting scans are aligned parallel to each other. Without the Scan Line Corrector (SLC), the instrument images the Earth in a "zig-zag" shape, resulting in some places that are imaged
36
Table 7 Landsat 7 Properties and technical functions of bands
twice and others that are not imaged at all. Figure 16 shows the difference between the motion with the SLC and without the SLC (Stanganelli, 2016).
Figure 16 The Function of the SLC (source: https://landsat.usgs.gov/slc-products-background)
The effect is about 22% of the data in a Landsat 7 scene is missing when taken without a functional SLC.
The SLC problem is mechanical and permanent; since that time, Landsat 7 has continued to take useful image data in the off” mode. Figure 2 shows the “SLC-off” image.
37
Figure 17 the effect of "SLC-off" Mode (image taken in August 2015, downloaded from (https://earthexplorer.usgs.gov/))
1-2-1- Solving the SLC problem using ArcGIS software:
The software used in this study is ArcGIS 10.3 Desktop. To solve the SLC problem “Landsat toolbox” was downloaded from the internet and used, as written in Daniels (2012) paper. The “Landsat toolbox” is designed through the model builder function in ArcGIS software and it has the ability to fill the SLC error gaps, to calculate the normalized difference vegetation index (NDVI) and normalized difference water index (NDWI), and other functions. In this study, the “Landsat toolbox” was used only to solve the SLC problem. Figure 3 shows the “Landsat toolbox” after it has been added to the ArcGIS, ArcMap software.
38
The fill process of landsat 7 ETM+ scanline error was done using the “Nibble” tool in special analyst toolbox which replaces cells of a raster corresponding to a mask with the values of the nearest neighbors with the aid of the “Set Null” tool in the special analyst toolbox which identifies cell locations to NoData based on a specified criterium. In other words, it returns NoData if a conditional evaluation is true, and returns the value specified by another raster if it is false. Figure 19 shows the model structure of the “Fill Landsat 7 ETM+ scanline Errors” in the “Landsat toolbox”.
Figure 19 the model structure of the "Fill Landsat 7 ETM+ scanline Errors"
The result after using this model can be seen in figure 20, which shows the original image and the processed one. As shown, in the image the minimum cell number changed from zero in the original image to 72 in the processed one.
39
1-3- Convert the Digital Number (DN) to Top of Atmosphere (TOA) reflectance:
The conversion of the Digital Number (DN) to Top of Atmosphere (TOA) reflectance aims at reduction in scene-to-scene variability (Chander et al, 2009). The image data acquired by the satellite sensor do not represent the Earth Surface only, they are affected by atmospheric factor and sun inclination factor. The conversion of the Digital Number (DN) to Top of Atmosphere (TOA)’s target is necessary to clear the image and to represent the earth surface by making some corrections to the satellite raw data. Figure 21 represents the climate factors which affect the satellite image data.
There are three benefits of converting the DN to TOA reflectance:
1- the removal of the cosine impact of different solar zenith angles because of the time difference between data acquisitions;
Figure 20 the result of using the “Fill Landsat 7 ETM+ scanline Errors” in the “Landsat toolbox” the left image is the original image and the right one is the resulted image.
40
2- TOA reflectance provides for various values of the atmospheric solar irradiance arising from spectral band differences;
3- the TOA reflectance corrects for the variation in the Earth-Sun distance between different data acquisition dates. These variations can be significant geographically and temporally (Chander et al, 2009).
Figure 21 the climate factors affect the satellite image data,
(source: http://gsp.humboldt.edu/olm_2015/Courses/GSP_216_Online/lesson4-1/radiometric.html)
The Equation Used to obtain the TOA reflectance is equation (1)
𝜌𝜆 = 𝜋∗𝐿𝜆∗𝑑2
𝐸𝑆𝑈𝑁𝜆∗ cos 𝜃𝑠 (1)
𝑤ℎ𝑒𝑟𝑒:
𝜌𝜆 = 𝑇𝑂𝐴 𝑅𝑒𝑓𝑙𝑒𝑐𝑡𝑎𝑛𝑐𝑒
𝐿𝜆 = Spectral radiance at the sensor′s aperture [W/(m2 sr μm)]
𝑑 = Earth − Sun distance [astronomical units]
𝐸𝑆𝑈𝑁𝜆 = Mean exoatmospheric solar irradiance [W/(m2 μm)]
41
To get the Spectral radiance at the sensor′s aperture (𝐿𝜆) we can use Equation
(2)
𝐿𝜆 = 𝑎0,𝑖 + 𝑎1,𝑖 ∗ 𝐷𝑁 (2)
𝑎0,𝑖 = RADIANCE_ADD_BAND_x in the Meta data of Landsat7 ETM+
𝑎1,𝑖 = RADIANCE_MULT_BAND_x in the Meta data of Landsat7 ETM+ (x is the band
number)
The following tables contain the required data to make the conversion, these data were extracted from Landsat 7 ETM+ Metadata which were downloaded from the
USGS website (USGS, http://earthexplorer.usgs.gov/).
Table 8 coefficients a0,i and a1,i for each band
RADIANCE_MULT_BAND_1 = 1.181 RADIANCE_MULT_BAND_2 = 1.21 RADIANCE_MULT_BAND_3 = 0.943 RADIANCE_MULT_BAND_4 = 0.64 RADIANCE_MULT_BAND_5 = 0.191 RADIANCE_MULT_BAND_6_VCID_1= 0.067 RADIANCE_MULT_BAND_6_VCID_2= 0.037 RADIANCE_MULT_BAND_7 = 0.066 RADIANCE_MULT_BAND_8 = 0.976 RADIANCE_ADD_BAND_1 = -7.38071 RADIANCE_ADD_BAND_2 = -7.60984 RADIANCE_ADD_BAND_3 = -5.94252 RADIANCE_ADD_BAND_4 = -5.73976 RADIANCE_ADD_BAND_5 = -1.19122 RADIANCE_ADD_BAND_6_VCID_1 = -0.06709 RADIANCE_ADD_BAND_6_VCID_2 = 3.1628 RADIANCE_ADD_BAND_7 = -0.4165 RADIANCE_ADD_BAND_8 = -5.67559
42
Table 9 Esun value for each band
Table 10 distance coefficient according to the day ranking in the year
ETM+ Band Esun values
1 1970 2 1840 3 1547 4 1044 5 225.7 6 153.88 7 82.06 8 1369
JD Distance JD Distance JD Distance JD Distance JD Distance
1 0.98331 74 0.99446 152 1.01403 227 1.01281 305 0.99253
15 0.98365 91 0.99926 166 1.01577 242 1.00969 319 0.98916
32 0.98536 106 1.00353 182 1.01667 258 1.00566 335 0.98608
46 0.98774 121 1.00756 196 1.01646 274 1.00119 349 0.98426
43
1-4- Clouds:
Clouds are a problem that was faced in this work. This problem doesn’t have any solution except erasing the cloudy data from the image or making analysis in the other places which do not have any clouds. It could be said that, for most purposes, a cloudy image, which has a percentage of clouds more than 50%, cannot be used. The method used in this study to overcome the clouds problem is to replace the cloud affected area with the same area in other image. This has been performed using the conditional, “Con” tool in Spatial Analysis toolbox, which allows the user to perform a conditional evaluation (if/else) of each of the input cells in the input raster data. The condition was if the cell value is greater than or equal to the clouds cell value, then, that value is replaced by the same cell in the not cloudy image. In this way, the cloudy area is replaced with the same area in the not cloudy image. This tool can be useful when seasonal changes are estimated; like this study is analyzing the seasonal change in the vegetation and water cover in the month of August when there is the wet season, the wet season lasts from June till October, from the year of 2011 till the year of 2018. For example, the cloudy image is the one which was acquired in 29 August 2011 and the not cloudy image was acquired in 28 July 2011. For the conditions of this study, these dates can be considered as almost equivalent, corresponding to the wet season of the Nile River. Figure 22 represents the result of this method to remove the cloudy data toolbox.
Figure 22 the result of the Cloud correction Method, the left image is the original one before the correction and the right one is the resulted one after the correction
44
2- Indices for vegetation and moisture monitoring
The Normalized Difference Vegetation Index (NDVI), Normalized Difference Water Index (NDWI) and the Normalized Difference Moisture Index (NDMI) were used in this study in order to check the changes in the vegetation cover, moisture and water from the year of 2011 till the year of 2018 in the Delta region in Egypt, the Downstream region of the Nile River. The purpose of the analysis is to evaluate the current situation in the Downstream territory considering the changes which already happened before the filling of the Grand Ethiopian Renaissance Dam (GERD).
2-1- the Normalized Difference Vegetation Index (NDVI)
The Normalized Difference Vegetation Index (NDVI) was firstly performed by Tucker (1979): two bands of the spectrum were used to measure both vegetation cover and the water bodies. These two bands are red and near-infrared (Jackson and Huete, 1991). The normalized difference vegetation index (NDVI) is influenced by the chlorophyll absorption in the red wavelengths, which is relative to leaf chlorophyll thickness (Tucker et al. 1985). NDVI values go from - 1 to +1, considering high reflectance in the near infrared (NIR) segment of the electromagnetic range; vegetation has high NDVI values. On the other hand, non-vegetated surfaces, for example, water bodies, have negative value of NDVI considering the electromagnetic intake of water body (Tucker, 1979).
A higher NDVI value shows the presence of green vegetation. NDVI likewise could be utilized to single out vegetated and non-vegetated regions. NDVI is computed with the condition defined by Rouse et al. (1974).
𝑁𝐷𝑉𝐼 = 𝑁𝐼𝑅−𝑅𝐸𝐷
𝑁𝐼𝑅+𝑅𝐸𝐷 (3)
Where: NIR = near-infrared band RED = red band.
The NDVI can be calculated by the formula (equation (3)) which is the difference between the Near Infrared and the red bands divided by the summation of the Near infrared and the red bands. In Landsat 7 ETM+ satellite the Near infrared band is band 4 and the red band is band 3, therefore, the equation could be written as shown in (equation (4)).
45
𝑁𝐷𝑉𝐼 = 𝐵𝑎𝑛𝑑 4−𝐵𝑎𝑛𝑑 3
𝐵𝑎𝑛𝑑 4+𝑏𝑎𝑛𝑑 3 (4)
2-2- The Normalized Difference Water Index (NDWI):
The normalized difference water index (NDWI) is useful to detect vegetation liquid water from space. Unlike the two channels used in NDVI, NDWI is a measure of liquid water molecules in vegetation canopies that interacted with the incoming solar radiation. It is less sensitive to atmospheric scattering effects than NDVI. NDWI does not remove completely the soil background reflectance effects, as it happens for the NDVI. It is possible to infer the vegetation water content equivalent water thickness (EWTs) from NDWIs over areas fully covered by green vegetation. However, it is difficult to do so from NDWIs over partially vegetated areas, because soil contributions to NDWIs are mostly negative, whereas green vegetation contributions are positive. In order to gain improved understanding of its usefulness and limitations see Gao (1996).
The NDWI is then calculated using Equation (5):
𝑁𝐷𝑊𝐼 = 𝐺𝑟𝑒𝑒𝑛−𝑁𝐼𝑅
𝐺𝑟𝑒𝑒𝑛+𝑁𝐼𝑅 (5)
Where: NIR = near-infrared band Green = The green band.
The NDWI can be calculated by the formula (equation (5)) which is the difference between the Green band and the Near infrared band divided by the summation of the Green band and the Near infrared band. In Landsat 7 ETM+ satellite the Near infrared band is band 4 and the green band is band 2, there for the equation could be written as shown in (equation (6)).
𝑁𝐷𝑊𝐼 = 𝐵𝑎𝑛𝑑 2 − 𝐵𝑎𝑛𝑑 4
𝐵𝑎𝑛𝑑 2 + 𝐵𝑎𝑛𝑑 4 (6) 2-3- The Normalized Difference Moisture Index (NDMI):
The Normalized Difference Moisture Index or the modified Normalized Difference Water Index has been calculated by GAO (1996) and Huang et al. (2009). It
46
presented a new version of the Normalized Difference Water Index (NDWI) to reduce the errors of NDWI. These errors could be a result of the existence of buildings in the study area (Hanqiu, 2006), the NDWI cannot remove these buildings and they can affect the result’s accuracy. The NDMI is theoretically similar to the NDWI, it also aims at calculating the soil moisture content but the difference is that the NDMI does not consider any noise of the image like existence of buildings unlike the NDWI (Sahu, 2014).
The NDMI is calculated using Equation (7):
𝑁𝐷𝑀𝐼 = 𝑁𝐼𝑅−𝑀𝐼𝑅
𝑁𝐼𝑅+𝑀𝐼𝑅 (7)
Where: NIR = near-infrared band MIR = The Mid-infrared band.
The NDWI can be calculated by the formula (equation (7)) which is the difference between the Near infrared band and the Mid-infrared band divided by the summation of the Near infrared band and the Mid-infrared band. In Landsat 7 ETM+ satellite the Near infrared band is band 4 and the Mid-infrared band is band 5, there for the equation could be written as shown in (equation (8)).
𝑁𝐷𝑀𝐼 = 𝐵𝑎𝑛𝑑 4 − 𝐵𝑎𝑛𝑑 5
47
3- Satellite data processing to show the impact of the GERD on the downstream territory
3-1- Study Area:
The chosen study area in this work is located in the west of the Nile Delta region. Figure 23 shows the study Area, with respect to the Delta region (the left image) and with respect to the country region (the right image). As shown in figure 23, the footprint of the Landsat satellite image covers most of the delta region from north to south.
Table 11 illustrates a list of satellite images used in this study and table 12 shows the corresponding coordinates of the borders of the images.
Table 11 List of the satellite images which are used in this study
Image Acquisiton date ID Path Row
Aug-11 29/8/2011 LE07_L1TP_177039_20110829_20161206_01_T1 177 39 Aug-12 31/8/2012 LE07_L1TP_177039_20120831_20161129_01_T1 177 39 Aug-13 18/8/2013 LE07_L1TP_177039_20130818_20161122_01_T1 177 39 Aug-14 5/8/2014 LE07_L1TP_177039_20140805_20161111_01_T1 177 39 Aug-15 24/8/2015 LE07_L1TP_177039_20150824_20161021_01_T1 177 39 Aug-16 26/8/2016 LE07_L1TP_177039_20160826_20161008_01_T1 177 39 Aug-17 13/8/2017 LE07_L1TP_177039_20170813_20170908_01_T1 177 39 Aug-18 16/8/2018 LE07_L1TP_177039_20180816_20180911_01_T1 177 39
48
Table 12 the coordinates of the chosen study area (source: https://earthexplorer.usgs.gov/) UL Corner Lat 31°14'51.83"N
UL Corner Long 29°36'50.54"E UR Corner Lat 30°57'41.33"N UR Corner Long 31°35'15.72"E LL Corner Lat 29°38'14.28"N LL Corner Long 29°12'31.46"E LR Corner Lat 29°21'20.66"N LR Corner Long 31°09'02.56"E
The desert area was not considered in the processing, because in this study we are interested in the vegetated area and not in the desert area. Figure 24 shows the final study area.
49
3-2- Data Analysis:
In this chapter, the analysis of the data wase done for the study area as explained in section 3-1; as well, SLC correction and cloud cover removal were performed as explained in sections 1-2-1 and 1-4 . All data are analyzed through the ArcGIS, ArcMap 10.3 software. All data were downloaded from (USGS website:
https://earthexplorer.usgs.gov/)
The first step is to clip the satellite images to the area on interest, then the calculation for atmospheric correction was done through Microsoft Excel to get the final correction values first and then through ArcGIS-ArcMap program, with the raster calculator tool in spatial analyst toolbox. The correction of the SLC error was done in every image dataset through the fix land 7 scanline errors tool in the
Landsat toolbox (Daniels, 2012) figure 25 represents the zoomed area before and after the SLC correction.
The cloud covered areas were fixed as illustrated in section 1-4; with the help of other satellite images taken in a short time before or after the main image taking time. For example, the cloudy image is the image acquired on 29 August 2011, the
50
other image used to replace the cloudy pixels was Acquired on 28 July 2011. Figure 26 shows the cloud affected image before and after correction.
Another image with the same problem in this study is the image which was acquired on 24 August 2015 and it was corrected using the image acquired on 23 July 2015.
1-1- The Normalized Difference Vegetation Index (NDVI):
After making the pre-processing analysis previously shown, the Normalized Difference Vegetation Index (NDVI) was computed for each year from 2011 till 2018 and statistics were calculated to have a measure of the vegetation cover in the study area. The computed statistics are the minimum value, the maximum value, the mean and the standard deviation (table 13) for each image.
Figure 26 the cloudy correction process, the left image is the cloudy image before correction, the right image is the cloudy image after correction
51
Table 13 the statistics of the NDVI results from 2011 until 2018
Then, to detect the changes in the vegetation cover, the difference between the NDVI for the image acquired in 2011 and other NDVI for the next years was done. Figure 27 shows the histogram for each difference, which represent the change in the vegetation cover.
Figure 27 the histograms of the change of vegetation cover for the differences between the year of 2011 and other years till 2018
NDVI Max. Min. Mean St. Deviation
Aug-11 0.912 -0.992 9.207 0.245 Aug-12 0.747 -0.991 8.606 0.242 Aug-13 0.724 -0.992 8.372 0.234 Aug-14 0.931 -0.992 0.105 0.256 Aug-15 0.757 -0.991 6.454 0.225 Aug-16 0.757 -0.991 6.046 0.215 Aug-17 0.714 -0.992 9.193 0.235 Aug-18 0.982 -0.829 7.436 0.221
52
As illustrated in figure 27, the situation is almost constant and there is no significant change detected from the year of 2011 till the year of 2018. However, the beak of each histogram is different from year to year, that means that for example in the difference between the year of 2011 and the year of 2012 the beak is more than 10000 pixels, the difference between the year of 2011 and 2013 the beak is at 10000 pixels and the difference between the year of 2011 and 2016 the beak is at 8000 pixels. Table 14 shows the statistics related to the changes, such as: minimum value, the maximum value, the mean and the standard deviation.
Table 14 the statistics of the NDVI Differences between the year of 2011 and the following years till 2018
As illustrated in the table the standard deviation, which represent how the data is close to the mean, it is clear that the standard deviation is getting bigger, the standard deviation has increased from 0.138 to reach 0.159. That’s mean the data change every year in comparison of the year of 2011.
1-2- The Normalized Difference Water Index (NDWI):
The same analyses as the Normalized Difference Vegetation Index (NDVI) were done with the Normalized Difference water Index (NDWI), and the same statistics were calculated.
Table 15 shows the statistics for Normalized Difference water Index (NDWI) from the year of 2011 till the year of 2018
NDVI - difference Max. Min. Mean St. Deviation
Aug-11, Aug-12 1.567 -1.202 6.013 0.138 Aug-11, Aug-13 1.522 -1.371 8.350 0.148 Aug-11, Aug-14 1.704 -1.579 -1.287 0.134 Aug-11, Aug-15 1.483 -1.705 2.753 0.153 Aug-11, Aug-16 1.647 -1.705 3.161 0.154 Aug-11, Aug-17 1.706 -1.514 1.362 0.142 Aug-11, Aug-18 1.351 -1.557 1.770 0.159
53
Table 15 the statistics of the NDVI results from 2011 till 2018
The result of the NDWI is coherent with respect to the Result of the NDVI. Looking at the maximum and minimum values, for example, for the image acquired in August 2012 the maximum value of the NDVI is 0.747 which represent the healthy green vegetation (no water in the Area) and the minimum value of NDWI is -0.714, which represent the scarcity of water in this area, and the absolute values of both of these numbers are close. On the other hand, the Minimum value of the NDVI is -0.991 which represent the deep water existence and the Maximum value of the NDWI is 0.989 which if course represent the Deep water in the area.
Figure 28 shows the histograms for the Normalized Difference Water Index for the difference between the year of 2011 and the following years till 2018.
NDWI Max. Min. Mean St. Deviation
Aug-11 0.992 -0.714 -0.143 0.182 Aug-12 0.989 -0.714 -0.138 0.185 Aug-13 0.992 -0.714 -0.133 0.176 Aug-14 0.991 -0.974 -0.157 0.186 Aug-15 0.989 -0.714 -0.111 0.172 Aug-16 0.988 -0.714 -0.120 0.168 Aug-17 0.992 -0.982 -0.143 0.169 Aug-18 0.867 -0.987 -0.136 0.170
54
as illustrated in figure 28 there is a slight change of the water cover represented by the NDWI, however the situation is still stable, and the change are not very big. Table 16 shows the statistics of the NDWI Differences between the year of 2011 and the following years till the year of 2018
Table 16 the statistics of the NDVI Differences between the year of 2011 and the following years till 2018
The standard deviation here has an overall increase from 0.124 to reach 0.132 and that stresses that there is a change in the water cover of the study area.
1-3- The Normalized Difference Moisture Index (NDWI):
The same analyses as the Normalized Difference Vegetation Index (NDVI) were done with the Normalized Difference moisture Index (NDMI), and the same statistics were calculated. Table 17 shows the statistics for Normalized Difference water Index (NDWI) from the year of 2011 till the year of 2018
Table 17The NDMI statistics from August 2011 till August 2018
The result of the NDMI is coherent with the result of NDWI and of NDVI in the minimum and the maximum value NDMI values are varying between 0.99 as a maximum value and -0.98 with is not very far from the results of the NDWI and NDVI.
NDWI - difference Max. Min. Mean St. Deviation
Aug-11, Aug-12 1.548 -1.479 -4.745 0.124 Aug-11, Aug-13 1.401 -1.477 -1.016 0.136 Aug-11, Aug-14 1.478 -1.636 1.425 0.110 Aug-11, Aug-15 1.646 -1.437 -3.219 0.138 Aug-11, Aug-16 1.639 -1.381 -2.316 0.119 Aug-11, Aug-17 1.438 -1.639 -1.014 0.113 Aug-11, Aug-18 1.443 -1.274 -6.601 0.132
NDMI Max. Min. Mean St. Deviation
Aug-11 0.989 -0.845 6.816 0.209 Aug-12 0.988 -0.882 4.007 0.185 Aug-13 0.990 -0.832 4.890 0.188 Aug-14 0.989 -0.808 4.995 0.190 Aug-15 0.989 -0.855 4.328 0.185 Aug-16 -0.811 0.988 2.739 0.175 Aug-17 0.989 -0.812 4.362 0.184 Aug-18 0.989 -0.979 2.380 0.161
55
Figure 29 shows the histograms for the NDMI for the difference between the year of 2011 and the following years till 2018.
Figure 29 the histogram of the NDMI for the differences between 2011 and the following years
Table 18 shows the statistics of the NDMI Differences between the year of 2011 and the following years till the year of 2018.
Table 18 Table 11The NDMI statistics from August 2011 till August 2018
The standard deviation here has an overall increase from 0.146 to reach 0.157, these values are larger than the values calculated in the NDWI which means the change between the moisture index of the year of 2011 and the following year is
NDMI - difference Max. Min. Mean St. Deviation
Aug-11, Aug-12 1.702 -1.693 2.809 0.146 Aug-11, Aug-13 1.394 -1.662 1.926 0.151 Aug-11, Aug-14 1.741 -1.652 1.821 0.126 Aug-11, Aug-15 1.652 -1.669 2.489 0.140 Aug-11, Aug-16 1.647 -1.752 4.077 0.144 Aug-11, Aug-17 1.554 -1.648 2.454 0.136 Aug-11, Aug-18 1.668 -1.703 4.436 0.157
56
significant and could not be neglected and that stresses the change in the water cover of the study area.
The benefit of this study is to show the current situation and the changes in the vegetation and water indices before the filling of the GERD reservoir and presents a way to monitor the change after the filling of the GERD reservoir as a cumulative study. Because, looking at the previous results the vegetation and water cover are changing already without the effect of the GERD. During the filling of the GERD reservoir these analyses could be done in that time and simply making difference analysis and by some statistical analysis the impact of the GERD filling reservoir could be detected.
So, this study should be continuing to check the change happening during and after the filling period of the GERD reservoir and compare it with this study to monitor how the dam construction affect the downstream area of the River considering that this area has a full dependency of the Nile River fresh water.