Politecnico di Milano
Polo di Como
Scuola di Ingegneria dell’Informazione
Corso di Laurea Specialistica in Ingegneria Informatica
BPM
ETRICS
: a Software System for the
Evaluation of Some Metrics for Business
Process
Supervisor: Prof. Giuseppe POZZI
Master Graduation Thesis by: Carlo CORTI Id. 729868
2
Abstract
It’s during the 1990s that the workflow management prevailed as a new technology to support business processes and the term “process” became a new productivity paradigm but up to now many organizations have modeled and are modeling and designing business processes without the aid of metrics to question the quality of their models. As result, it may happen that simple processes are modeled in a complex and unsuitable way leading to a lower understandability, higher maintenance costs and inefficient execution of the process.
As modern organizations spend a lot of time creating and maintaining business processes, the importance of business process metrics is becoming increasingly important over time.
This thesis presents several business process metrics to evaluate the quality of a
Business Process Model and all these metrics are available through the
application BPMETRICS, in both web and standalone versions.
Keywords: business process, business process models, business process metrics,
3
Sommario
E 'nel corso degli anni 1990 che il workflow management si impose come una nuova tecnologia a supporto dei processi di business e il termine "processo" diventò un paradigma della nuova produttività, ma fino ad oggi molte organizzazioni hanno modellato e stanno modellando e progettando processi di business senza l'ausilio di metriche che definiscano la qualità dei loro modelli. Come risultato, può accadere che i processi semplici sono modellati in modo complesso e inadatto portando ad una minore comprensibilità, maggiori costi di manutenzione e rendendo inefficiente l'esecuzione del processo.
Dal momento che le moderne organizzazioni spendono un sacco di tempo a creare e mantenere i processi di business, l'importanza delle metriche dei processi di business sta diventando sempre maggiore nel corso del tempo.
Questa tesi presenta diverse metriche di processi di business per valutare la qualità di un modello di business process e tutte queste metriche sono
disponibili attraverso l'applicazione BPMETRICS, in entrambe le versioni
stand-alone e web.
Parole chiave: processo di business, modelli dei processi di business, metriche
4
Table of Contents
Abstract ……….. . 2 Sommario ……….. .. 3 Table of Contents ……….. . 4 List of Figures ……….. ... 7 1 Introduction ... 81.1 Business Software Management ... 8
1.2 Software Metrics ... 10
1.3 Thesis Structure ... 12
2 State of Art ... 13
2.1 Business Process Metrics ... 13
2.2 Approaches ... 15
2.2.1 Software-related Metric Approach ... 15
2.2.2 Axioms Approach ... 18
2.2.3 Category Approach ... 20
2.3 Relevant Projects ... 21
2.3.1 Prediction of error probability based on metrics ... 21
2.3.2 ProM tool ... 22 3 Requirements Analysis ... 24 3.1 Goals ... 24 3.2 Project Constraints ... 25 3.2.1 Java ... 25 3.2.2 XPDL ... 26 3.3 User Requirements ... 27 4 Design Choices ... 28 4.1 Software ... 28
4.1.1 Together Workflow Editor ... 28
4.1.2 Libraries and Framework ... 29
4.2 Metrics ... 31
4.2.1 Activity Size ... 32
4.2.2 Data Flow Size ... 33
5
4.2.4 Resources Size ... 35
4.2.5 Resources Coupling ... 35
4.2.6 Event Size ... 35
4.2.7 Start Event Size ... 36
4.2.8 End Event Size ... 36
4.2.9 Intermediate Event Size ... 37
4.2.10 Connector Size ... 37
4.2.11 And Split Size ... 38
4.2.12 And Join Size ... 38
4.2.13 Or Split Size ... 39
4.2.14 Or Join Size ... 39
4.2.15 Xor Split Size ... 39
4.2.16 Xor Join Size ... 40
4.2.17 Control Flow Size ... 40
4.2.18 Control Flow Complexity ... 41
4.2.19 Diameter ... 41 4.2.20 Density ... 42 4.2.21 Coefficient of Connectivity ... 42 4.2.22 Activity Coupling ... 42 4.2.23 Degree of Connectors ... 42 4.2.24 Separability ... 43 4.2.25 Sequentiality ... 43 4.2.26 Depth ... 44 4.2.27 Connector Mismatch ... 45 4.2.28 Connector Heterogeneity ... 45 4.2.29 Cyclicity ... 46 4.2.30 Token Split ... 46
5 Description of the System ... 47
5.1 Architecture ... 47 5.2 Data structure ... 48 5.3 Algorithms ... 52 5.3.1 Paths ... 52 5.3.2 Cut Vertex ... 55 6 Results …...……….... . 58 6.1 Standalone Application ... 58 6.2 Web Application ... 60 6.3 Scenarioes ... 63 6.3.1 Stand-alone scenario ... 63 6.3.2 Web scenario ... 64 6.4 Sample Process ... 65
6
6.4.1 EOrder Process ... 65
6.4.2 Credit Check Sub-process ... 66
6.4.3 Fill Order Sub-process ... 66
6.5 Metric Results ... 68
6.5.1 Activity Metrics ... 69
6.5.2 Data Flow Metrics ... 70
6.5.3 Resources Metrics ... 71
6.5.4 Control Flow Metrics ... 71
7 Conclusions and Future Works ... 80
7.1 Conclusions ... 80
7.2 Future Research Directions ... 81
7
List of Figures
2.1 An example system ... 18
5.1 Diagram of the data structure ad hoc created for the BPMETRICS application ... 48
5.2 Graph based representation of a possible XPDL process ... 53
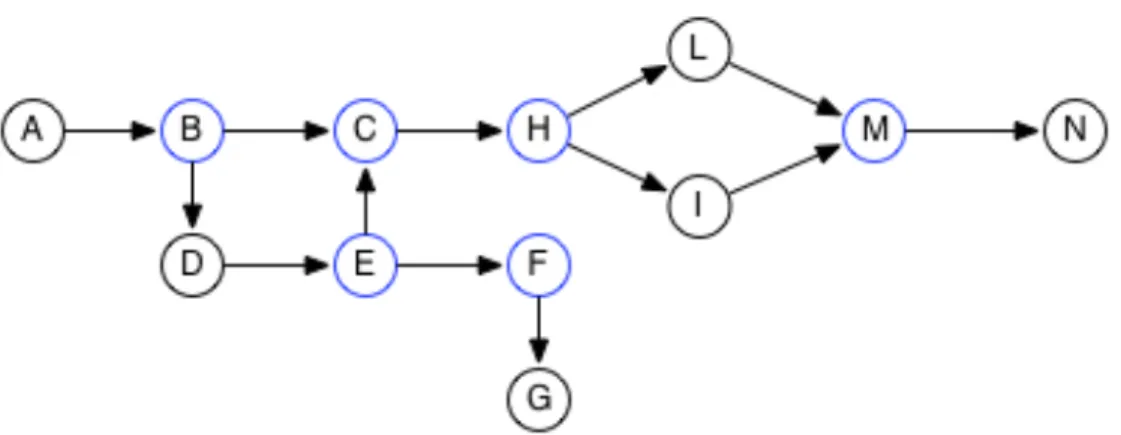
5.3 Graph based representation of a possible XPDL process, with the blue colored nodes representing the cut vertices of the graph ... 56
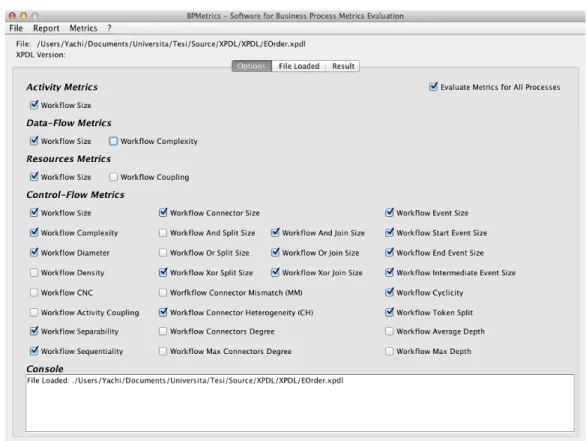
6.1 Option section of the BPMETRICS standalone application ... 59
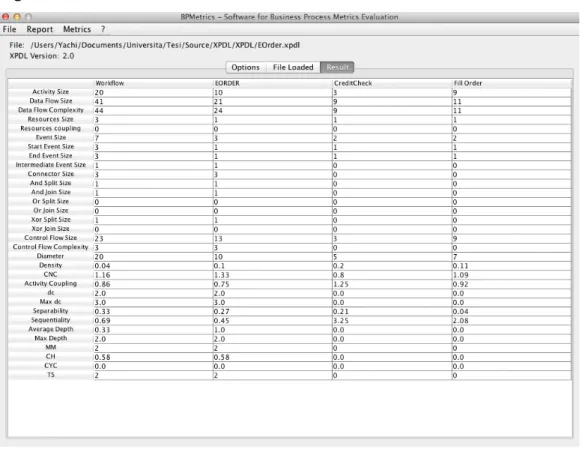
6.2 Result section of the BPMETRICS standalone application ... 60
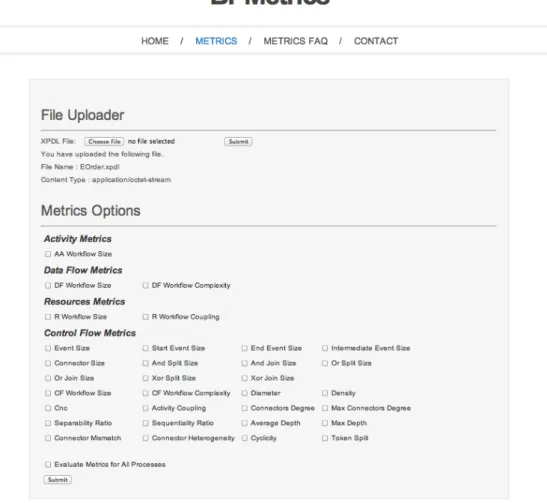
6.3 Metrics Unit of the BPMETRICS web application showing the panel to upload the XPDL file and the metrics selection panel ... 61
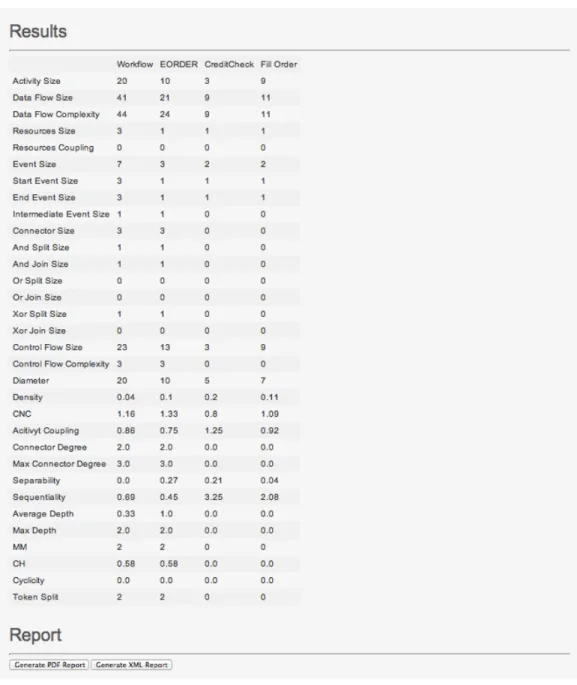
6.4 Metrics Unit of the BPMetrics web application showing the results of the metrics in tabular form and the report section ... 62
6.5 The Fill Order sub-process ... 66
6.6 The Credit Check sub-process ... 66
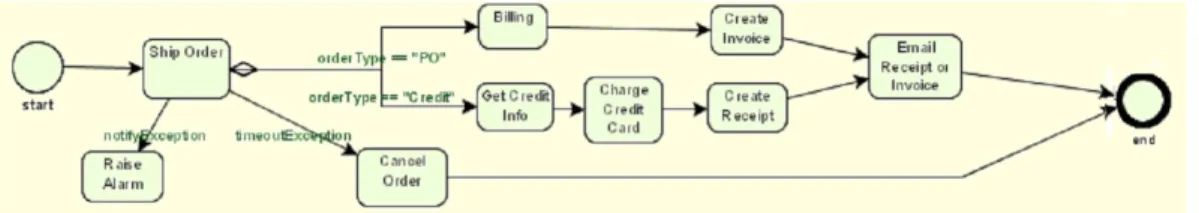
6.7 EOrder Main Process ... 67
6.8 Options panel of the BPMETRICS standalone application showing the metrics selected to be computed for the EOrder sampe process ... 68
6.9 Result panel of the BPMETRICS standalone application showing the metric results computed for the EOrder sampe process ... 69
8
Chapter 1
Introduction
This chapter provides a brief introduction to Business Process Management, the area in which the realization of this thesis arises, and Software Metrics, on which are based many of the Business Process Metrics. Will be finally presented the structure of this paper, briefly explaining the content of each chapter..
1.1 Business Software Management
In the last years, there has been a growing interest in business process management from industry as well as from business administration and systems research but the current management and improvement approach, with formal definitions and technical modelling, has been around since the early 1990s. In fact, it is only during the 1990s, that the workflow management prevailed as a new technology to support business process and the term “process” became a new productivity paradigm. The flourishing market and the availability of a wide range of products, in addition to allowing individual product vendors to focus on specific functional capabilities and users to take particular products to meet specific application needs, has revealed a fundamental problem: the lack of standards to enable the cooperation of different WFM products. To solve this problem, in 1993, a group of companies have joined to form the WFM Coalition that had as its primary purpose the establishment of standards and rules that allow the cooperation of different WFM products. In fact, the idea of creating standards and therefore developing appropriate specification for the implementation of workflow products arises from the fact that all the workflow
9
management systems have certain common characteristics with the purpose to enable the possibility to achieve the interoperability. In addition, these specifications, as well as allowing the interoperability between heterogeneous workflow products, has also improved the integration of workflow applications with other IT services (electronic mail, document management ...) but overall has improved the opportunities for the effective use of workflow technology within the IT market.
Since the 1990s the BPM market, and in particular the market BPM-related software, has always been expanding to become today a considerable market for software vendors, IT service providers and business consultants. In fact, market research have revealed that organizations that have had the best results in implementing business process management have spent more than 40% of the total time of the project in the study and implementation of the initial process model. In fact, the Business Process Modeling was considered one of the top 10 technology strategies in 2008 [1].
Business Process Modeling aims at producing a model of one or more business processes by defining the ways in which operations are carried out to achieve the objectives of an organization, known as Business Process Model. It may be constructed in multiple layers as the business process may be composed not only by a single process but by multiple nested processes. This model is an abstraction of reality and is used to describe the workflow or the integration between business processes. In particular, when we talk about Workflow we refer to the automation of procedures where documents, information or tasks are passed between participants according to a defined set of rules to achieve an overall business goal. The majority of the workflows are normally organized, within the context of an IT system, in order to provide support for the procedural automation.
10
In essence, business process is a collection of related, structured activities or tasks that produce a specific service or product for a particular goal. Three types of business process exist:
• Management processes that govern the operation of a system
• Operational processes that constitute the core business and create the primary value stream (Marketing, Sales … )
• Supporting processes which support the core processes (Recruitment, Technical Support…)
From the real importance of the business processes and their representation within the area of workflow software and the objectives of standardization of the WfMC, it follows the birth of language XPDL in the late 90's. In fact the XML Process Definition Language (XPDL) is a standard designed to exchange the process definition, both the graphics and the semantics of a workflow business process. Due to this fact, with the XPDL standard is possible to interchange business process definitions between different workflow products [2]. Later on, in the 2004 WfMC endorsed the Business Process Model Notation, a graphical formalism to standardize the way that process definitions were visualized. Therefore, XPDL was extended specifically with the goal to be able to represent in XML all of the concepts present in a BPMN diagram.
1.2 Software Metrics
In the mid-1960’s software engineers started to use metrics, a measure of some property of a piece of software or its specifications, to characterize the properties of their code. As [3] says it is typical to divide the attributes/metrics into internal and external ones. In particular, internal software attributes can be
11
measured based only on the knowledge of a software artifact, such as size, cohesion and complexity while external software attributes can only be measured if additional knowledge is available about the environment of the software and of the interaction between the software and the environment, such as maintainability.
The main purpose of software quality metrics is to support the design phase in order to obtain program designs that are better structured, both from the point of view of the complexity of the model and from the point of view of the readability of the model by the user. In addition, the software quality metrics may have numerous applications in activities such as cost estimation, software quality assurance testing and performance optimization.
Given the importance that software metrics cover, in recent years it has tried to find the corresponding metrics for Business Process. In fact, several researchers, like Cardoso, Vanderfeesten and Mendling, have already identified similarities between software programs and business process design and recognized the potential of quality metrics in business process Management [4].
In fact the metrics of business process were born as the adaptation of software metric to the definitions of Business Process and in particular, most of these metrics are adapted considering the scheme/graph of the Business Process. Subsequently these metrics have been improved or new ones have been designed and created specifically for the BP in order to provide more useful information for creating Business Process Model. These metrics, not only consider the pure graphical representation of BP, but as internal software metrics, they also take into consideration those elements, attributes and definitions that are based on the knowledge of the Business Process definition.
12
1.3 Thesis Outline
The thesis is structured as follows:
• Chapter 2 – Start of Art: The chapter presents the state of the art of the business process metrics by providing an historical perspective about their development and about the approaches to the business process metrics in recent years. It also presents a couple of projects / software that are strictly related to the metrics for business process models.
• Chapter 3 – Goals of the Thesis: The chapter discusses the goals of the thesis, the design constraints and the requirements gathering.
• Chapter 4 – Design Choices: The chapter analyzes the design choices made during the analysis of the problem from the point of view of the software and from the point of view of the metrics to implement. In particular it discusses software, libraries and frameworks used during the development of this project and explains every metric available within the software.
• Chapter 5 – Description of the System: The chapter describes the system developed and its architecture. The chapter also explains the data structures and illustrates two of the main algorithms used to compute some of the metrics.
• Chapter 6 - Results: The chapter presents the results of the software implemented, illustrating both the stand-alone application and the web application, providing also the main scenario for each of them. The chapter then describes the sample process used to test all the metrics developed, showing the results and the proof of their correctness.
• Chapter 7 – Conclusions and Future Work: The chapter discusses the conclusions and the future developments of the thesis.
13
Chapter 2
State of Art
This chapter presents the state of the art of the business process metrics by providing an historical perspective about their development. The chapter discusses the approaches to the business process metrics in recent years and in the end it also presents a couple of projects / software that are strictly related to the metrics for business process models.
2.1 Business Process Metrics
In the mid-1960’s, as reported in [5], software engineers started to use metrics to characterize the properties of their code, providing a good analysis mechanism to assess the quality of the software program design. Although the research in this area progressed over the years, we must expect the beginning of the 90 for the first work done in the field of Business Process. In 1990, Lee and Yoon with [6, 7] have led a job on the definition of metrics for Petri net process models and their empirical validation. In their work the metrics proposed were divided into two groups: structural metrics, which included simple calculations of places, transitions and arcs of the control graph, and dynamic metrics that cover the number markings and the maximum and average number of tokens for the original and a reduced state space. It was however Nissen the first to introduce the measurement concepts for business process modelling and business process design [8, 9]. The metrics he proposed cover counts for distinct paths, hierarchy levels and nodes in the process model, cycles, diameter and parallelism as number of nodes divided by the diameter. After Nissen, three Indian researchers Tjarden, Narasmihan and Gupta operationalize four characteristics of a business process that need to be balanced: simplicity, flexibility, integration and
14
efficiency [10, 11] while Morasca proposed with [12] a set of metrics for Petri nets identifying size, length, structural complexity and coupling and for each of them he defined a set of axiomatic properties which a respective metric would have to fulfil. Later on, Latva-Koivisto in [13] proposed several complexity metrics for business process models including the Coefficient of Network Connectivity, Cyclomatic Number, Reduction Complexity Index but these metrics were not considered that much because the work from Latva-Koivisto was published only as a technical report.
Research in this field hasn't always followed the same direction for all. In fact over the years have been created different streams among which we must mention the stream of research that adapts coupling and cohesion concepts from software engineering to the business process modelling. In this stream, Reijers and Vanderfeesten [14] developed a set of coupling and cohesion metrics to guide the design of workflow processes while on another different stream, Cardoso centered his work around the adaptation of the cyclomatic number for business process to what he called Control Flow Complexity (CFC) [15, 16]. Differing from the Latva-Koivisto, Cardoso is calculating, with the CFC metric, the complexity of a model by summing up the split connectors weighted by the combination of output markings they can product. Another different direction was taken by the research conducted by a group including Canfora, Rolon, Garcia, Piattini, Ruiz and Visaggio extended the work related to the measurement of the software process. In particular, Canfora et al. in [17] presented a set of metrics and evaluate their suitability to serve as predictors for maintainability of the process model while on another side, Balasubramanian and Gupta, inspired by Nissen’s and Tjaden’s work, proposed a set of metrics to support business process design [18], In particular, this set includes metrics to quantify the degree of automatic decision making, role integration, activity parallelism and activity automation.
15
Not all of the aspect, during the last year, had the same relevance in this research field. In fact, one of those that was a bit left in the corner were the cognitive considerations that play an important role for understanding good design in software engineering. In fact, while Gruhn and Laue in [19, 20] adapt the cognitive weights from software engineering to business process models, Vanderfeesten et all define the cross-connectivity metric that aims to capture how difficult is to understand how two nodes in a process model relate to each other [21]. Another aspect that was left out is the modularity that builds insight on software design as it is related to the number, the size and the depth of nesting modules. Regarding this concept, the approach by Lassen and Van De Aalst identified structured components in arbitrary process models for the translation to structured BPEL and, even more important, these components can be used to describe the process model in a quantitative way.
What has been presented is the historical evolution of the research on metrics related to business Process model and the various aspects that have characterized the past 20 years. Research in this field is still in its infancy and over time arouses more interest. In fact, besides the metric, in recent years have been presented some approaches, that will be described below, in which metrics are collected and "catalogued" in accordance with certain characteristic.
2.2 Approaches
Now we will describe the approaches to Business Process metrics that over the last few years have been identified and adopted by many researchers.
2.2.1 Software-related Metric Approach
Cardoso et al. in [4] proposed an approach that focuses on software metrics. In fact, the software metrics, according to Conte, Dunsmore & Shen in [22] has as
16
main purpose to obtain program design that are better structured. The advantages that this brings in first place are that the overall program logic is easier to understand for both the programmers and the users and in second place are that the identification of the modules is easier, since different functions are performed by different modules, which makes the maintenance of the software program easier. According to Conte and Shepperd in [22, 23] the useful metrics for a better quality of design areas based on 5 principles:
• Coupling It measures the number of interconnections among the
modules. The degree of coupling depends on how complicated the connections are and on the type of connections. It is hypothesized that programs with a high coupling will contain more error than programs with a lower coupling value.
• Cohesion It measures the relationships between elements within a
module. It is hypothesized that programs with low cohesion will contain more errors than programs with higher cohesion.
• Complexity Measure relative to the number of control constructs and
to the number of modules. With the increase of these values, increases
the value of complexity. In fact it is hypothesized that the higher design complexity the more errors the design will contain.
• Modularity It represents the degree of modularization. It is
hypothesized that a low modularity is generally relates to more errors than higher modularity.
• Size It represents the size of the software both from the point of view
of the modules and of their nesting. In fact it has been hypothesized that a larger program will contain more errors of a smaller one.
17
Based on this approach, Cardoso et al. in [4] presents the Business Process metrics that have been developed, designed or adapted in recent years, using the same classification:
• Coupling It measures the number of interconnections among the
modules of the model and it is highly related to degree and density metrics in network analysis [24]. An example is the average degree, also called Coefficient of Connectivity, described in [13], that refers to the average number of connections that a node has with other nodes of the process graph. In contrast, there is the density metric [Mendling], that relates the number of available connections to the number of maximum connections for the given number of nodes.
• Cohesion It measures the coherence within the parts of the model.
The only cohesion metric, developed so far, is described in [25] and it looks at the coherence within the activities of the process model. In particular it focuses on the information processing in the process and takes a data oriented view. In fact, for each activity in the process model the total cohesion is calculated by multiplying the information cohesion and the relation cohesion of the activity and then the mean of all activity cohesion values gives the whole process cohesion value.
• Complexity It measures the ease and understandability of the design.
This kind of metric can be used by business process analysts and process designers to analyze the complexity of the process and, if possible, develop simpler one.
• Modularity It measures the degree to which a design is split into
several modules. As stated into [26] there are no business process metrics that measure the modularity of a business process design.
18
• Size It measures the size of the model. This kind of measure is
considered very important to complement other forms of process analysis.
2.2.2 Axioms Approaches
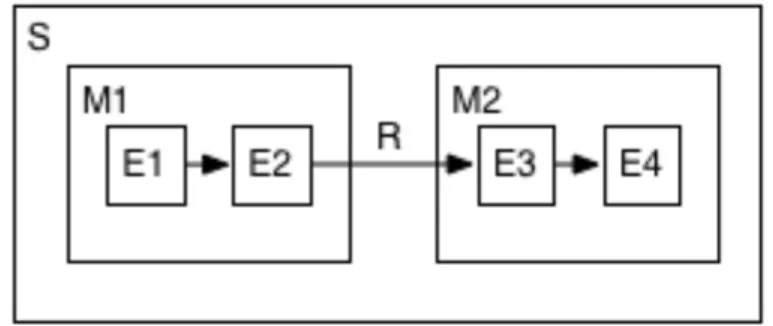
Another approach is the one presented by Antonini et al in [3]. In fact, in this case, it is considered the similarity between software and business process but using a more rigorous method. Actually, Antonini considers only the internal qualities of software, omitting the outer ones, and in particular he considers the size, the structural complexity and the coupling as Business Process Measures. For each of them are defined some properties and in the case where a metric don't satisfies such property, this metric is not considered valid. Indeed Morasca in [27] defines these properties, called axioms. Since the process model is represented by graphs using the BPMN standard, the axioms are defined on a graph-based representation of the software artifact, called system. Considering Figure 2.1, the system S is formed by two modules M1 and M2 and E1, E2, E3 and E4 are the elements respectively of M1 and M2 connected via the relation R.
19
Based on the graph (Figure 2.1) the axioms are so defined:
Size:
• The overall size of S can never be greater than the sum of the sizes of M1 and of M2, if every element Ei belong either to M1, or to M2, or to both of them; • The overall size of S equals the sum of the sizes of M1 and of M2, if every
element Ei belongs either to M1, or to M2, but not to both of them.
Complexity:
• The overall complexity of S can never be smaller than the sum of the complexity of M1 and of M2, where S is composed by M1 and M2;
• The overall complexity of S equals the sum of the complexity of M1 and of M2, if M1 and M2 are two disjoint modules, with no connections from elements of one to elements of the other.
Coupling:
• The coupling of a module with no external relationship is null;
• If we add a new relationship R2 to an existing module M1, the coupling of M1 does not decrease;
• If we join the two modules M1 and M2, the coupling of the resulting module is never greater than the sum of the coupling of M1 and of M2;
• If we join two disjoint modules M1 and M2, the coupling of the resulting module is the sum of the coupling of M1 and of M2.
20
Thus, for every metric it should be checked that it conforms to the axioms and then is determined whether it is a measure of size, complexity or coupling. Once that is done, the measure is labeled according to its category. Antonini et al consider the metrics divided in 4 categories:
• Activity Attributes that consider the activities in a BP
• Control Flow Attribute that are defined based on the pure static structure of the graph of a BP
• Data flow attributes that address the flow of the information among the several activities involved in the graph of a BP
• Resource Attributes that consider the resources required and used by the graph of a BP during the process execution.
2.2.3 Category Approaches
The third and last approach, presented by Mendling in [5], is different from the others as it does not consider correlation between software metrics and metrics for BP, but considers them as exclusive metrics for Business Process and dividing them into six categories:
• Size, group of metrics related to the number of nodes of the process model;
• Density, group of metrics that relates the number of nodes to the number of arcs;
21
model that relate to the relationship of subcomponents to the overall model;
• Connector Interplay, group of metrics related to connectors (split and join and their 3 different type: and, or, xor) and their interplay;
• Cyclicity, group of metrics related to the cyclic parts of the model;
• Concurrency, group of metrics related to the concurrent paths of a business process model that need to be synchronized.
2.3 Relevant Projects
The applications that have been taken into account during this analysis are moving on two very different roads. The first one is presented by Mendling in [5] and takes into account the possible relations between the values given by the metrics and the presence of errors within a business process model. The second, however, is a tool that supports the design of business process models with the help of metrics.
2.3.1 Prediction of error probability based on metrics
Cardoso et al in [4] states that business process models which are designed using the business process metrics contain less error and are easier to understand and maintain. A first step made towards the validation of this hypothesis is made in a quantitative analysis about the connection between simple metrics and error probability in [5].
22
This survey proposed by Mendling is divided into two parts the verification of relaxed soundness, which is a minimal correctness criterion for a business process model, and the prediction error probability based on statistic methods. The verification of relaxed soundness has brought to light that a part of the tested models (6% to about 600) contains errors and already this result suggests the need for verification tools for business process modelling projects of business process modelling projects.
In the second part, Mendling explain the possibility to use some of the business process metrics to predict the error probability. The author use a set of simple metrics related to size of the models as input to a logistic regression model. The results show that these metrics are suitable to predict the error probability and, in particular, it appears that a higher number of join-connectors is most strongly connected with an increase in error probability. But, as Cardoso reports in [4], there is a need for a further empirical investigation in order to establish an understanding of when a threshold value of a certain metrics indicates bad design in terms of maintainability or likely error proneness.
2.3.2 ProM tool
In last years, ProM has emerged as a powerful process analysis tool, supporting all kind of analysis related to business process. In contrast to many other tools, ProM uses process mining techniques and attempts to extract non-trivial and useful information from the so-called “event-logs” [4]. In fact, the process mining techniques use event logs as input in order to obtain the process model itself and, in particular, ProM offers many techniques to obtain the process model and the result may be a Petri net, EPC or a YAWL model. Otherwise, if the model is already given, the information stored in logs, can be used to check conformance, that is how well do reality and model fit together. This aspect can be seen as another quality dimension. Last but not least, ProM offers various
23
plug-ins to analyze the correctness of a model like soundness and absence of deadlocks and also allows the calculation of various quality metrics like cohesion, complexity, size, etc.
24
Chapter 3
Requirement Analysis
Considering the situation of the Business Process metrics and the software
related to them, that were outlined in the previous chapter, in this chapter are
explained the goals of the thesis, the project constraints and the few user
requirements that are needed for a correct use of the BPMETRICS application and
understanding correctly the metrics and their results.
3.1 Goals
The main goal of the thesis is to create a software application named BPMETRICS, that allows the assessment of Business Process Model in XPDL
format, using quality metrics.
In order to achieve this goal, the work was divided into several parts:
• First of all, a literature search was performed of all available metrics for business process and part of these have been chosen only if they were "internal" metrics and considering their feasibility in terms of software development. Next, was performed an analysis phase in which were identified the characteristics of the system to be realized, both for the standalone version and for the web version.
• Next, we developed the BPMETRICS application, standalone version, that
implements the metrics selected and which are described in Chapter 4.
• Subsequently was developed the BPMETRICS application, web version.
Finally, both the applications have been tested using some XPDL files created using the software TWE or publicly available on the website of the WfMC.
25
3.2 Project Constraints
The design constraints, that during the analysis phase of the problem have been imposed, concern for the most the technological part of the project. In fact, as design constraints, were imposed the use of Java as the programming language
to build the BPMETRICS application standalone version and as consequence the
use of the JSP technology to build the web version one.
As regards instead the Business Processes, have been required the use of the language XPDL as regards the definition of business process and consequently the BPMN notation for the creation of graphs. Now the constraints and their motivations will be described in detail.
3.2.1 Java
Java is the programming language Object Oriented used for the development of
the application BPMETRICS.
Java was imposed as Project Constraints due to his strengths. In fact, as
object-oriented programming language provides a high portability, allowing software to be made independent of the platform and the hardware on which it was made. Despite the high portability, maintains optimum performance and a good flexibility with regard to the graphics, desktop GUIs and web user interfaces. To remember, even the very good and well-thought-out exception handling and the huge library choice that Is available, like for example those aimed at the creation and manipulation of XML and PDF documents.
For the development of the BPMETRICS application was used Eclipse as working
environment.
Finally, the last thing to consider is the fact that both Java and Eclipse are free and OpenSource.
26
3.2.2 XPDL
Xml Process Definition Language was imposed as Project Constraints for the Business Process part due to the fact that it’s a standard file format for persisting BPMN diagrams and interchanging Process definitions and especially the BPMETRICS application supports the XPDL version 2.0 and XPDL version 2.1. In details, XPDL provides a standard graphical approach to Business Process Definition based on BPMN graphics. The file format is based on the WfMC meta-model which establishes a framework for defining, importing and exporting process definitions for numerous products including execution engines, simulators, BPA modelling tools, Business Activity Monitoring and reporting tools. One of the key elements of XPDL is its extensibility to handle information used by a variety of different tools. XPDL may never be capable of supporting all additional information requirements in all tools and that XPDL is a generic construct that supports vendor specific attributes for use within the common representation. Another characteristic is the possible mappings to specific execution languages (e.g. BPEL) and other XML-based specifications (e.g. ebXML). Finally, BPMN Model Portability conformance classes greatly increase the likelihood of true portability at the design level between a significant number of different vendor tools.
27
3.3 User Requirements
Below are listed the user requirements in order to use correctly the software and understand the results.
• The user must have knowledge, even basic, on the features and elements of the XPDL language, in order to understand certain metrics.
• The user must have knowledge regarding the Business Process Model Notation as it's necessary for the realization of business process which will then be used for the calculation of the metrics.
• Knowledge and meanings of the metrics proposed. For this purpose the application, both web and standalone version, offers a help section that allows the user to easy understand the meaning of each metric.
28
Chapter 4
Design Choices
In this chapter are discussed the design choices made during the realization of the BPMETRICS applications. All the choices are grouped into two categories: Software and Metrics. Both the groups are now explained in details.
4.1 Software
This groups relates to all those choices that are related to the technologies, libraries or frameworks used for the development of the application and to all the external software used to create test cases.
4.1.1 Together Workflow Editor
Together Workflow Editor (TWE) is the Workflow editor selected for the project as it fully implement the WfMC (Workflow Management Coalition) XPDL specifications. The TWE software was used to produce several Business Process Model that were used during the development phase but especially for the testing phase to check the correctness of the metrics developed.
Among all the various workflow editors, TWE was chosen for some of its characteristics:
• Pure Java application, usable on almost every operating system • Transient XPDL package references
• View Referring elements for an XPDL elements
• On-line documentation including XPDL explanations and configuration • Possibility to customize XPDL element's property panels
29
• View relation between main XPDL package and its external packages • In-line property panels for editing XPDL
• Save XPDL with XPDL namespace prefix
4.1.2 Libraries and Framework
The framework and libraries used for the development of the BPMETRICS
application will be now explained, defining also the reasons for which were chosen.
• Struts2 is the framework used to develop the BPMETRICS application
web version. In fact Struts 2 is an elegant, extensible framework for creating enterprise-ready Java web applications. This framework is designed to streamline the full development cycle, from building, to deploying, to maintaining applications over time.
• iText is the Java library used by the BPMETRICS application to generate
the PDF reports of the metrics computed. This library was chosen for the BPMETRICS because it is used both in the standalone version and in the web version. It also allows the creation of dynamic PDF in an easy and intuitive way from a data structure in Java.
• JAXB (Java Architecture for XML Binding) is a Java libraries that allows developers to map Java classes to XML representations. JAXB provides two main features: the ability to marshal Java objects into XML and the inverse. In other words, JAXB allows storing and retrieving data in memory in any XML format, without the need to implement a specific set of XML loading and saving routines for the program's class structure.
30
JAXB is particularly useful when the specification is complex and changing. In such a case, regularly changing the XML Schema definitions to keep them synchronized with the Java definitions can be time consuming and error prone. This library is used inside the BPMETRICS to generate the XML reports of the metrics computed.
• SAX (Simple API for XML) is a programming interface, implemented in different languages, that allows to read and modify XML documents. Through SAX it's possible to implement specific XML parsers. SAX is
used by the BPMETRICS application to load the XPDL file and convert it
into the specific designed data structure (Chapter 5.2) and was preferred instead of DOM since SAX parsers have some benefits over DOM-style parsers:
o SAX is event based, unlike DOM, and reacts to parsing events making report to the application.
o A SAX parser only needs to report each parsing event as it happens, and normally discards almost all of that information once reported while a DOM parser builds a tree representation of the entire document.
o The minimum memory required for a SAX parser is proportional to the maximum depth of the XML file and the maximum data involved in a single XML event while DOM parsers memory usage increases with the entire document length. This takes considerable time and space for large documents, like XPDL files.
o SAX has better performance with large files due to its event-driven nature and processing documents is generally far faster than DOM-style parsers.
31
4.2 Metrics
The metrics that have been collected, selected and implemented are divided into 4 categories:
• Activity Metrics, that consider only the activities in a Business Process • Control Flow Metrics, that are defined on the pure static structure of the
graph of a Business Process.
• Data Flow Metrics, that consider the flow of information among the several activities involved in the graph of a Business Process.
• Resource Metrics, that consider the resources involved and used by the graph of a Business Process during the execution.
The metrics implemented and available within the application are the following:
• Activity Size • Data Flow Size • Data Flow Coupling • Resources Size • Resources Coupling • Event Size
• Start Event Size • End Event Size
• Intermediate Event Size • Connector Size
• And Split Size • And Join Size
32 • Or Split Size
• Or Join Size • Xor Split Size • Xor Join Size • Control Flow Size
• Control Flow Complexity • Diameter
• Density
• Coefficient of Connectivity • Activity coupling
• Degree of Connectors
• Maximum Degree of Connector • Separability • Sequentiality • Depth • Average Depth • Connector Mismatch • Connector Heterogeneity • Cycility • Token Split
The metrics listed above will now be presented individually with a detailed description.
4.2.1 Activity Size
The Activity Size [3] metric represents the number of tasks of the Business Process. We must also consider that a BP may contain one (or more) supertask
33
or one (or more) subprocess and then we must consider the number of tasks contained by them. In fact, the size of a process is as follows:
𝑆𝑖𝑧𝑒! 𝑝 = 𝑆𝑖𝑧𝑒!(𝑡𝑎𝑠𝑘!) !! !!! + 𝑆𝑖𝑧𝑒!(𝑠𝑢𝑝𝑒𝑟𝑡𝑎𝑠𝑘!) !!" !!! (4.1)
where 𝑆𝑖𝑧𝑒! 𝑡𝑎𝑠𝑘! = 1 and 𝑆𝑖𝑧𝑒!(𝑠𝑢𝑝𝑒𝑟𝑡𝑎𝑠𝑘!) is the sum of the sizes of the
n tasks in the supertask.
4.2.2 Data Flow Size
The data-flow size represent the amount of data (number of data items) managed by a process. As reported in [3], the data that a process could manage are divided in 4 kinds:
• Reference: these data (DR) univocally identify a process instance and the path followed by these data is the control flow of the graph of a Business Process.
• Operational: these data (DO) are needed by an activity for its processing and, in general, are not visible outside the task itself;
• Decision: these data (DD) are a subset of the operational data and are used by routing tasks to selectively activate the outgoing/incoming arc of the graph;
• Contextual: these data (DC) belong to a wider category of data, are relevant for the Business Process and typically include all the data managed by all the tasks of the process.
34 𝑆𝑖𝑧𝑒𝐷𝐹 𝑝 = 𝑉!,!! !! !!! = 𝐷𝑅!,!! !! !!! + 𝐷𝑂!,!! !! !!! + 𝐷𝐶!,!! !! !!! (4.2)
where 𝑛! is the number of activities of the process and 𝑉!,!! is the data recieved
and produced by the node j.
4.2.3 Data Flow Complexity
The Data Flow Complexity take in consideration the data managed by a process but it treat this data in a different way that the Data Flow Size metric do. In fact this metric takes into consideration both a component deriving from the routing tasks and a component deriving from the tasks which set up a Business Process. As [3] states, this distinction is made due to the fact that routing task (RT) have a lower complexity if compared with a normal task (T) with the resulting overall complexity for data flow defined as the sum of the 2 components:
𝐶𝑜𝑚𝑝𝑙𝑒𝑥𝑖𝑡𝑦!" 𝑝 = 𝐶𝑜𝑚𝑝𝑙𝑒𝑥𝑖𝑡𝑦!" 𝑅𝑇! + !!" !!! 𝐶𝑜𝑚𝑝𝑙𝑒𝑥𝑖𝑡𝑦!" 𝑇! !! !!! (4.3) where 𝐶𝑜𝑚𝑝𝑙𝑒𝑥𝑖𝑡𝑦!" 𝑅𝑇! = 1 𝐶𝑜𝑚𝑝𝑙𝑒𝑥𝑖𝑡𝑦!" 𝑇! = 𝑉!,!! (4.4)
35
4.2.4 Resources Size
The Resource Size [3] take into consideration all the resources required and used by the graph of a Business Process during process execution and is defined as follow:
𝑆𝑖𝑧𝑒! 𝑝 = 𝑟!
!!
!!!
= 𝑅 (4.5)
where 𝑛! is the number of activities of the process and 𝑅 are the resources
available for the excution of the activities.
4.2.5 Resources Coupling
The Resource Coupling [3] is a metric that put in relation the “resources” and the relation between the activities within them. In fact, it considers the number of arcs which cross two (or more) swim lanes: every crossing means that the work item requires a new and different resources for its execution.
𝐶𝑜𝑢𝑝𝑙𝑖𝑛𝑔! 𝑝 = 𝐻 (4.6)
where H is the number of the transition between two activities that belong to a different swim lane.
4.2.6 Event Size
The Event Size [5] is a metric that counts the number of the Events in the Business Process.
36 𝑆𝑖𝑧𝑒! 𝑝 = 𝑆𝑖𝑧𝑒! 𝑡 !∈!"#$% (4.7) where 𝑆𝑖𝑧𝑒! 𝑡 = 1 (4.8)
4.2.7 Start Event Size
The Start Event Size [5] is a metric that counts the number of the Start Events in the Business Process.
𝑆𝑖𝑧𝑒!" 𝑝 = 𝑆𝑖𝑧𝑒!" 𝑡 !∈!"#$%!!"#$"
(4.9)
where
𝑆𝑖𝑧𝑒!" 𝑡 = 1 (4.10)
4.2.8 End Event Size
The End Event Size [5] is a metric that counts the number of the End Events in the Business Process.
𝑆𝑖𝑧𝑒!! 𝑝 = 𝑆𝑖𝑧𝑒!! 𝑡 !∈!"#$%!!"# (4.11) where 𝑆𝑖𝑧𝑒!! 𝑡 = 1 (4.12)
37
4.2.9 Intermediate Event Size
The Intermediate Event Size [5] is a metric that counts the number of the Intermediate Events in the Business Process. An Intermediate Event is an event that occurs after a Business Process has been started. It will affect the flow of the process, but will not start or directly terminate the process. Then, this type of event can be used to disrupt the normal flow through exception handling or show the extra work required for compensation. It’s also used to show where messages that are expected or sent within the process or where delays are expected within the process.
𝑆𝑖𝑧𝑒!" 𝑝 = 𝑆𝑖𝑧𝑒!" 𝑡 !∈!"#$%!!"#$%&$'!(#$ (4.13) where 𝑆𝑖𝑧𝑒!" 𝑡 = 1 (4.14)
4.2.10 Connector Size
The Connector Size [5] metric counts the number of connectors, divided in And, Or and Xor. 𝐶𝑜𝑛𝑛𝑒𝑐𝑡𝑜𝑟𝑆𝑖𝑧𝑒 𝑝 = 𝑆𝑖𝑧𝑒!"# 𝑟𝑡 !"∈!"# + 𝑆𝑖𝑧𝑒!" 𝑟𝑡 !"∈!"!!"#$% + 𝑆𝑖𝑧𝑒!"# 𝑟𝑡 !"∈!"# (4.15)
38 where 𝑆𝑖𝑧𝑒!"# 𝑟𝑡 = 1 𝑆𝑖𝑧𝑒!" 𝑟𝑡 = 1 𝑆𝑖𝑧𝑒!"# 𝑟𝑡 = 1 (4.17)
4.2.11 And Split Size
The And Split Size metric [5] counts the number of And Split connectors.
𝑆𝑖𝑧𝑒!" 𝑝 = 𝑆𝑖𝑧𝑒!"#!!"#$% 𝑟𝑡 !"∈!"#!!"#$%
(4.18)
where
𝑆𝑖𝑧𝑒!"#!!"#$% 𝑟𝑡 = 1 (4.19)
4.2.12 And Join Size
The And Join Size metric [5] counts the number of And Join connectors.
𝑆𝑖𝑧𝑒!" 𝑝 = 𝑆𝑖𝑧𝑒!"#!!"#$ 𝑟𝑡 !"∈!"#!!"#$
(4.20)
where
39
4.2.13 Or Split Size
The Or Split Size metric [5] counts the number of Or Split connectors.
𝑆𝑖𝑧𝑒!" 𝑝 = 𝑆𝑖𝑧𝑒!"!!"#$% 𝑟𝑡 !"∈!"!!"#$% (4.22) where 𝑆𝑖𝑧𝑒!"!!"#$% 𝑟𝑡 = 1 (4.23)
4.2.14 Or Join Size
The Or Join Size metric [5] counts the number of Or Join connectors.
𝑆𝑖𝑧𝑒!" 𝑝 = 𝑆𝑖𝑧𝑒!"!!"#$ 𝑟𝑡
!"∈!"!!"#$ (4.24)
where
𝑆𝑖𝑧𝑒!"!!"#$ 𝑟𝑡 = 1 (4.25)
4.2.15 Xor Split Size
The Xor Split Size metric [5] counts the number of Xor Split connectors.
𝑆𝑖𝑧𝑒!" 𝑝 = 𝑆𝑖𝑧𝑒!"#!!"#$% 𝑟𝑡 !"∈!"#!!"#$%
40 where
𝑆𝑖𝑧𝑒!"#!!"#$% 𝑟𝑡 = 1 (4.27)
4.2.16 Xor Join Size
The Xor Join Size metric [5] counts the number of Xor Join connectors.
𝑆𝑖𝑧𝑒!" 𝑝 = 𝑆𝑖𝑧𝑒!"#!!"#$ 𝑟𝑡 !"∈!"#!!"#$
(4.28)
where
𝑆𝑖𝑧𝑒!"#!!"#$ 𝑟𝑡 = 1 (4.29)
4.2.17 Control Flow Size
The Control Flow Size [3] of a process is defined as the number of activities and control elements of a process.
𝑆𝑖𝑧𝑒!" 𝑝 = 𝑆𝑖𝑧𝑒!"(𝑡!) !! !!! + 𝑆𝑖𝑧𝑒!"(𝑟𝑡!) !! !!! (4.30) where 𝑆𝑖𝑧𝑒!" 𝑡! = 1 𝑆𝑖𝑧𝑒!" 𝑟𝑡! = 1 (4.31)
41
4.2.18 Control Flow Complexity
The Control Flow Complexity [3] for a process p is the sum of the complexities originated by the splits as:
𝐶𝑜𝑚𝑝𝑙𝑒𝑥𝑖𝑡𝑦!" 𝑝 = 𝐶𝐹𝐶!"#!!"#$% 𝑟𝑡 !"∈!"#!!"#$% + 𝐶𝐹𝐶!"!!"#$% 𝑟𝑡 !"∈!"!!"#$% + 𝐶𝐹𝐶!"#!!"#$% 𝑟𝑡 !"∈!"#!!"#$% (4.32) where 𝐶𝐹𝐶!"#!!"#$% 𝑟𝑡 = 1 𝐶𝐹𝐶!"!!"#$% 𝑟𝑡 = 2!"#!!"#(!")− 1 𝐶𝐹𝐶!"#!!"#$% 𝑟𝑡 = 𝑓𝑎𝑛 − 𝑜𝑢𝑡(𝑟𝑡) (4.33)
fan-out is the number of task to which it is connected
4.2.19 Diameter
The Diameter [5, 28, 12] of a Business Process is the length of the longest path from a start node to an end node in the process model.
42
4.2.20 Density
The Density [5, 29] of a process graph is the number of arcs (A) divided by the number of the maximum number of arcs for the same number of nodes (N):
Δ 𝐺 = |𝐴|
𝑁 ∙ ( 𝑁 − 1) (4.34)
4.2.21 Coefficient of Connectivity
The Coefficient of Connectivity (CNC) [5, 13, 26] represents the ration of arcs (A) to nodes (N).
𝐶𝑁𝐶 𝐺 = |𝐴|
|𝑁| (4.35)
4.2.22 Activity Coupling
The Activity Coupling (NCA) [5, 17] represents the ratio of nodes to arcs.
𝑁𝐶𝐴 𝐺 = |𝑁|
|𝐴| = 1
𝐶𝑁𝐶 (4.36)
4.2.23 Degree of Connectors
The Degree of a Connector [26, 30] is the number of nodes a connector is connected to. Two metrics relate to this concept:
43
• Average Degree of Connectors that represent the number of nodes a connector is in average connected to.
𝑑! 𝐺 = 1
𝐶 𝑑(𝑐)
!∈!
(4.37)
• The Maximum degree of a connector that is the highest degree of a connector inside a process.
𝑑! 𝐺 = max 𝑑 𝑐 𝑐 ∈ 𝐶} (4.38)
4.2.24 Separability
The Separability metric [5] is defined as the number of cut-vertices, that are those nodes in a graph whose deletion separates the process models into multiple and separated components, to the number of nodes.
Π 𝐺 = | 𝑛 ∈ 𝑁 𝑛 𝑖𝑠 𝑐𝑢𝑡 − 𝑣𝑒𝑟𝑡𝑒𝑥 }
𝑁 − 2 (4.39)
4.2.25 Sequentiality
The Sequentiality metric [5, 12] is the number of arcs between non-connectors nodes divided by the number of arcs.
44
4.2.26 Depth
The Depth metric [5, 28] relates to the maximum nesting of structured blocks in a process. To calculate depth is define an algorithm that calculates the in-depth 𝜆!" 𝑛 of a node 𝑛 relative to its predecessor nodes 𝑛. All nodes are initialized with an in-depth value of 0 and at each node the updates the in-depth value 𝜆′!" 𝑛 following these rules:
𝜆! !" 𝑛 = max 𝜆!" 𝑛 , 𝜆!" 𝑝𝑟𝑒 + 1 𝑖𝑓 𝑝𝑟𝑒 ∈ 𝑆 ∧ 𝑛 ∉ 𝐽 max 𝜆!" 𝑛 , 𝜆!" 𝑝𝑟𝑒 𝑖𝑓 𝑝𝑟𝑒 ∈ 𝑆 ∧ 𝑛 ∈ 𝐽 max 𝜆!" 𝑛 , 𝜆!" 𝑝𝑟𝑒 𝑖𝑓 𝑝𝑟𝑒 ∉ 𝑆 ∧ 𝑛 ∉ 𝐽 max 𝜆!" 𝑛 , 𝜆!" 𝑝𝑟𝑒 − 1 𝑖𝑓 𝑝𝑟𝑒 ∉ 𝑆 ∧ 𝑛 ∈ 𝐽 (4.41) where
• S is the set of Splits • J is the set of Joins
• 𝜆!!" 𝑛 is the new in in-depth value
• 𝜆!" 𝑝𝑟𝑒 is the in-depth value of the previously visited predecessor node • 𝜆!" 𝑛 is the current in-depth value
There are two metrics related to this concept:
• Average Depth Λ 𝐺 = 1 |𝑁| 𝜆! ! !!! (𝑛) (4.42) • Maximum Depth Λ G = max 𝜆 𝑛 𝑛 ∈ 𝑁 } (4.43)
45
4.2.27 Connector Mismatch
The Connector Mismatch metric (MM) [5] gives the sum of the mismatches for each connector type.
𝑀𝑀 𝐺 = 𝑀𝑀!"+ 𝑀𝑀!"# + 𝑀𝑀!"# (4.44) where 𝑀𝑀! = | 𝑑 𝑐 ! ∈ !! − 𝑑 𝑐 ! ∈ !! | (4.45)
4.2.28 Connector Heterogeneity
The Connector heterogeneity metric (CH) [5] refers to which extent different connectors are used in a business process model. For defining a suitable metric that ranges from 0 in the case that there are only connectors of one type, to 1 in the case that there are the same amount of connectors of all three types, we refer to the information entropy measure which has exactly these characteristics and defined as follows: 𝐶𝐻 𝐺 = − 𝑝 𝑙 ∙ log!𝑝(𝑙) !∈{!"#,!",!"#} (4.46) where 𝑝 𝑙 = |𝐶!| |𝐶| (4.47)
46
4.2.29 Cyclicity
The Cyclicity metric [5] represent the ratio between the nodes on a cycle and the total number of nodes.
𝐶𝑌𝐶! = |𝑁!|
|𝑁| (4.48)
4.2.30 Token Split
The Token Split metric [5] sums up the output-degree 𝑑!"# 𝑛 of AND-splits
and OR-splits minues one.
𝑇𝑆 𝐺 = 𝑑!"# 𝑛 − 1
!∈!!"∪!!"#
47
Chapter 5
Description of the System
Based on the specifications of the XPDL Workflow Management Coalition, has been implemented a Java application and a Web application, both named BPMETRICS, which are able to parse a XPDL file version 2.0 or 2.1 and evaluate those metrics that have been described in the chapter 4. However, this chapter describes the architecture of the application common to both versions, the data structure at the base of the application and two different algorithms that are used for the calculation of some metrics.
5.1 Architecture
The application that has been made, implements the metrics that have been described in Chapter 4 and in particular receives as input the XPDL file, created by the user with external software, and provides as output the metrics that are selected by the user.
This application has been made as a stand-alone application and as a Web Application.
Both applications made are divided into three main modules:
• Parsing in which has been implemented a parser dedicated to the XPDL files which converts the XPDL file contents in a data structure created specially to be able to compute the metrics;
• Metrics is the module in which the metrics have been implemented; • Reports is the module in which have been implemented the two modes
of reporting, as PDF file or as XML file, the results obtained by the application.
48
All three modules have been made in order to reduce the computational load and make the execution as light as possible to achieve the best performance of each of the modules. In particular way, in the Parsing module was used SAX and not DOM as the method for XPDL file parsing since SAX is way better then DOM for XPDL files ( See Chapter 4.1.2), thus reducing the computational load of the first module. In the second module the metrics were implemented with algorithms that aim to optimize and reduce the computational costs since the metrics are calculated on a graph-based structure.
Communication via these modules is made through the data structure, designed ad hoc for this application, which is explained below.
5.2 Data Structure
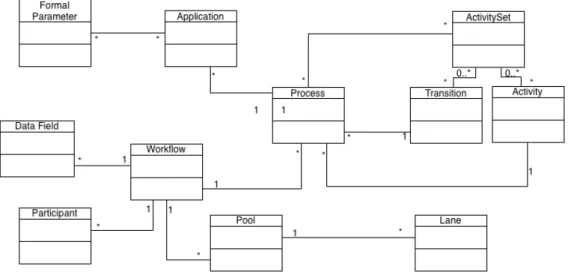
Once the XPDL file is loaded and read by the SAX parser, it needs to be converted into a proper data structure in order to easy access the data contained from the source code. For this reason, an ad hoc data structure was created in order to store all the information that could be gathered from the XPDL file (Figure 5.1).
49
The main entities of this structure are Process, Activity and Transition which respectively represent the generic process defined within a workflow, a generic activity contained within a process and a generic transition that binds two activity.
In particular, all these classes, except the Workflow, refer to a superclass called XPDLElement that defines the attributes common to all elements extracted from the XPDL file.
Below are described in detail the classes represented in the diagram.
Workflow This class represent the whole XPDL file. This class has as only attribute the xpdlVersion of the file. This class contains a list of Process, a list of Pool, a list of Participant and a list of Data Field.
XPDLElement This is an abstract class and represent the generic XPDL element
except for the Workflow. The most significant attributes of this class are:
• id: is an attribute of type string that represents the unique id of the XPDL element to which it refers.
• name: this is an attribute of type string identifies the visual name of
XPDL element.
Process This is a class that inherits from XPDLElement and defines a generic process defined in XPDL file read by the parser. This class contains a list of Activity and a list Transition.
Activity Even this class inherits from XPDLElement and represents the generic entity or node defined within a single process XPDL. This class contains lists of Extended Attribute and Parameter Actual that are used by the same Activity. The most significant attributes of this class are:
50
• isRouting: is a boolean attribute and identifies whether the node is a routing task or a simple task;
• routingType: is an attribute of type String and it identifies the type of routing element, that is if the routing task type is Exclusive (XOR), Parallel (AND) or Inclusive (OR)
• routingPosition: it is also an attribute of type String and it indicates the position of ruoting task in the Control Flow of the process, which indicates whether the routing task is a split or a join.
• startEvent, endEvent, intermediateEvent: These attributes are Boolean and respectively indicate whether the node/element in the process is a start event, an end event or an intermediate event.
• subProcessId: is an attribute of type String and indicates the sub-process id when the element is not a simple activity within the process but it represents a subprocess.
Transition This is a class that inherits from the generic XPDLElement and represents the transition between two entities or nodes within a process. The most significant attributes of this class are:
• from: this is an attribute of type String indicating the start activity of the transition.
• to: is an attribute of type String indicating the destination activity of the
transition.
Participant This is a class that inherits from the generic XPDLElement and
its definition represents an abstraction level between the real performer and the activity, which has to be performed. Only during run time this definition is evaluated and assigned to concrete humans and/or programs.
51
Pool This is a class that inherits from the generic XPDLElement and it
represents a Participant in the process that can be a specific business entity or a more general business role. The Pool class contains the list of the lanes in which the it’s divided and is characterized by these attributes:
• mainPool: this is a boolean attribute indicating if the pool is the main pool or not.
• Process: this is a String type attribute that indicates to which process the pool refers.
Lane Also this class inherits from the generic XPDLElement and it represent a
sub-partition within a Pool. Lanes are often used for such things as internal roles and systems. The only attribute that the Lane class has is the performer attribute that indicates who is performing the activities within the lane.
DataField This is a class that inherits from the generic XPDLElement and it provides information about what the process does.
Application This is a class that inherits from the generic XPDLElement and it
represents an application/service or tool required and invoked by the process defined within the process definition.
Formal Parameter This is a class that inherits from the generic
XPDLElement and it represents a parameter that can be used as attribute in process or in application. These parameters are passed during invocation and return of control. The relevant attributes of this class are:
• Mode: is a String attribute and it indicates if the attribute is given as input or as output.
52
Extended Attribute This is a class that inherits from the generic
XPDLElement and, as these attributes can be used in all entities (for this reason is not represented in the diagram), vendors use them to extend the functionality of the specification to meet individual needs. The only relevant attribute of this class is the value one that, as String attribute, indicates the value of the extended attribute defined in the XPDL file.
ActivitySet Also this class inherits from the XPDLElement class and it represent a self-contained set of activities and transitions. In particular the transitions in the set should refer only to activities in the same set and there should be no transitions into or out of the set.
5.3 Algorithms
In this section will be described two particular algorithms that are used for the calculation of the metrics. Respectively will be described the algorithm for the calculation of control flow paths within an oriented graph and the algorithm for the calculation of cut vertices inside an oriented graph.
5.3.1 Paths
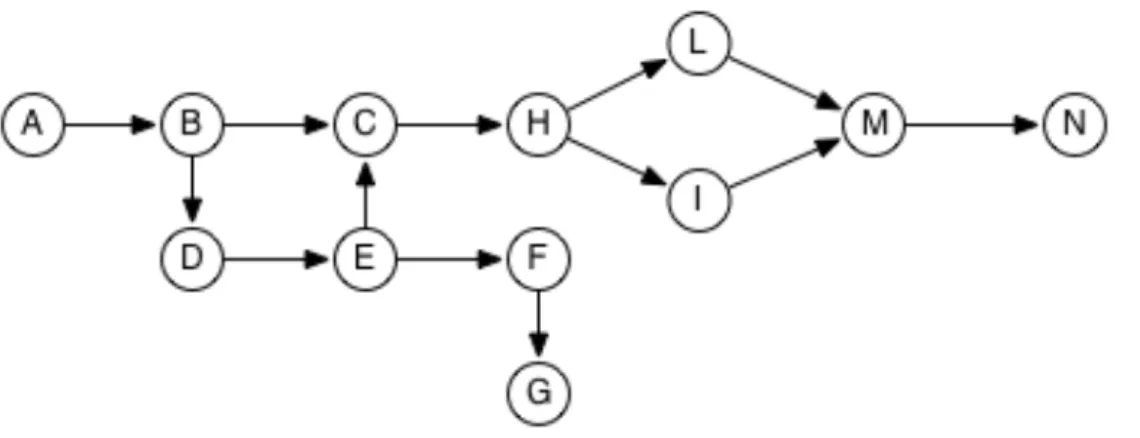
The algorithm Path, implemented within the application, is used for the calculation of multiple metrics such as Diameter, Cyclicity and Depth. This algorithm allows to calculate all non-cyclic and cyclic paths, which has the beginning of a Start Event (node A in Figure 5.2) as a term and an End Event (nodes G and N in Figure 5.2), that exist within a directed graph, which in our case represent the XPDL process.
53
Figure 5.2 Graph based representation of a possible XPDL process
Below is reported the pseudo-code of the algorithm for the calculation of the path.
//Initialization of the variables
finalPaths[] = {}; // Path StartEvent-EndEvent
cyclicPaths[] = {}; // Cyclic Paths
currentPaths[] = {}; // Temporal Paths
startEvents = findStartEvents(process); transitions = process.getTransitions();
//Conversion of the Start Events into Graph Paths
currentPaths = convertStartEventToPath(startEvents);
//Analyzing the paths till each of them end with an EndEvent or is cyclic
while(currentPaths.size() > 0) { path = currentPaths.get(0);
lastVisitedActivity = path.getLastVisitedActivity();
if(lastVisitedActivity.isSubProcess()) {
// Computing the paths for the subprocess
subProcessPaths = computePaths(subProcess);
//Removing last element of the path as it stand for a sub-Process
path.remove(lastVisitedActivity);
//Creating a new path for each sub-Process path
for(i=0; i < subProcessPaths.size(); i++) {
clonedPath =clonePath(path,subProcessPaths.get(i));
//Scanning transitions outgoing lastVisitedActivity
for(j=0; j < transitions.size();j++) { transition = transitions.get(j);
if(transition.getFrom() == lastVisitedActivity) {
// Destination of the transition
transitionDestination = transition.getTo();
// Cloning the path for each outgoing transition
tempPath = clonePath(clonedPath, transitionDestination);
// If is an End Event the path is closed
if(isEndEvent(transitionDestination, process)) { finalPaths.add(tempPath);