The role of whole-grain barley on human fecal microbiota and metabolome
12 3
Maria De Angelisa, Eustacchio Montemurnob, Lucia Vanninic,d, Carmela Cosolab, Noemi 4
Cavalloa, Giorgia Gozzic, Valentina Maranzanob, Raffaella Di Cagnoa, Marco Gobbettia#, 5
Loreto Gesualdob 6
a
Department of Soil, Plant and Food Sciences, University of Bari Aldo Moro, Bari, Italy; 7
bDepartment of Emergency and Organ Transplantation, Nephrology Unit - University of Bari Aldo 8
Moro, Bari, Italy; 9
cDepartment of Agricultural and Food Sciences, University of Bologna, Bologna, Italy; 10
dInter-departmental Centre for Industrial Agri-Food Research, University of Bologna, Cesena, Italy 11
12 13
Running title: Whole-grain barley and human fecal microbiota
14 15
#Corresponding author: Marco Gobbetti, Department of Soil, Plant and Food Sciences, University 16
of Bari Aldo Moro, via Amendola 165/a, 70126 Bari, Italy, Tel.: +39.080.5442946; fax: 17
+39.080.5442911. E-mail address: [email protected] 18
19 20
AEM Accepted Manuscript Posted Online 18 September 2015 Appl. Environ. Microbiol. doi:10.1128/AEM.02507-15
2 ABSTRACT
21
This study aimed at comparing the fecal microbiota and metabolome of 26 healthy subjects before 22
(HS) and after (HSB) two months of diet intervention based on the administration of durum wheat 23
flour and whole-grain barley Pasta containing the minimum recommended daily intake (3 g) of 24
barley β-glucans. Metabolically active bacteria were analyzed through pyrosequencing of the gene 25
16S rRNA and community-level catabolic profiles. Pyrosequencing data showed that 26
Clostridiaceae (Clostridium orbiscindens, Clostridium sp.), Roseburia hominis, and Ruminococcus
27
sp. increased while other Firmicutes and Fusobacteria decreased in HSB compared to HS fecal 28
samples. Community-level catabolic profiles were the lowest in HSB. Compared to HS, cultivable 29
lactobacilli increased in HSB fecal samples while Bacteroides, Porphyromonas and Prevotella, 30
Enterobacteriaceae, total coliforms, and Pseudomonas, Alcaligenes and Aeromonas decreased.
31
Metabolome analyses were performed using amino acid analyzer and gas-chromatography mass 32
spectrometry-solid-phase micro-extraction. A marked increase of short chain fatty acids (SCFA) 33
such as 2-methyl-propanoic acid, acetic, butyric and propionic acids was found in HSB with respect 34
to HS fecal samples. Durum wheat flour and whole-grain barley Pasta containing 3% of barley β-35
glucans appeared to be effective in the modulation of the composition and the metabolic pathways 36
of the intestinal microbiota, leading to an increased level of SCFA. 37
INTRODUCTION 39
Whole-grain barley and oat, and some dry-milled bran grain products were authorized to be used 40
according to the health claim “decrease the risk of coronary heart disease” by Food and Drug 41
Administration (1, 2). Whole barley and oat flours contain β-glucans which are soluble dietary 42
fibers. European Food Safety Authority recognized that the “regular consumption of oat β-glucans 43
can actively lower/reduce blood LDL-cholesterol and total cholesterol (3). In addition to reduction 44
of cholesterol, the positive associations between the consumption of β-glucans and the 45
reduction/prevention of cardiovascular diseases, and reduction of glycemia, insulin resistance and 46
metabolic syndrome were well documented (4, 5). The minimum dose of 3 g/day of β-glucans is 47
recommended to get positive effects on human health (1, 3, 6). 48
Several mechanisms were described for explaining the hypocholesterolemic effect of β-glucans: (i) 49
increased viscosity at the level of the small intestine and, consequently, slowed gastric emptying, 50
digestion, and absorption of molecules, including glucose, dietary cholesterol and bile acids (7, 8); 51
(ii) decreased enter-hepatic bile acids by binding at intestinal level with subsequent increased use of 52
cholesterol for bile acids synthesis (9, 10); (iii) reduced synthesis of hepatic cholesterol due to the 53
improved insulin sensitivity (10, 11); and iv) inhibited hepatic synthesis of cholesterol by acetate 54
and propionate, which are produced by colonic fermentation of β-glucans (12, 13). Saccharolytic 55
and proteolytic fermentations are the major fermentation processes, which are carried-out by 56
metabolically active microbes at the colon level (14). Saccharolytic fermentation was associated 57
with the synthesis of short-chain fatty acids (SCFA) (acetate, propionate and butyrate), intermediate 58
metabolites such as succinate, acrylate, lactate, formate and ethanol, and small final molecules 59
(hydrogen, methane and carbon dioxide) (15). Proteolytic fermentation was associated with the 60
synthesis of SCFA (acetate, propionate and butyrate) and branched-chain fatty acid (BCFA) (iso-61
butyric, iso-valeric and 2-methylbutyric acids), free amino acids (FAA) and some potentially toxic 62
metabolites (phenols, indoles, ammonia and amines) (14, 16, 17). The type of colonic fermentation 63
is mainly depends on the type of microbiota and fermentable substrate availability (17). Based on 64
4 the key role for human healthy, the intestinal microbiota was acknowledged as a metabolic organ 65
(18). The major part of the current research on novel functional foods is moved towards the 66
selection and characterization of prebiotics (e.g. inulin, fructo-oligosaccharides and galacto-67
oligosaccharides), which are not digested by human gastrointestinal enzymes but selectively 68
stimulate the growth and/or activity of GRAS bacteria that may improve host health (19). Indeed, a 69
prebiotic effect of β-glucans towards the intestinal microbiota was also hypothesized (5). In 70
particular, the positive effect of β-glucans on the growth of beneficial intestinal lactobacilli and 71
bifidobacteria was shown by in vitro studies (20, 21) and animal experiments (22, 23). 72
Nevertheless, other studies that also used animal models did not show significant effects of β-73
glucans on lactobacilli and/or bifidobacteria (24, 25). Unfortunately, human clinical challenges that 74
have dealt with the prebiotic effect of β-glucans are rather scarce. Barley β-glucans increased the 75
cell density of colonic bifidobacteria on older healthy subjects (26). A pilot study with 76
polypectomized patients showed no significant effect of β-glucans on the fecal microbiota and the 77
concentration of SCFA (27). The evidence that β-glucans positively influence the human intestinal 78
microbiota is still insufficient or difficult to interpret, and additional studies are needed to fill this 79
gap (5). 80
This study compared the fecal microbiota and metabolome of healthy subjects before (HS) and after 81
(HSB) two months of daily administration of durum wheat flour and whole-grain barley Pasta 82
containing the minimum recommended intake (3 g) of β-glucans. The fecal microbiota was 83
characterized through integrated approaches, which were based on cultureindependent and -84
dependent methods. 85
MATERIALS AND METHODS 86
Subjects 87
The study was carried out in accordance with the Helsinki Declaration (IV Adaptation) and 88
European Guidelines for Good Clinical Practice. The protocol of the study was approved by the 89
Institutional Review Board of the Azienda Ospedaliero-Universitaria Consorziale Policlinico of 90
Bari, Italy (Authorization nr. 1570/2014). Written consents were obtained from all volunteers. One 91
groups of Caucasian HS (15 female and 11 male), aged between 28 and 57 years, were enrolled in 92
the study (Table 1). Exclusion criteria were history of gastro-intestinal disease, diabetes, 93
cardiovascular diseases, hyperlipidemia and consume of alcohol. Volunteers were not treated with 94
antibiotics and/or functional foods (probiotics and/or prebiotics) for at least three months before 95
recruitment and sampling. 96
Feeding regime 97
Pasta Granoro Cuore Mio (Granoro srl, Corato, BA) was used in this study. Pasta was made by 98
using a mixture of durum wheat flour (75%) and whole-grain barley flour (25%). The gross 99
composition of Pasta Granoro Cuore Mio was as follows: moisture, 11%; protein (N x 5.70), 11% 100
of dry matter; carbohydrate, 69% of dry matter; fat, 2% of dry matter; total fibres and β-glucans, 7% 101
and 3% of dry matter, respectively. Before starting with the administration of 100 g Pasta Granoro 102
Cuore Mio Pasta containing 3 g of barley β-glucans (Granoro srl), each volunteer was instructed to 103
follow the usual diet, including 100 g of Pasta every day for two months. Before and after the 104
dietary treatment, a food frequency questionnaire and a 24-h recall questionnaire were administered 105
to each volunteer by a dietitian. These two tools allowed to extrapolate the “weekly cumulative 106
frequency of food” and the “component intake” data, respectively (Table 1), by using official Italian 107
food composition databases (INRAN,
108
http://nut.entecra.it/646/tabelle_di_composizione_degli_alimenti.html and IEO, http://www.bda-109
ieo.it/uk/index.aspx). All volunteers confirmed that not remarkable changes occurred in meals and 110
medication during the two months of treatment. Additionally, a questionnaire aimed at evaluating 111
intestinal effects (bloating, meteorism, constipation, satiety, diarrhea, reflux and flatulence) was 112
administered (26). Gastrointestinal symptoms were graded from 0 (no symptoms) to 3 (severe 113
symptoms) (26). Before the treatment with durum wheat and whole-grain barley Pasta, 114
colesterolemia, body mass index, fecal microbiota and metabolome were determined. 115
6 Determination of blood cholesterol
116
The level of total cholesterol was measured on the Siemens Dimension RxL Max by using the 117
Siemens enzymatic methods (Siemens Medical Solution Diagnostics, Tarrytown, NY). LDL- and 118
HDL-cholesterol level was estimated by using the Friedewald equation (28) for value below 300 119
mg/dl. 120
Collection of fecal samples 121
Each volunteer had fasted overnight, and fecal sample was collected in the morning pre-prandial. 122
Fecal samples were collected on three different days of the same week. After collection, samples 123
were immediately mixed with RNA later (Sigma-Aldrich, St. Louis, MO, USA) (ca. 5 g, 1:2 wt/vol) 124
or Amies Transport medium (Oxoid LTD, Basingstoke, Hampshire, England) (ca. 15 g, 1:1 wt/wt), 125
under anaerobic conditions (AnaeroGen, Oxoid LTD, Basingstoke, Hampshire, England). Fecal 126
samples suspended in RNA later were stored at –80°C for further RNA and metabolomic analyses. 127
Samples diluted with Amies Transport medium were immediately subjected to plate counts and 128
analysis by Biolog system. 129
RNA extraction from fecal samples 130
An aliquot of ca. 200 mg of fecal sample diluted in RNA later was used for RNA extraction with 131
the Stool total RNA purification kit (Norgen Biotek Corp., Ontario, Canada, USA). Quality and 132
concentration of RNA extracts were determined using 1% agarose-0.5X TBE gels and 133
spectrophotometric measurements at 260, 280 and 230 nm through the NanoDrop ND-1000 134
Spectrophotometer. Total RNA extracted (ca. 2.5 µg) was transcribed to cDNA using random 135
examers and the Tetro cDNA synthesis kit from Bioline (Bioline USA Inc, Tanunton, MA, USA), 136
according to the manufacturer’s instructions (29). 137
Bacterial tag-encoded FLX amplicon pyrosequencing (bTEFAP) and data analyses 138
For each volunteer, the three cDNA samples were pooled and used for bTEFAP analysis. Pooled 139
samples cDNA were analyzed for each subject. bTEFAP was performed by Research and Testing 140
Laboratories (Lubbock, TX), according to standard laboratory procedures and using the 454 FLX 141
Sequencer (454 Life Sciences, Branford, CT, USA). Primers forward 28F: 142
GAGTTTGATCNTGGCTCAG and reverse 519R: GTNTTACNGCGGCKGCTG, based upon the 143
V1–V3 region (Escherichia coli position 27–519) of the 16 S rRNA gene, were used (30). The 144
bTEFAP procedures were performed based upon RTL protocols http://www.researchandtesting.com 145
(Research and Testing Laboratories, Lubbock, TX). Raw sequence data were screened, trimmed and 146
filtered with default settings, using the QIIME pipeline version 1.4.0 (http://qiime.sourceforge.net). 147
Chimeras were excluded by using the B2C2 (http://www.researchandtesting.com/B2C2.html) (31). 148
Sequences less than 250 bp were removed. The average length of the sequences was 484 bp. 149
Sequences are available at the http://www.researchandtesting.com/docs. FASTA sequences for each 150
sample, without chimeras, were evaluated using BLASTn against the database derived from 151
GenBank (http://ncbi.nlm.nih.gov) (32). 152
Bioinformatics and data analysis 153
The sequences were first clustered into Operational Taxonomic Unit (OTU) clusters with 97% 154
identity (3% divergence), using USEARCH (33). To determine the identities of bacteria, sequences 155
were first queried, using a distributed BLASTn.NET algorithm (33) against the database of high-156
quality 16S bacterial sequences that derived from NCBI. Database sequences were characterized as 157
high quality based on criteria, which were originally described by Ribosomal Database Project 158
(RDP, v10.28) (34). 159
Alpha diversity (rarefaction, Good’s coverage, Chao1 richness and Shannon diversity indices) and 160
beta diversity measures were calculated and plotted using QIIME. Diversity was examined from 161
two perspectives. First, overall richness (i.e., number of distinct organisms present within the 162
microbiome) (alpha diversity), was expressed as the number of OTU, and was quantified using the 163
Chao1 richness estimator: Schao1 = Sobs + ( )
( )
164
where ni is the number of OTU with abundance i.
8 Second, overall diversity (which is determined by both richness and evenness, the distribution of 166
abundance among distinct taxa) was expressed as Shannon Diversity. Shannon diversity (H’) is 167
calculated using:
H’= - ∑
( )
168where R is richness and pi is the relative abundance of the ith OTU. 169
Measures of diversity were screened for group differences using an analysis of variance (ANOVA). 170
Multivariate differences among groups were evaluated with "Permutational Multivariate Analysis 171
of Variance Using Distance Matrices," function adonis (35). For ADONIS, distances among 172
samples were calculated using un-weighted or weighted UniFrac, and then an ANOVA-like 173
simulation was conducted to test for group differences. In addition, multivariate differences were 174
assessed using "Analysis of Similarities," function anosim (35). Sequence data were processed 175
using a Research and Testing pipeline that is described at 176
http://www.researchandtesting.com/docs/Data_Analysis_Methodology.pdf. Spearman correlations 177
were computed between OTU and metabolite concentration. All analyses were conducting in R, 178
using the vegan (35), labdsv (36), DESeq2 (37), and phyloseq (38) packages. 179
Community-level catabolic profiles (CLCP) 180
Carbon source utilization patterns of the fecal microbiota were assessed using Biolog 96-well Eco 181
micro-plates (Biolog, Inc., Hayward, CA, USA) (39). Micro-plates contained 31 different carbon 182
sources (carbohydrates, carboxylic acids, polymers, amino acids, amines, and miscellaneous 183
substrates) in triplicate. Five grams of feces diluted with Amies Transposrt medium (1:1) were 184
homogenized in a filter bag with 45 mL of sterile sodium chloride (0.9% (wt/vol)) solution (Classic 185
Blender) to remove solid particulate of feces. The homogenized feces were centrifuged at 11.000 186
RPM for 15 min at 4°C. The pellet was washed with 50 mM Tris-HCl (pH 7.0), then with sterile 187
sodium chloride solution and centrifuged at 11.000 RPM for 15 min at 4°C. The cellular suspension 188
was diluted (1:10) into the sterile sodium chloride solution and, subsequently, centrifuged at 2000 189
RPM for 2 min at 4°C. The cellular suspension was diluted (1:20) into sterile chloride solution and 190
dispensed (150 µL) into each of the 96 wells of the Biolog Eco micro-plates. The micro-plates were 191
incubated at 37°C in the dark, under anaerobic conditions and slowly stirring. The color 192
development was measured at 590 nm every 24 h with a micro-plate reader (Biolog Microstation). 193
Three indices were determined (40). Shannon’s diversity (H’), indicating the substrate utilization 194
pattern, was calculated as follows: 195
H’= - Σ p
iln (p
i)
(1)196
where pi is the ratio of the activity of a particular substrate to the sums of activities of all substrates
197
at 120 h. Substrate richness (S), measuring the number of different substrates used, was calculated 198
as the number of wells with a corrected absorbance higher than 0.25. Substrate evenness (E) was 199
defined as the equitability of activities across all utilized substrates: 200
E = H’/log S
(2)201
Enumeration of cultivable bacteria 202
Diluted fecal samples (20 g) were mixed with 80 ml sterilized physiological solution and 203
homogenized. Counts of viable bacterial cells were carried out as described by De Angelis et al. 204
(41). The following selective media were used: Wilkins-Chalgren anaerobe agar (total anaerobes); 205
MRS agar (Enterococcus and Lactobacillus); Slanetz and Bartley (Enterococcus); Rogosa agar, 206
plus 1.32 ml/l of glacial acetic acid (Lactobacillus); M17 (Lactococcus and Streptococcus); Baird 207
Parker (Staphylococcus); Wilkins-Chalgren anaerobe agar, plus GN selective supplements and 208
sheep blood defibrinated (Bacteroides, Porphyromonas and Prevotella); MacConkey agar No2 209
(Enterobacteriaceae); Chromocult (total coliform) (Merk, Darmstadt, Germany, Europe); GSP agar 210
(Sigma-Aldrich, St. Louis, MO, USA), plus penicillin-G (60 g/l) (Pseudomonas, Alcaligenes and 211
Aeromonas); Bifidobacterium agar modified (Bifidobacterium) (Becton Dickinson, Le Pont de
212
Claix, SA, France); and Hoyle medium (Corynebacterium). Except for Bifidobacterium agar 213
modified, Chromocult and GSP agar, all media were purchased by Oxoid Ltd (Basingstoke, 214
Hampshire, England). 215
Fecal concentration of free amino acids 216
10 FAA of fecal samples were analyzed through the Biochrom 30 series amino acid analyzer 217
(Biochrom Ltd., Cambridge Science Park, England ) with a sodium cation-exchange column (20 by 218
0.46 cm (inner diameter)). A mixture of amino acids at known concentrations (Sigma Chemical Co., 219
Milan, Italy) was added with cysteic acid, methionine sulfoxide, methionine sulfone, tryptophan, 220
ornithine, glutamic acid, and γ-amino-butyric acid and used as standard. Proteins and peptides in the 221
fecal samples were precipitated by addition of 5% (vol/vol) cold solid sulfosalicylic acid, holding 222
the samples at 4°C for 1 h, and centrifuging at 15,000 x g for 15 min. The supernatant was filtered 223
through a 0.22-µm-pore-size filter and when necessary diluted, with sodium citrate (0.2 M, pH 2.2) 224
loading buffer. Amino acids were post-column derivatized with ninhydrin reagent and detected by 225
absorbance at 440 (proline and hydroxyproline) or 570 (all the other amino acids) nm. 226
Gas-chromatography mass spectrometry-solid-phase microextraction (GC-MS/SPME) 227
analysis of fecal volatile compounds 228
After preconditioning, according to the manufacturer’s instructions, a 229
polydimethylsiloxane/Divinylbenzene fiber (65 μm) and a manual solid phase micro-extraction 230
(SPME) holder (Supelco Inc., Bellefonte, PA, USA) were used. Before headspace sampling, the 231
fiber was exposed to GC inlet for 1 h for thermal desorption at 250°C. Three grams of fecal sample 232
were placed into 10 ml glass vials and added of 10 μl of 4-methyl-2-pentanol (final concentration of 233
33 mg/l), as the internal standard. Samples were then equilibrated for 10 min at 40°C. SPME fiber 234
was exposed to each sample for 40 min. Both equilibration and absorption phases were carried out 235
with stirring. The fiber was then inserted into the injection port of the gas chromatograph for 10 min 236
of sample desorption. GC-MS analyses were carried out with an Agilent 7890A gas chromatograph 237
(Agilent Technologies, Palo Alto, CA) coupled to an Agilent 5975C mass selective detector 238
operating in electron impact mode (ionization voltage, 70 eV). A Supelcowax 10 capillary column 239
(length, 60 m; inside diameter, 0.32 mm; Supelco, Bellefonte, PA) was used. The temperature 240
program was 50°C for 1 min, followed by an increase at a rate of 4.5°C/min to 65°C, an increase at 241
a rate of 10°C/min to 230°C, and then 230°C for 25 min. The injector, interface, and ion source 242
temperatures were 250, 250, and 230°C, respectively. The mass-to-charge ratio interval was 30 to 243
350 Da at a rate of 2.9 scans per sec. Injection was carried out in splitless mode, and helium (flow 244
rate, 1 ml/min) was used as the carrier gas. Molecules were identified based on comparison of their 245
retention times with those of pure compounds (Sigma-Aldrich, Milan, Italy). Identities were 246
confirmed by searching mass spectra in the available databases (NIST, version 2005; Wiley, version 247
1996). Quantitative data for the compounds identified were obtained by interpolation of the relative 248
areas versus the internal standard area (42). All the GC-MS/SPME raw files were converted to 249
netCDF format via Chemstation (Agilent Technologies, USA) and subsequently processed by the 250
XCMS toolbox (http://metlin.scripps.edu/download/). XCMS software allows automatic and 251
simultaneous retention time alignment, matched filtration, peak detection, and peak matching. GC-252
MS/SPME data were organized into matrix for subsequent statistical analysis. 253
Statistical analysis 254
Culture dependent data were obtained at least in triplicates. The analysis of variance (ANOVA) was 255
carried out on transformed data followed by separation of means with Tukey’s HSD, using the 256
statistical software Statistica for Windows (Statistica 6.0 per Windows 1998, StatSoft, Vigonza, 257
Italy). Letters indicate significant different groups (P<0.05) by Tukey’s test. In order to identify 258
differences between HS and HSB samples, GC/MS/SPME data were analyzed by Canonical 259
discriminant Analysis of Principal Coordinates (41). The total variance obtained in the principal 260
coordinates used to perform the CAP was higher than 80% for all the samples. Significance testing 261
was carried out using 999 permutations. The correctly performed permutation test assigns ca. 90% 262
of the samples. Moreover, models based on projection on latent structures (PLS) in its discriminant 263
(DA) version were built based on the normalized concentration of the significant molecules 264
identified (43). Metabolically active bacterial families/genera and fecal volatile compounds were 265
12 analyzed by Principal Component Analysis (PCA) using the statistical software Statistica for 266
Windows (Statistica 6.0 per Windows 1998, StatSoft). 267
Nucleotide sequence accession number 268
The sequence data were submitted to the Sequence Read Archive database of the National Center 269
for Biotechnology Information under accession no. PRJNA290897. 270
RESULTS 271
Diet and clinical evaluation 272
In this study, the diet was monitored for two months before starting the administration of durum 273
wheat flour and whole-grain barley Pasta containing the minimum recommended intake (3 g) of β-274
glucans. This was done to ascertain that every volunteer consumed equivalent amounts of 275
carbohydrates, total protein and fat. The only statistically (P<0.05) difference in the diet, before and 276
after administration of durum wheat flour and whole-grain barley Pasta, was the amount of total 277
fibers (Table 1). All volunteers well tolerated barley flour including β-glucans and no statistical 278
(P>0.05) effects regarding bloating, abdominal pain score, flatulence, frequency or consistency of 279
evacuations of feces were observed (Table S1). The observed reduction of non-HDL cholesterol 280
confirmed the European Food Safety Authority healthy claim. The estimation of cholesterol was 281
used as an internal control to validate the adherence of each volunteer to the diet and, consequently, 282
the consistency of the study. 283
Richness and diversity of the fecal microbiota based on 16S rRNA gene sequencing data 284
analysis 285
Total metabolically active bacteria from fecal samples of healthy subjects before (HS) and after 286
(HSB) administration of durum wheat flour and whole-grain barley Pasta were analyzed by 287
pyrosequencing of 16S rRNA gene. After quality control, pyrosequencing analysis yielded 156,563 288
total bacterial reads sequences with a mean of 3010 (ranged from 1146 to 5621) for sample. The 289
metabolically active bacterial community was analyzed by rarefaction curves (Fig. S1), estimated 290
Operational taxonomic units (OTU), richness estimator (Chao 1) and diversity index (Shannon). 291
The Good’s Estimated Sample Coverage was ca. 97%. The mean number of estimated OTU of 292
127.19 vs 132 (P=0.605) for HS and HSB, respectively. According to OTU values, the mean values 293
of Chao1 (152 vs 160.8) and Shannon index (3.27 vs 3.3) values were not significantly different 294
(P=0.466; P=0.794 for Chao1 and Shannon index, respectively) between HS and HSB (Fig. S2). 295
According to alpha diversity values, the three phylogeny-based beta-diversity measures did not 296
show clear separation between the microbiota composition of HS and HSB in weighted and 297
unweighted UniFrac distance principle coordinate analysis plots (Fig. 1; Fig. S3). Besides, Adonis 298
statistical test indicated no significant (P=0.199) differences between the microbial diversity of HS 299
and HSB. However, ANOSIM results, which were based on weighted UniFrac testing for 300
multivariate difference, differed (P=0.04; TestStat 0.05) between HS and HSB. Overall, seven phyla 301
(Actinobacteria, Bacteroidetes, Firmicutes, Fusobacteria, Lentisphaerae, Proteobacteria and 302
Verrucomicrobia) and one candidate division (TM7) were identified (Fig. S4). However, Firmicutes
303
and Bacteroidetes represented more than 85% of all 16S rRNA sequences. No significant (P>0.05) 304
differences were found for the phyla relative abundances between HS and HSB. The only exception 305
was the phylum Fusobacteria, which was higher in HS compared to HSB (average relative 306
abundance of 3.06 vs 1.85%, P=0.019). 307
According to alpha and beta-diversity and considering the 35 most dominant OTU (representing 308
95% of the total microbiota) of all fecal samples, HS and HSB volunteers were variously distributed 309
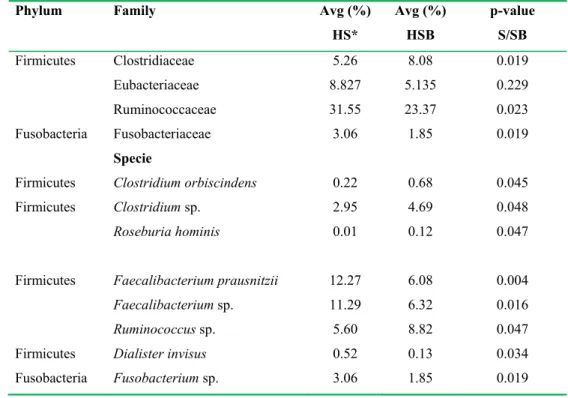
(Fig. 2). Compared to fecal microbiota of HS, only few statistically (P<0.05) differences were 310
detected (Table 2). HSB samples showed the highest relative abundance of Clostridiaceae 311
(Clostridium orbiscindens; Clostridium sp.), Lachnospiraceae (Roseburia hominis), Ruminococcus 312
sp. Other Ruminococcaceae (Faecalibacterium prausnitzii and Faecalibacterium sp.), Dialister 313
invisus and Fusobacteriaceae (Fusobacterium) were the lowest in HSB.
314
OTU correlation 315
14 OTU correlation was investigated considering family- (Fig. 3A,B) or genus-level (Fig. 3C,D) 316
taxonomic assignments and significant correlations at FDR<0.050. Several family positive 317
correlations were always found (e.g., Coriobacteriaceae and Streptococcaceae;
318
Porphyromonadaceae and Clostridiaceae). Other positive correlations were lost in HSB compared
319
to HS (e.g. Eubacteriaceae with Coriobacteriaceae, Oscillospiraceae and Streptococcaceae). 320
Similar trend was detected also at genus-level. The only exception was for Bacteroides, which 321
showed an increased number of positive correlations in HSB compared to HS. 322
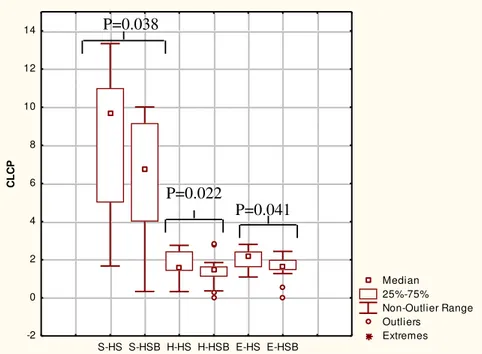
Community level catabolic profiles and cultivable bacteria 323
The substrate utilization pattern (H’ index) and substrate richness (S index) values were calculated 324
(Fig. 4). Compared to HS, the H and S indices of HSB decreased. The E index, which measures the 325
statistical significance (equitability) of the H’ and S index values, confirmed the above-described 326
significant (P <0.05) differences. 327
Selective media were used to enumerate cultivable bacteria (Table 3). Compared to HS, HSB 328
showed a lower (P=0.05) number of total anaerobes. The median values of presumptive 329
Lactobacillus was lower than those found for HSB. Other significant (P<0.05) differences
330
concerned the number of presumptive Bacteroides, Porphyromonas and Prevotella, Enterobacteria, 331
total coliforms and Pseudomonas, Alcaligenes and Aeromonas, which were the lowest in HSB fecal 332
samples. 333
The fecal metabolome 334
Compared to HS, fecal samples of HSB had lower (P<0.05) levels of some FAA (Pro, Trp, Thr, and 335
Arg) and metabolites from the catabolism of FAA (γ-amino butyric acid) (Fig. S5). The levels of 336
some volatile organic compounds (VOC), which was detected in fecal samples of HS, markedly 337
differed in HSB (Fig. 5A; Fig. S6). Compared to HS, fecal samples of HSB showed increased 338
content of several short chain fatty acids (SCFA) (2-methyl-propanoic acid, acetic acid, butanoic 339
acid and propanoic acid) (Fig. 5B). Pentanoic acid was the only SCFA found at the highest level in 340
HS. The other statistically significant differences for VOC regarded the levels of phenylethyl 341
alcohol, benzaldheyde, indole, 2,3-butanedione, 6-methyl-5-hepten-2-one and acetophenone, which 342
were the highest in HSB. FAA and GC-MS/SPME data were also analyzed using the Principal 343
Component Analysis (PCA). The discrimination of fecal samples between HS and HSB was evident 344
(Fig. S7). 345
OTU-metabolite correlations 346
Correlations between metabolically active bacterial families/genera and metabolome data (FAA and 347
VOC) were found (Fig. 6). Coriobacteriaceae, Streptococcaceae, Faecalibacterium, 348
Ruminococcaceae and Ruminococcus were positively correlated with hexanoic and propanoic acids.
349
Other positive correlations were found for Ruminococcaceae and Tpr and γ-amino-butyric acid, and 350
Ruminococcus and Tpr, γ-amino-butyric acid, acetic and butanoic acids. Hexanoic acid was also
351
positively correlated with Parabacteroides, Clostridiaceae and Clostridium. Bacteroidaceae, 352
Bacteroides and Alcaligenaceae were positively correlated with Tpr, acetic, butanoic, and
353
propanoic acids, NH3, indole, Arg, acetohenone and benzaldheyde. Roseburia and Lachnospiraceae 354
showed various positive correlations, including Thr, γ-amino-butyric acid, acetic acid, butanoic 355
acid, NH3, indole, propanoic acid, phenyl ethyl alcohol and 2,3-butanedione. 356
DISCUSSION 357
This is one of the few studies showing the effects of durum wheat flour and whole-grain barley 358
Pasta on the human fecal microbiota and metabolome, using a meta-omics approach. As shown 359
through pyrosequencing analysis, the intervention with durum flour wheat and whole-grain barley 360
Pasta, resulting in the ingestion of 3 g/day of β-glucans, did not affect the values of alpha and beta 361
diversity. Previously, high-throughput sequencing techniques revealed that alpha diversity 362
decreased with dietary supplementation of β-glucans from sea cucumber (Apostichopus japonicas) 363
(44) and mirror carp (Cyprinus carpio) (45). The phylogenetic composition of the analyzed samples 364
confirms that the Firmicutes and Bacteroidetes phyla constitute the most abundant bacterial OTUs 365
16 of human intestinal microbiota. The composition of the main bacterial phyla (Firmicutes and 366
Bacteroidetes) within the enrolled volunteers was variously affected, without an unique statistically
367
significant trend. According to the 16S rRNA gene-based high-throughput sequencing, wide 368
variation among individuals was found (46, 47). Clostridiaceae (Clostridium orbiscindens, 369
Clostridium sp.), Roseburia hominis and Ruminococcus sp. increased following the intervention.
370
Previously, it was shown that barley and oat β-glucans induced clostridial cluster IX populations 371
and Clostridium histolyticum subgroup during in vitro fermentation by human fecal microbiota (48). 372
On the contrary, oat β-glucans did not favor the growth of Clostridium sp. in SHIME and C57BL/6J 373
mice models (21, 24, 49). However, several discrepancies between the different studies could be 374
due to the different models and methods used. Faecalibacterium prausnitzii, Faecalibacterium sp. 375
and Dialister invisus decreased following the diet intervention with barley β-glucans. A similar 376
trend was found for the genus Fusobacterium, belonging to Fusobacteria. Based on OTU 377
correlations, β-glucans negatively impacted on bacterial interactions. 378
The positive bacterial interactions also decreased during dietary supplementation with β-glucans 379
from sea cucumber (44). In agreement, the community level catabolic profiles showed decreased 380
substrate utilization pattern (H’ index) and Shannon index after diet intervention with barley β-381
glucans. All these results indicated a low metabolic diversity. Culture-dependent methods showed 382
that diet intervention with whole-grain barley markedly decreased the total number of fecal 383
anaerobic cultivable bacteria. Decreased levels of cultivable anaerobes were also found during in 384
vitro fermentation of oat β-glucans by human fecal slurry (20). According to the in vitro study of
385
Hughes et al. (48), cultivable presumptive thermophilic and mesophilic Lactobacillus increased 386
following diet intervention with barley β-glucans. No positive effects were observed regarding the 387
genus Bifidobacterium. A randomized, placebo-controlled, double-blind human intervention trial 388
showed that cultivable fecal lactobacilli of 26 healthy volunteers were not affected by 0.75 g of 389
barley β-glucans (26). The same study showed a statistically significant increase of the cell density 390
of bifidobacteria. After grouping volunteers according to age, a significant bifidogenic effect was 391
detected only in subjects older than 50 years. The administration of 3 g/day of β-glucans to 33 392
polypectomized patients showed no effects on the fecal cultivable lactobacilli and bifidobacteria 393
(27). An increased level of lactobacilli was found in animal models after barley or oat containing 394
diet, especially using high-viscosity β-glucans (22, 23, 24). At the same time, oat product based diet 395
or β-glucans from Laminaria digitata, Laminaria hyperborea and Saccharomyces cerevisiae did not 396
increase the levels of lactobacilli in pigs and rats (25, 50). Taken together, these results suggested 397
that the prebiotic potential of whole-grain barley/β-glucans was not always reproducible in vivo. 398
The complex biochemical interactions and antagonistic activities within the intestinal microbiota 399
prior treatment might be responsible for the different response to β-glucans enriched diet. 400
Presumptive cultivable Bacteroides, Porphyromonas and Prevotella decreased following the diet 401
intervention with barley β-glucans. Overall, abundance of Prevotella is higher in humans which 402
consume more vegetable based diet (14). During in vitro fermentation, Prevotella-Bacteroides 403
increased only with low molecular weight β-glucans (48). Cultivable Bacteroides decreased in 404
SHIME model after oat bran feeding (21), while no significant differences were found in rats after 405
feeding with products enriched of oat fiber (50). A barley reach diet was associated with reduced 406
cultivable Bacteroides in the intestinal tract of rats (22). According to this study, cultivable 407
Bacteroides were negatively affected in polypectomized patients after intake of barley β-glucans
408
(27). In vitro and animal trials support that Enterobacteriaceae could not utilize β-glucans (20, 25, 409
50). According to in vitro and animal trials, this study showed a significant reduction of cultivable 410
Enterobacteriaceae and total coliforms. Similar trend was found in administration of 3 g/day of
β-411
glucans to 33 polypectomized patients (27). On the contrary, small amounts of β-glucans (0.75) 412
were not effective to decrease total cultivable coliforms or Escerichia coli (26). First, this study 413
showed that cell density of cultivable Pseudomonas, Alcaligenes and Aeromonas markedly 414
decreased after the diet intervention with Pasta enriched of barley β-glucans. 415
In vitro and animal trials support that high barley β-glucans consumption is associated with a 416
significant increase of the synthesis of SCFA (46, 49, 50). This study confirmed the previous GC-417
18 MS data showing a noticeable increase of 2-methyl-propanoic acid, acetic acid, butanoic (butyric) 418
acid and propanoic (propionic) acid after the diet intervention with durum wheat flour and whole-419
grain barley Pasta. SCFA induce positive gastrointestinal and systemic effects (51). SCFA are also 420
important modulators of the host immune function (52). Acetate is used as energy source for liver 421
and peripheral tissues, and acts as signaling molecules in gluconeogenesis and lipogenesis (53). 422
Propionate serves as precursor for gluconeogenesis and it reduces the synthesis of hepatic 423
cholesterol (54). Propionate was also associated with a decrease of insulin secretion in pancreatic 424
islet cells of rats (55). Butyric acid serves as the main energy source for colonocytes and protects 425
from inflammation (56, 57). Butyrate affects also the regulation of apoptosis and cellular 426
proliferation, resulting in reduced risk of colon cancer (58). BCFA (e.g., butyrate and iso-427
valerate) were not affected by whole-grain barley, indicating that the highest synthesis of SCFA 428
was obtained without increasing undesirable protein fermentation (44). Previously, it was 429
demonstrated that the intake of dietary fibers or symbiotic foods (e.g., fructooligosaccharides, 430
Lactobacillus helveticus and Bifidobacterium longum) leads to a modulation of the gut metabolic
431
activities with an increase of SCFA (59-61). Previously, in vitro data shows that barley and oat β-432
glucans or other oligosaccharides support the growth of Clostridia strains which synthesize acetate 433
and butyrate (62, 63). Bacteroides strains are propionate producers by the succinate pathway (64) 434
and they were positively correlated with propionic acid. 435
This study highlighted some in vivo effects of whole-grain barley towards fecal microbiota and 436
metabolome. Whole-grain barley appeared to be effective in the modulation of the composition and 437
the metabolic pathways of the intestinal microbiota, leading to an increased level of SCFA. 438
Acknowledgements 439
This work was funded by Ministero dell’Istruzione, dell’Università e della Ricerca (MIUR), 440
Ministero dello Sviluppo Economico and Fondo Europeo di Sviluppo Regionale (P.O.N. Ricerca e 441
Competitività” 2007 – 2013 per le Regioni della Convergenza, project code 442
PON02_00657_00186_2937475/1 - PROALIFUN), ASSE I – Sostegno ai mutamenti strutturali – 443
Obiettivo Operativo: “Reti per il rafforzamento del potenziale scientifico-tecnologico delle Regioni 444
della Convergenza”– Azione I: ”Distretti di Alta Tecnologia e relative Reti”). We thank Maria 445
Piccolo (Department of Soil, Plant and Food Sciences, University of Bari Aldo Moro, Bari, Italy) 446
and Giuseppe Dalfino and Stella Diamante (DETO, Nephrology Unit - University of Bari Aldo 447
Moro, Bari) for technical assistance. 448
Conflict of Interest Statement: None 449
REFERENCES 450
1. Food and Drug Administration, HHS. 2005. Food labelling: health claims; soluble 451
dietary fiber from certain foods and coronary heart disease. Fed Regist 70:76150–7662. 452
2. Food and Drug Administration, HHS. 2008. Food labeling: health claims; soluble fiber 453
from certain foods and risk of coronary heart disease. Final rule. Fed Regist 73:47828– 454
47829. 455
3. European Food Safety Authority, EFSA. 2010. Panel on dietetic products, nutrition 456
and allergies. Scientific opinion on dietary reference values for carbohydrates and dietary 457
fibre. EFSA J. 458
4. Tosh SM. 2013. Review of human studies investigating the post-prandial blood-glucose 459
lowering ability of oat and barley food products. Eur J Clin Nutr 67:310–317. 460
5. Cloetens L, Ulmius M, Johansson-Persson A, Akesson B, Onning G. 2012. Role of 461
dietary beta-glucans in the prevention of the metabolic syndrome. Nutr Rev 70:444–458. 462
6. Brown L, Rosner B, Willett WW, Sacks FM. 1999. Cholesterol-lowering effects of 463
dietary fibera meta-analysis. Am J Clin Nutr 69:30–42. 464
7. Bourdon I, Yokoyama W, Davis P, Hudson C, Backus R Richter D, Knuckles B, 465
Schneeman BO. 1999. Postprandial lipid, glucose, insulin, and cholecystokinin 466
responses in men fed barley Pasta enriched with β-glucan. Am J Clin Nutr 69:55–63. 467
20 8. Lia A, Hallmans G, Sandberg AS, Sundberg B, Aman P, Andersson H. 1995. Oat 468
glucan increases bile acid excretion and a fiber-rich barley fraction increases cholesterol 469
excretion in ileostomy subjects. Am J Clin Nutr 62:1245–1251. 470
9. Glore SR, Van Treeck D, Knehans AW, Guild M. 1994. Soluble fiber and serum 471
lipidsa literature review. J Am Diet Assoc 94:425–436. 472
10. Bell S, Goldman VM, Bistrian BR, Arnold AH, Ostroff G, Forse RA. 1999. Effect of 473
beta-glucan from oats and yeast on serum lipids. Crit Rev Food Sci Nutr 39:189–202. 474
11. Anderson JW, Deakins DA, Floore TL, Smith BM, Whitis SE. 1990. Dietary fiber and 475
coronary heart disease. Crit Rev Food Sci Nutr 29:95–147. 476
12. Karlsson F, Tremaroli V, Nielsen J, Backhed F. 2013. Assessing the human gut 477
microbiota in metabolic diseases. Diabetes 62:3341–3349. 478
13. Zhang PP, Hu XZ, Zhen HM, Xu C, Fan MT. 2012. Oat beta-glucan increased 479
ATPases activity and energy charge in small intestine of rats. J Agric Food Chem 480
60:9822–9827. 481
14. Montemurno E, Cosola C, Dalfino G, Daidone G, De Angelis M, Gobbetti M, 482
Gesualdo L. 2014. What would you like to eat, mr CKD microbiota? A mediterranean 483
diet, please! Kidney Blood Press Res 39:114–123. 484
15. Flint HJ, Duncan SH, Scott KP, Louis P. 2007. Interactions and competition within the 485
microbial community of the human colon links between diet and health. Environ 486
Microbiol 9:1101–1111. 487
16. Bergman EN. 1990. Energy contributions of volatile fatty acids from the gastrointestinal 488
tract in various species. Physiol Rev 70:567–590. 489
17. Bernalier-Donadille A. 2012. Fermentative metabolism by the human gut microbiota. 490
Gastroenterol Clin Biol 34:16–22. 491
18. Bäckhed F, Hao D, Wang T, Hooper LV, Koh GY, Nagy A, Semenkovich CF, 492
Gordon JI. 2004. The gut microbiota as an environmental factor that regulates fat 493
storage. Proc Natl Acad Sci USA 101:15718–15723. 494
19. Bindels LB, Delzenne NM, Cani PD, Walter J. 2015. Towards a more comprehensive 495
concept for prebiotics. Nat Rev Gastroenterol Hepatol 12:303–310. 496
20. Jaskari J, Kontula P, Siitonen A, Jousimies-Somer H, Mattila-Sandholm T, 497
Poutaten K. 1998. Oat β-glucan and xylan hydrolysates as selective substrates for 498
Bifidobacterium and Lactobacillus strains. Appl Microbiol Biotechnol 49:175–181.
499
21. Kontula P, Jaskari J, Nollet L, De Smet I, von Wright A, Poutanen K, Mattila-500
Sandholm T. 1998. The colonization of a simulator of the human intestinal microbial 501
ecosystem by a probiotic strain fed on a fermented oat bran product effects on the 502
gastrointestinal microbiota. Appl Microbiol Biotechnol 50:246–252. 503
22. Dongowski G, Huth M, Gebhardt E, Flamme W. 2002. Dietary fiber-rich barley 504
products beneficially affect the intestinal tract of rats. J Nutr 132:3704–3714. 505
23. Snart J, Bibiloni R, Grayson T, Lay C, Zhang H, Allison GE, Laverdiere JK, 506
Temelli F, Vasanthan T, Bell R, Tannock GW. 2006. Supplementation of the diet with 507
high-viscosity beta-glucan results in enrichment for lactobacilli in the rat cecum. Appl 508
Environ Microbiol 72:1925–1931. 509
24. Zhou AL, Hergert N, Rompato G, Lefevre M. 2014. Whole grain oats improve insulin 510
sensitivity and plasma cholesterol profile and modify gut microbiota composition in 511
C57BL/6J mice. J Nutr 145:222–230. 512
25. Murphy P, Dal Bello F, O’Doherty J, Arendt EK, Sweeney T, Coffey A. 2013. 513
Analysis of bacterial community shifts in the gastrointestinal tract of pigs fed diets 514
supplemented with β-glucan from Laminaria digitata, Laminaria hyperborea and 515
Saccharomyces cerevisiae. Animal 7:1079–1087.
22 26. Mitsoua EK, Panopouloub N, Turunena K, Spiliotisc V, Kyriacou A. 2010. Prebiotic 517
potential of barley derived β-glucan at low intake levelsa randomised, double-blinded, 518
placebo-controlled clinical study. Food Res Int 43:1086–1092. 519
27. Turunen K, Tsouvelakidou E, Nomikos T, Mountzouris KC, Karamanolis D, 520
Triantafillidis J, Kyriacou A. 2011. Impact of beta-glucan on the fecal microbiota of 521
polypectomized patientsa pilot study. Anaerobe 17:403–406. 522
28. Friedewald WT, Levy RI, Fredrickson DS. 1972. Estimation of the concentration of 523
low-density lipoprotein cholesterol in plasma, without use of the preparative 524
ultracentrifuge. Clin Chem 18:499–502. 525
29. Gowen CM, Fong SS. 2010. Genome-scale metabolic model integrated with RNAseq 526
data to identify metabolic states of Clostridium thermocellum. Biotechnol J 7:759–767. 527
30. Suchodolski JS, Dowd SE, Wilke V, Steiner JM, Jergens AE. 2012. 16S rRNA gene 528
pyrosequencing reveals bacterial dysbiosis in the duodenum of dogs with idiopathic 529
inflammatory bowel disease. PLoS One 7:e39333. 530
31. Gontcharova V, Youn E, Wolcott RD, Hollister EB, Gentry TJ, Dowd SE. 2010. 531
Black box chimera check B2C2a windows-based software for batch depletion of 532
chimeras from bacterial 16 S rRNA gene datasets. Open Microbiol J 4:47–52. 533
32. Dowd SE, Zaragoza J, Rodriguez JR, Oliver MJ, Payton PR. 2005. Windows. NET 534
network distributed basic local alignment search toolkit W.ND-BLAST. BMC 535
Bioinformatics 693. 536
33. Edgar RC. 2010. Search and clustering orders of magnitude faster than BLAST. 537
Bioinformatics 26:2460–2461. 538
34. Cole JR, Wang Q, Cardenas E, Fish J, Chai B, Farris RJ, Kulam-Syed-Mohideen 539
AS, McGarrell DM, Marsh T, Garrity GM, Tiedje JM. 2009. The ribosomal database 540
project improved alignments and new tools for rRNA analysis. Nucleic Acids Res 541
37:141–145. 542
35. Oksanen J, Blanchet FG, Kindt R, Legendre P, O'Hara RB, Simpson GL, Solymos 543
P, Stevens MHH, Wagner H. 2011. vegan: Community Ecology Package, R package 544
version 1.17–1. 545
36. Roberts DW. 2010. labdsv: Ordination and Multivariate Analysis for Ecology. R 546
package version 1.4–1. 547
37. Anders S, Huber W. 2010. Differential expression analysis for sequence count data. 548
Genome Biol 11:106. 549
38. McMurdie PJ, Holmes S. 2013. phyloseq: An R package for reproducible interactive 550
analysis and graphics of microbiome census data. PLoS One, 8:e61217. 551
39. Crecchio C, Gelsomino A, Ambrosoli R, Minatic JL, Ruggiero P. 2004. Functional 552
and molecular responses of soil microbial communities under differing soil management 553
practices. Soil Biol Biochem 36:1873–1883. 554
40. Zak JC, Willing MR, Moorhead DL, Wildman HG. 1994. Functional diversity of 555
microbial communities a quantitative approach. Soil Biol Biochem 26:1101–1108. 556
41. De Angelis M, Piccolo M, Vannini L, Siragusa S, De Giacomo A, Siragusa S, 557
Serrazzanetti DI, Cristofori F, Guerzoni ME, Gobbetti M, Francavilla R. 2013. 558
Fecal microbiota and metabolome of children with autism and pervasive developmental 559
disorder not otherwise specified. PLoS One 8:e76993. 560
42. Ndagijimana M, Laghi L, Vitali B, Placucci G, Brigidi P, Guerzoni ME. 2009. Effect 561
of a synbiotic food consumption on human gut metabolic profiles evaluated by 1H 562
Nuclear Magnetic Resonance spectroscopy. Int J Food Microbiol 13:4147–4153. 563
43. De Filippis F, Vannini L, La Storia A, Laghi L, Piombino P, Stellato G, Serrazanetti 564
DI, Gozzi G, Turroni S, Ferrocino I, Lazzi C, Di Cagno R, Gobbetti M, Ercolini D. 565
2014. The same microbiota and a potentially discriminant metabolome in the saliva of 566
omnivore, ovo-lactovegetarian and vegan individuals. PLoS One 9:e112373. 567
24 44. Yang J, Xu Z, Tian X, Dong S, Peng M. 2015. Intestinal microbiota and immune 568
related genes in sea cucumber (Apostichopus japonicus) response to dietary β-glucan. 569
Biochem Biophys Res Commun 23:74–81. 570
45. Kühlwein H, Merrifield DL, Rawling MD, Foey AD, Davies SJ. 2014. Effects of 571
dietary β-1,31,6-D-glucan supplementation on growth performance, intestinal 572
morphology and haemato-immunological profile of mirror carp (Cyprinus carpio L.) J 573
Anim Physiol Anim Nutr Berl 98:279–289. 574
46. Yang J, Martínez I, Walter J, Keshavarzian A, Rose DJ. 2013. In vitro 575
characterization of the impact of selected dietary fibers on fecal microbiota composition. 576
Anaerobe 23:74–81. 577
47. Greiner T, Bäckhed F. 2011. Effects of the gut microbiota on obesity and glucose 578
homeostasis. Trends Endocrinol Metab 22:117–123. 579
48. Hughes SA, Shewry PR, Gibson GR, McCleary BV, Rastall RA. 2008. In vitro 580
fermentation of oat and barley derived b-glucans by human fecal microbiota. FEMS 581
Microbiol Ecol 64:482–493. 582
49. Shimizu J, Tsuchihashi N, Kudoh K, Wada M, Takita T, Innami S. 2001. Dietary 583
curdlan increases proliferation of Bifidobacteria in the cecum of rats. Biosci Biotechnol 584
Biochem 65:466–469. 585
50. Drzikova B, Dongowski G, Gebhardt E. 2005. Dietary fibre-rich oat-based products 586
affect serum lipids, microbiota, formation of short-chain fatty acids and steroids in rats. 587
Br J Nutr 94:1012–1025. 588
51. Wong JM, de Souza R, Kendall CW, Emam A, Jenkins DJ. 2006. Colonic health 589
fermentation and short chain fatty acids. J Clin Gastroenterol 40:235–243. 590
52. Tilg H, Moschen AR. 2014. Microbiota and diabetes: an evolving relationship. Gut 63: 591
1513–1521. 592
53. Zambell KL, Fitch MD, Fleming SE. 2003. Acetate and butyrate are the major 593
substrates for de novo lipogenesis in rat colonic epithelial cells. J Nutr 133:3509–3515. 594
54. Cheng HH, Lai MH. 2000. Fermentation of resistant rice starch produces propionate 595
reducing serum and hepatic cholesterol in rats. J Nutr 130:1991–1995. 596
55. Ximenes H, Hirata AE, Rocha MS, Curi R, Carpinelli AR. 2007. Propionate inhibits 597
glucose-induced insulin secretion in isolated rat pancreatic islets. Cell Biochem Funct 598
25:173–178. 599
56. Ogawa H, Iimura M, Eckmann L, Kagnoff MF. 2004. Regulated production of the 600
chemokine CCL28 in human colon epithelium. Am J Physiol Gastrointest Liver Physiol 601
287:G1062–1069. 602
57. Canani RB, Di Costanzo M, Leone L, Pedata M, Meli R, Calignano A. 2011. 603
Potential beneficial effects of butyrate in intestinal and extra-intestinal diseases. World J 604
Gastroenterol 17:1519–1528. 605
58. Scheppach W, Bartram H, Richter F. 1995. Role of short-chain fatty acids in the 606
prevention of colorectal cancer. Eur J Cancer 31:1077–1080. 607
59. Vitali B, Ndagijimana M, Cruciani F, Carnevali P, Candela M, Guerzoni ME, 608
Brigidi P. 2010. Impact of a synbiotic food on the gut microbial ecology and metabolic 609
profiles. BMC Microbiol 10:4. 610
60. Candela M, Maccaferri S, Turroni S, Carnevali P, Brigidi P. 2010. Functional 611
intestinal microbiome, new frontiers in prebiotic design. Int J Food Microbiol 140:93– 612
101. 613
61. Candela M, Biagi E, Turroni S, Maccaferri S, Figini P, Brigidi P. 2015. Dynamic 614
efficiency of the human intestinal microbiota. Crit Rev Microbiol 41:165–171. 615
62. Mitsuoka T. 1996. Intestinal flora and human health. Asia Pac J Clin Nutr 5:2–9. 616
26 63. Shimizu T, Ohtani K, Hirakawa H, Ohshima K, Yamashita A, Shiba T, Ogasawara 617
N, Hattori M, Kuhara S, Hayashi H. 2002. Complete genome sequence of Clostridium 618
perfringens, an anaerobic flesh-eater. Proc Natl Acad Sci U S A 99:996–1001.
619
64. Louis P, Scott KP, Duncan SH, Flint HJ. 2007. Understanding the effects of diet on 620
bacterial metabolism in the large intestine. J Appl Microbiol 102:1197–1208. 621
622 623
Figure legends 624
FIG 1 Principle Coordinate Analysis (PCoA) of metabolically active bacteria. PCoA was based on 625
weighted UniFrac analysis of all 16S rRNA gene sequences found on fecal samples of healthy 626
subject before (HS) and after two months of diet intervention (HSB) with durum wheat flour and 627
whole-grain barley Pasta. 628
FIG 2 Heatmap summarizing the relative abundance of the 35 most dominant species in RNA 629
samples directly extracted from healthy subjects before (HS) and after (HSB) two months of diet 630
intervention with durum wheat flour and whole-grain barley Pasta. The color key defines the 631
percentages of OTU in the samples. 632
FIG 3 Significant correlations between family (A, B) and genus (C, D) bacterial OTU before (A, C) 633
and after (B, D) two months of diet intervention with durum wheat flour and whole-grain barley 634
Pasta. The colors of the scale bar denote the nature of the correlation, with 1 indicating a perfectly 635
positive correlation (read) and -1 indicating a perfectly negative correlation (green) between two 636
microbial families or genera. Only significant correlations (FDR<0.05) are shown. 637
FIG 4 Community level catabolic profiles. CLCP indices (utilization pattern substrate (H’), 638
substrate richness (S), and equitability (E)) of the fecal microbiota of healthy subjects before (HS) 639
and after (HSB) two months of diet intervention with durum wheat flour and whole-grain barley 640
Pasta. Data are the means of three independent experiments (n 3). The center line of each box 641
represents the median, and the top and bottom of the box represent the 75th and 25th percentiles of 642
the data, respectively. The top and bottom of the error bars represent the 5th and 95th percentiles of 643
the data, respectively. The circles in each box plot extend to the outliers of the data. 644
FIG 5 Score (A) and loading coefficient (B) plots of Canonical Discriminant Analysis of Principal 645
Coordinates (CAP) of volatile organic metabolites in feces of healthy subjects before (HS) and after 646
(HSB) diet intervention with durum wheat flour and whole-grain barley Pasta. Compounds 647
significantly associated with the feces of HSB (negative axis) or HS samples (positive axis) Data 648
are the means of three independent experiments (n = 3). 649
28 FIG 6 Significant correlations between metabolically active bacterial OTU (family and genus 650
level) and after free amino acids and volatile organic compounds after two months of diet 651
intervention with durum wheat flour and whole-grain barley Pasta. The colors of the scale bar 652
denote the nature of the correlation, with 1 indicating a perfectly positive correlation (read) and -1 653
indicating a perfectly negative correlation (green) between two microbial families or genera. Only 654
significant correlations (FDR<0.05) are shown. 655
656 657
TABLE 1. Basic characteristics and diet of volunteers. Each healthy subject was analyzed before 658
(HS) and after (HSB) two months of diet intervention with 100 g/day of durum wheat and whole-659
grain barley pasta containing 3% (wt/wt) of β-glucans. 660
Basic characteristics HS HSB
Age (years) 39±9 39±9
Male (%) 46 46
Body Mass Index (kg/m2) 22.6±3a 22.6±3a
Total Cholesterol (mg/dl) 183.8±30.2b 173.25±27.4c LDL Cholesterol (mg/dl) 107.4±25.2b 93.25±24.5c HDL Cholesterol (mg/dl) 62.48±16.63a 62.41±16.56a Weekly cumulative frequency of food HS HSB Milk 50a 50a Pasta 100a 0b Pasta β-Glucan 0a 100b Bread 97a 100a Meats 85a 84a Cured meats 73a 68a Fish 77a 81a Dairy Products 81a 77a Eggs 89a 84a Legumes 77a 76a Leafy vegetables 100a 100a
30 Fruits 93a 96a Yogurt 8a 8a Sweets 59a 57a Components Intake HS HSB Water (g) 717.0±274.6 a 853.4±512.7 a Protein (g) 69.9±29.5a 77.6±41.7 a Lipid (g) 58.3±31.3a 68.7±42.2 a Carbohydrate (g) 199.8±73.9a 237.4±101.6 a Starch (g) 130.1±54.9a 151.1±70.3 a Soluble sugars (g) 58.7±27.9a 73.4±37.6 a Alcohol (g) 7.9±13.3a 6.5±12.1 a Total fiber (g) 13.4±8.2a 22.0±11.7 b Energy (kcal) 1613.1±609.6a 1894.3±908.9 a Sodium (mg) 1233.3±886.5a 1498.5±1180.4 a Potassium (mg) 2091.7±888.6a 2408.5±1433.0 a Iron (mg) 11.7±20.7a 8.3±6.1 a Calcium (mg) 446.2±274.6a 533.0±339.8 a Phosphorus (mg) 986.1±705.8a 940.6625.7 a Thiamine (mg) 0.7±0.3a 0.9±0.8 a Riboflavin (mg) 0.9±0.4a 1.0±0.8 a Niacin (mg) 11.5±6.3a 12.78.5 a Vit. C (mg) 64.6±39.7a 179.3±340.3 a Vit. E (mg) 5.0±8.9a 5.8±12.1 a
a–cValues within a row with different superscript letters are significantly different (P<0.05). 661
TABLE 2. Pyrosequencing data summary. 663
Phylum Family Avg (%)
HS* Avg (%) HSB p-value S/SB Firmicutes Clostridiaceae 5.26 8.08 0.019 Eubacteriaceae 8.827 5.135 0.229 Ruminococcaceae 31.55 23.37 0.023 Fusobacteria Fusobacteriaceae 3.06 1.85 0.019 Specie
Firmicutes Clostridium orbiscindens 0.22 0.68 0.045
Firmicutes Clostridium sp. 2.95 4.69 0.048
Roseburia hominis 0.01 0.12 0.047
Firmicutes Faecalibacterium prausnitzii 12.27 6.08 0.004
Faecalibacterium sp. 11.29 6.32 0.016
Ruminococcus sp. 5.60 8.82 0.047
Firmicutes Dialister invisus 0.52 0.13 0.034
Fusobacteria Fusobacterium sp. 3.06 1.85 0.019 *Each healthy subject was analysed before (HS) and after (HSB) two months of diet intervention 664
with 100 g/day of durum wheat and whole-grain barley pasta containing 3% (wt/wt) of β-glucans. 665
Relative abundance (average value, Avg %) of predominant bacterial taxa, showing significant 666
(P<0.05) differences between fecal samples of HS and HSB. 667
668 669
32 TABLE 3. Fecal cultivable bacteria of the main microbial groups.
670
Microbial group Mean no. of cultivable cells, log CFU/ml (range)
HS* HSB Total anaerobes 9.80a (9.33 – 9.93) 8.42b (4.98 – 9.81) Lactobacillus (thermophilus 42°C) 6.61b (4.60 – 8.93) 7.53a (4.93 – 9.16) Lactobacillus (mesophilus 25°C) 6.61b (3.26 – 8.98) 7.38a (4.46 – 9.28) Enterococcus 7.05a (5.36 – 8.55) 7.29a (3.90 – 9.19) Lactococcus and Streptococcus 7.74a (5.36 – 8.55) 7.57a (4.25 – 9.26) Staphylococcus 5.68a (2.84 – 8.11) 6.14a (4.38 – 8.08) Bacteroides, Porphyromonas and Prevotella 9.09a (3.00 – 9.92) 5.17b (2.52 – 6.44) Enterobacteriaceae 7.07a (5.11 – 9.27) 6.11b (4.19 – 7.14) Total Coliforms 6.94a (1.91 – 8.93) 6.48b (1.00 – 5.32)
Pseudomonas, Alcaligenes and Aeromonas
6.42a (1.97 – 7.95) 3.68b (1.00 – 4.81)
Bifidobacterium 7.16a (4.33 – 9.80) 6.90a (4.19 – 9.09)
Corynebacterium 4.93a (1.74 – 7.68) 5.35a (2.00 – 7.17)
*Each healthy subject was analysed before (HS) and after (HSB) two months of diet intervention 671
with 100 g/day of durum wheat and whole-grain barley pasta containing 3% (wt/wt) of β-glucans. 672
a–bValues within a row with different superscript letters are significantly different (P<0.05). 673