Assessing the Risk of Bus Crashes in Transit Systems
Fabio Porcu
1, Alessandro Olivo
2, Giulio Maternini
3, Mauro Coni
2,
Michela Bonera
3, Benedetto Barabino
3*1SPIVA Srl - Technological Start Up, Cagliari Italy
2Department of Civil, Environment and Architecture Engineering (DICAAR), University of Cagliari, Italy 3Department of Civil, Environment, Land and Architecture Engineering and Matemathics (DICATAM),
University of Brescia, Italy
Abstract
Although public transport buses may be considered a safe transportation mode, bus safety is a crucial issue from the perspectives of operators, passengers and local authorities owing to the relevant implications it generates. Therefore, assessing the risk of crashes on bus routes may help improve the safety performance of transit operators. Much research has identified patterns of bus crashes to understand the effects of many factors on the frequency and the severity of them. Conversely, to the best of our knowledge, the research measuring the risk of crashes in bus transit networks is seldom faced.
This paper adjusts existing methods to assess the safety on bus transit networks by the integration of safety factors, prediction models and risk methods. More precisely, first, the methodology identifies several safety factors as well as the exposure risk factors. Second, this methodology specifies the risk components in terms of frequency, severity and exposure factors that may affect bus crashes and models their relationships in a risk function. Third, this methodology computes the risk of crashes for each route and provides a ranking of safety performance. A real case study demonstrates the feasibility of this methodology using 3,457 bus crashes provided by a mid-sized Italian bus operator.
This experiment shows that transit managers could adopt this methodology to perform an accurate safety analysis on each route. Moreover, this methodology could be implemented in a road traffic safety management system in order to evaluate the risk of crashes on routes, monitor the safety performance of each route and qualify each route according to recent safety norms.
Keywords: Urban Public Transport; Bus Safety; Bus crashes; Risk Analysis; ISO 39001:2012.
1 Introduction
Bus safety is a critical issue for the relevant implications it generates. From the perspective of Public Transport Companies (PTC), bus crashes increase costs of an industry that daily deals with high operational costs and low fare revenues (Barabino et al., 2020; Barabino, 2018; Barabino and Di Francesco, 2016, Bonera et al., 2020). Bus
crashes decrease service reliability and safety and lead to increasing property and image damages. From the passengers’ perspective, the occurrence of bus crashes may affect their perceived safety. From the local authorities’ perspective, the occurrence of bus crashes may affect the public opinion. Indeed, bus crashes are usually perceived much more than what the objective data show. This is because they may generate the feeling that the PTC has a greater responsibility than people using the road at their own risk and individual crashes may result in many injuries (e.g., urban buses).
Bus safety has received wide attention by many stakeholders engaged in the improvement of transit road safety because it can no longer be overlooked. This fact can be proved by several international guidelines and standards that have been issued to standardize the management of road safety, reduce deaths and injuries as well as social costs. A clear example is the International Norm ISO 39001 (2012), which recommend the PTC (or any other kind of road operator company) to implement the Road Traffic Safety Management System (RTSMS) to improve its safety performance. However, no specific RTSMS is suggested on ISO 39001 (2012).
All these reasons may represent a priority for vanguard PTCs and local authorities. However, the interest in bus safety is not analysed much in the literature as opposed to e.g., car safety (e.g., Af Wåhlberg, 2002; 2004). Perhaps, it is generally accepted that bus transit improves road safety since it is expected to reduce vehicular traffic (e.g., Albertsson and Falkmer, 2005; Cafisio et al., 2013). Bus safety research mainly deals with studies on: i) descriptive statistics on the occurrences of bus crashes and associate severities (e.g., Evans and Courtney, 1985; Jovanis et al., 1991; Zeeger et al., 1994) and ii) multivariable prediction models that shed light on the effects of different safety factors (determinants, or attributes, or variables) on the frequency (e.g., Cheung et al., 2008; Strathman et al., 2010; Quintero et al., 2013; Goh et al., 2014) and the severity of the bus crashes (e.g., Kaplan and Prato, 2012; Prato and Kaplan, 2014). In addition, the literature is quite rich on risk assessment methods in several fields such as chemical, economic and financial, engineering, industrial, medical (e.g., Fine, 1971; CCPS, 1995; Andrews and Moss (2002) ISO 39001, 2009; Mullai, 2006). However, as far as the authors know, the literature is quite poor on bus crash risk assessment methods, since only a handful of recent studies have attempted to define some crash risk indexes (Tiboni and Rossetti, 2013; Mitsakis, 2015; Ye et al., 2016; Law et al., 2017).
This paper aims to cover this gap, by the proposal of an adjusted methodology for the assessment of bus safety performance in according to ISO 39001 (2012) that enables PTCs to evaluate each transit route with a risk crash index.
More precisely, at first the methodology identifies the safety factors. Next, it specifies the risk components in terms of frequency (or probability), severity (or potential crash consequence) and exposure variables that may affect bus crashes. Finally, it models the relationship about these components and builds a risk bus crash function that ranks each route according to its safety performance, to provide a fundamental tool that could help improve the bus safety performances.
The proposed methodology builds on the study of Jovanis et al. (1991). However, it considers a larger number of variables and uses an adjusted formulation of the well-known risk index first introduced by Fine (1971) for the assessment of the crash risk. Fine (1971) assessed the risk by predefined numerical ratings for the probability factor, the potential consequences of a crash and the exposure factor. Conversely, the adjusted index is computed by modelling the frequency and severity as functions of exposure factors as well as calibrating these models by real data. Furthermore, this methodology refines a
previous study because it formulates the severity function as a direct economic cost including medical, legal emergency and property related damages for each crash and adopts the passenger*km as an exposure factor (Porcu et al., 2020).
A total of 3,457 bus crashes reported between 1997 and 2001 from a mid-sized Italian bus operator were adopted to demonstrate the feasibility of this methodology in a real case study.
This paper attempts to contribute to both theory and practice. On the theoretical side, this paper sheds light on an emerging research topic at least in bus transit. From a practical perspective, this paper helps implement a RTSMS for PTCs interested in the qualification for ISO 39001 (2012) safety certifications of their services.
The remaining paper is organized as follows. Section 2 presents the methodology to evaluate the crash risk for each bus route. Section 3 illustrates its experimentation on a real case study. Section 4 draws conclusions and future perspectives.
2 Methodology
This section illustrates the proposed methodology to assess the risk of crashes in bus transits according to the scheme shown in Fig. 1. This methodology specifies the safety factors and how to combine them to assess the crash risk. It is briefly summarized in the following sections.
Figure 1: Adjusted methodology for the evaluation of the bus crash risk (adapted from Porcu et al., 2020)
2.1 Safety Factors
In bus transit systems, a crash may be viewed mainly by the interaction of six relevant factors, i.e., the context, the infrastructure, the organisation, the vehicle, the driver and the passengers. According to ISO 39001 (2012), these factors (and the related sub-factors) are identified as intermediate safety outcome factors (see the bottom block of Fig. 1).
PTCs have a proper database where data about their supply (e.g., route lists, route lengths, total working hours) and demand (i.e., passenger volumes) are stored. Therefore, this database helps recognise additional factors that may reflect the amount of bus passengers or services interested in the occurrence of crashes. According to ISO 39001 (2012), these factors are identified as risk exposure factors (see the top block of Fig. 1).
Risk assessment method
Bus Crash Bus crash data
Final safety outcomes factors Type Causes Severity Location Bus service characteristic data Risk exposure factors Demand Supply Intermediate safety outcome factors Context Infrastructure Driver Vehicle Organisation Additional data Passenger Crash prediction models
Route crash risk evaluation Total accident frequency - Hi Total accident severity cost - Vi 𝐻𝑖,𝑙= 𝑓 𝐸𝑖,𝑙 𝑉𝑖,𝑙= 𝑓 𝐸𝑖,𝑙
Route crash risk computation Route crash priority scale
Reccomandations for risk treatment Crash data
Therefore, the interaction between intermediate safety outcome factors (see bottom-dotted arrow in Fig. 1) and risk exposure factors (see top-bottom-dotted arrow in Fig. 1) may result in a crash2.
Vanguard PTCs have a specific databank where they record bus crashes and some other factors that may reflect the type of crash as well as the associate severity (i.e., number of deaths, serious injuries, and property damage). Moreover, collecting additional factors (e.g., location, causes, etc.) is necessary for the settlement of insurance claims. According to ISO 39001 (2012), these factors are referred to as final safety outcomes (see the middle block of Figure 1).
Finally, some PTCs might record crashes caused by voluntary damages and/or personal injuries owing to criminal and/or vandalism actions. These records were not of interest because they could not be considered as crashes, so they were disregarded in this methodology. In addition, only the crashes reported by the PTC staff were considered, because crashes (claims) reported by third parts were characterized as being too uncertain. 2.2 Method for risk assessment
In this section, a quantitative method for assessing the crash risk for each bus route is presented. Although, there are many methods that may be applied to evaluate the crash risk in transit, in this paper, we adjusted the well-known risk index first introduced by Fine (1971). Our method is based on a risk index that includes the frequency and the severity of a crash as functions of exposure factors for each intermediate safety factor. Moreover, in this method, we refer generally to crashes because the related databank contains both with and without collision crashes.
Let:
l be the route of interest;
i be the index of the intermediate outcome factor (or the associated sub-factor); n be the total number of intermediate outcome factors;
Hi,l be the frequency of crashes that occurred on route l in a predefined time interval (e.g., a year) in which factor i manifests itself;
Vi,l be the potential consequence of the crash on route l, that is evaluated as the total economic cost of the crash in a predefined time interval (e.g., a year) in which factor i manifests itself;
Ei,l be the exposure factor associated with factor I on route l. Risk index R for each route l is computed as follows:
𝑅 = ∑ 𝐻, ∗ 𝑉, ∗ 𝐸, (1)
Even though the calculation of eqn. (1) is simple, each component needs to be estimated separately according to the following stage.
First, Hi,l and Vi,l are computed by querying the transit crash database and counting the frequencies of the occurrences and the total consequences (i.e., costs) of a crash for each intermediate outcome factor i. More precisely, let:
j be the index of the crash; m be the total number of crashes;
2 Other factors, such as car traffic, might be considered as exposure variables. However, they were not considered because we referred to data available by the PTC.
hijl be a binary variable which 4scores 1 if crash j occurred on route l, due to factor i, and 0 otherwise;
vijl be a continuous variable, which expresses the consequence of a crash as a direct economic cost. Such cost includes medical, legal emergency and property related damages for each crash (e.g., Fine, 1971; Andreassen, 1989; Shah et al., 2018). This evaluation is done for each crash j that occurred on route l, due to factor i.
Thus, the total frequency of crashes and the associated severities are evaluated as follows: 𝐻, = ∑ ℎ ∀ 𝑖 = 1, … , 𝑛 ; ∀ 𝑙 = 1, … , 𝐿 (2)
𝑉, = ∑ 𝑣 ∀ 𝑖 = 1, … , 𝑛 ; ∀ 𝑙 = 1, … , 𝐿 (3)
To clarify the initial computation of 𝐻, and 𝑉, , we consider the following example. Assume that on route l, 4 bus crashes occurred during the day and 2 others at night. Moreover, 5 bus crashes provoked only-material damage and 1, 2 injuries at night. Let us assume that each bus crash with only-material damage alone has a total cost 1,000 € while each injury costs 25,000€. Therefore, considering day and night as intermediate outcome factors, according to eqns. (2) and (3), the following results are obtained:
𝐻 ,= 4; 𝑉 , = 4,000; (4) 𝐻 , = 2; 𝑉 , = 51,000; (5)
Second, the frequency and severity of transit bus crashes are computed by many bivariate models, one for every intermediate factor i. On each model, the exposure factor Ei,l (associated to each i) is the predictor, while Hi,l or Vi,l are the response variables and we assumed each factor independent from the others. Although these bivariate models may hinder the evaluation of the relationships among competitive intermediate outcome factors, a simple bivariate analysis allows the PTC to evaluate the factors that most influence its safety performance one-by-one. Moreover, unlike multivariate models with one or few overall exposure factors (e.g., the total bus-km for the route at hand), our choice help emphasise the role of the exposure factors for each i (e.g., the total bus-km for diurnal lighting conditions on the route at hand). In addition, too complex models were hardly employed in the operational management, since they could not incorporate practical and operational considerations in the analysis. Thus, this study models 𝐻, and 𝑉, as functions of Ei,l, to predict a number of frequency and severity models as many as are intermediate safety factors considered.
The Generalized Linear Modelling approach that assumes a negative binomial structure seems to be the best way to predict the frequency of crashes because road crashes are random, infrequent and non-negative integer events (e.g., Mannering and Bath, 2014). Nevertheless, a non-linear relationship exists between the frequency of crashes and traffic exposure factors (e.g., Cheung et al., 2008; Quintero et al., 2013). Moreover, exposure Ei,l refers to a variable that when it assumes zero value, the frequency of crashes and severities must be zero. Therefore, let 𝛼 ,𝛼 , 𝛽 , 𝛽 be the coefficients to be estimated in the model, the prediction of 𝐻, and 𝑉, is as follows:
𝐻, = 𝛼 , , ∗ 𝐸𝑥𝑝 , ,∗ , ∀ 𝑖 = 1, … , 𝑛 ; ∀ 𝑙 = 1, … , 𝐿 𝐸, > 0 ∀ 𝑖 = 1, … , 𝑛 ; ∀ 𝑙 = 1, … , 𝐿 (6) 𝑉, = 𝛽 , , ∗ 𝐸𝑥𝑝( , ,∗ ,) ∀ 𝑖 = 1, … , 𝑛 ; ∀ 𝑙 = 1, … , 𝐿 𝐸, > 0 ∀ 𝑖 = 1, … , 𝑛 ; ∀ 𝑙 = 1, … , 𝐿 (7)
The check of the statistical significance according to the F-test and the Pearson R2 was used to evaluate each model. Furthermore, other assessments were made by analysing the sign and the significance of the coefficients.
Third, once functions 𝐻, and 𝑉, have been estimated, the crash risk index may be computed by adjusting eqn. (1) as follows:
𝑅 = ∑ 𝐻, 𝐸, ∗ 𝑉, 𝐸, = ∑ (𝛼 , , ∗ 𝐸𝑥𝑝 , ,∗ , ) ∗ (𝛽
, , ∗ 𝐸𝑥𝑝 , ,∗ , ) 𝑙 = 1, … , 𝐿 (8)
It is worth noting that, drivers and vehicles may usually operate in different routes. Therefore, the computation of Rl reflects the most critical conditions for the route at hand, in terms of highest values of H and V, respectively. Nevertheless, if specific variables related to drivers’ and vehicles’ characteristics are included in the PTC databank, they may be considered as intermediate outcome factors as well.
Fourth, to prioritize actions, it may be useful to classify routes according to a predefined risk scale. As far as the authors know, there are many methods for developing a risk scale. In this paper, we used a four-level scale by creating three thresholds to identify a range of acceptable values of all calculated Rl. This scale is based on the lower, the middle and the upper quartiles concept (Q1 = 25th percentile, Q2= 50th percentile and Q3 = 75th percentile), in order to classify each bus route as follows: R1 – Maximum risk (i.e., Rl > Q1); R2 – High risk (i.e., Q2 ≤ Rl ≤ Q1); R3 – Average risk (i.e., Q3 ≤ Rl ≤ Q2); R4 – Low risk (i.e., Ql < T3). This classification helps identify the routes that require greater safety measures and better appreciates similarities and differences among routes.
Fifth, some actions can be taken to address safety shortcomings or their impact, especially for the most critical routes. Referring to eqn. (8), it is possible to mitigate the crash risk by working on prevention actions to reduce 𝑯,𝒍 𝑬𝒊,𝒍 values and/or protection treatments to reduce 𝑽,𝒍 𝑬𝒊,𝒍 values, respectively.
3 Experimentation in a real bus network
This methodology was experimented in the urban bus transport system in the area of Cagliari with 0.4M inhabitants, located in Sardinia (Italy). The local public transport company is called CTM and manages the public transportation with 271 vehicles (i.e., buses and trolleys) and serves approximately 40.8 million trips a year. Moreover, these vehicles travel over 12.4 million kilometers per year along 34 routes (CTM, 2020).
3.1 Source and data
For this experimentation, final, intermediate and risk exposure factors were collected from different sources. Final safety outcome factors were collected from crash data that occurred on buses of CTM. In particular, each event that occurred with or without collision in which a vehicle, object and/or a person were involved, and generated damage-only and/or injuries and/or fatalities was recorded. From 1997 to 2001, CTM recorded a total of 3,457 bus crashes (Barabino et al, 2006)3. Moreover, the total cost for each crash was evaluated taking into account the average cost per damage components as shown in Table 1, according to the classification provided by the Italian Ministry of Transport (2010)4. These costs were computed on the overall road crashes recorded in the Italian territory; therefore, crashes between vehicles other than buses are included. Nevertheless, this is not a strong drawback of this method, which can be implemented with other crash cost data.
Table 1: Average cost per direct damage of a crash
Average Cost Value [€]
Average costs per death 1,503,990
Average cost of an injured person 42,219
Average property damage per crash 7,686
Average administrative costs per crash 3,300
Intermediate safety outcome factors related to the infrastructure (i.e., road insfrastructure characteristics) where crashes occurred, to the organisation (i.e., spatial and temporal characteristics of the bus network) and to the vehicles are also collected. These data are adopted to generate the exposure factors for each year of interest. In this experiment, 23 bus routes are considered.
Finally, the last source includes manual ride-check data on passengers route-by-route.
3.2 Experimental setup
According to the first step of the methodology, we calculated the total frequency of crashes (Hi) and the associated severities (Vi) for each intermediate outcome factor i and route l, using eqns. (2) and (3). Next, we estimated the exposure factors for each i and route l as the passenger*km travelled or number of buses at peak hour for bus type, in the time period considered.
Table 2 lists the intermediate safety outcome factors (1st column) and their relative sub-factors (2nd column) adopted for this experiment. Each sub-factor can be coded as a binary or categorical variable and its notation was bold-edited and reported in square brackets. For instance, sub-factor Day-type is dichotomous; its values are weekday and weekend and are denoted by WD and WE, respectively.
3 Due to the secrecy policy of CTM, we cannot analyze data that are more recent.
Table 2: Intermediate safety outcome factors (i) and sub-factors
Factors Sub-factors
Context Lighting (Day [D]; Night [N]) - Season (Winter [Win]; Spring [Spr]; Summer [Sum];
Autumn [Aut]) – Day type (Weekday [WD]; WeekEnd [WE]
Infrastructure N° of lanes (1 [nl1]; 2 [nl2]; 3 [nl3]; 3+ [nl3+]) – Lane’s width <3m [lw<3]; 3.25m [lw3.25]; 3.5+m [lw3.5+] – Sidewalk’s width <1m [sw<1]; 1.0m [sw1];1.5m [sw1.5]; 2.0m [sw2]; 2.5+m [sw2.5+] - Road type (ExtraUrban road [EUr] ; Urban road [Ur]) Organization Bus frequency (High [HF]; Middle [MF]; Low [LF]) – Right-of-way priority (Yes
[blY]; No [blN])
Vehicle Length Bus (>12m [>12lB]; <12m (<12lB))
3.3 Result and discussion
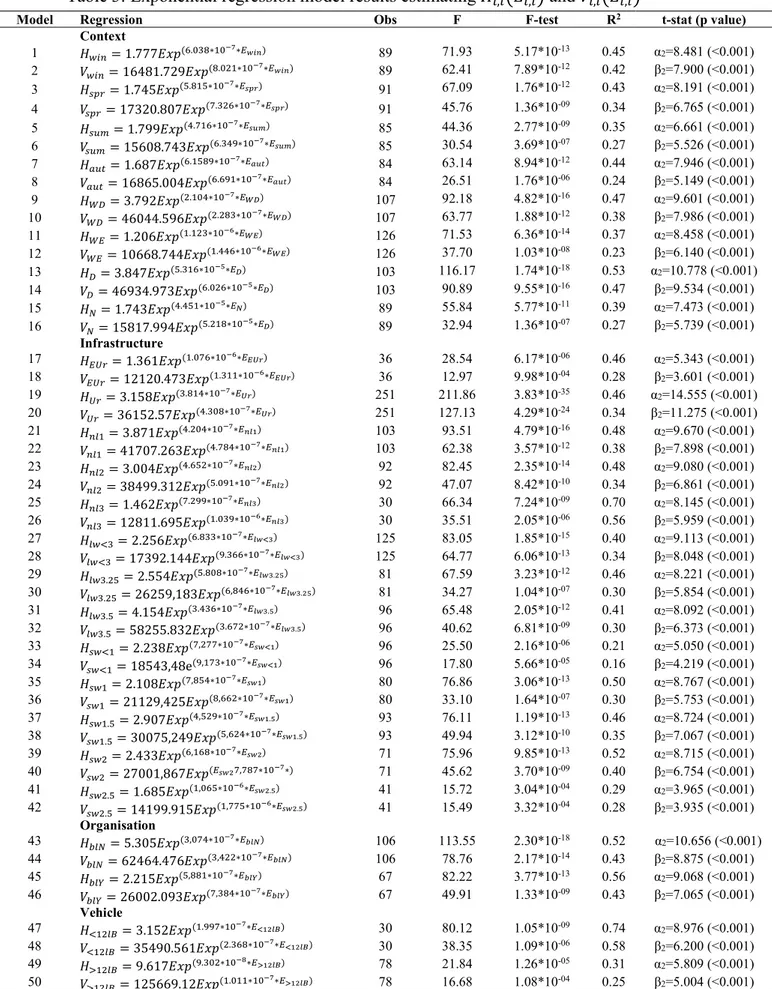
According to the second stage of the method, we estimated 𝐻, 𝐸, and 𝑉, 𝐸, for each intermediate outcome factor i, using Microsoft Excel. A total of 25 intermediate outcome factors were considered and 50 bivariate models were estimated for the prediction of the frequency and the severity of crashes, respectively. The results are reported in Table 3 with the best fit5. All models are significant and fit data well. As expected, more significant models were estimated when a high number of observations (Obs) were available.
The best models are associated with the following intermediate outcome factors i.e., diurnal lighting conditions (13, 14), bus running on urban roads (19-20) and the absence of priority strategy (43, 44). As expected, all significant models provided evidence that by increasing the exposure factor 𝐸,, the frequency 𝐻, and the severity 𝑉, increase as well. Moroever, it is worth noting that some less impacting factors may become more impactful than others as exposure increases.
The results related to the intermediate outcome factors of the context show that summer is the safest season regarding the consequence and frequency (see models 5 and 6), because summer has the lowest estimation of 𝐻, 𝐸, and 𝑉, 𝐸, . Moreover, in the summer, buses travel fewer kilometres than in the other seasons. Models 11 and 12 associated with weekend days provided results of 𝐻, 𝐸, and 𝑉, 𝐸, that were lower than models associated with weekdays for lower values of Ei,l.. Conversely, if the exposure exceeds approximately 1*106 passengers*km, weekdays are safer than weekends. In this case, an increase in passengers*km during holidays is much more impactful than on weekdays. It is possible that bus lanes are less congested during weekends; therefore, vehicles might run at a higher speed. Travelling by day will result in a frequency and severity of a crash slightly greater than travelling by night for each value of exposure. Although the result of severity differs from e.g., Zeeger et al. (1994), it may be justified since urban buses are less exposed to traffic conditions at night.
5 Cheung et al. (2008) and Quintero et al. (2013) adopted a power function regression instead of an exponential one to model the exposure measures. Therefore, we run all models by using a power function regression also. Although all models were significant, they presented worse fits than those reported in this paper.
Table 3: Exponential regression model results estimating 𝐻, 𝐸, and 𝑉, 𝐸,
Model Regression Obs F F-test R2 t-stat (p value)
Context 1 𝐻 = 1.777𝐸𝑥𝑝( . ∗ ∗ ) 89 71.93 5.17*10-13 0.45 α2=8.481 (<0.001) 2 𝑉 = 16481.729𝐸𝑥𝑝( . ∗ ∗ ) 89 62.41 7.89*10-12 0.42 β2=7.900 (<0.001) 3 𝐻 = 1.745𝐸𝑥𝑝( . ∗ ∗ ) 91 67.09 1.76*10-12 0.43 α2=8.191 (<0.001) 4 𝑉 = 17320.807𝐸𝑥𝑝( . ∗ ∗ ) 91 45.76 1.36*10-09 0.34 β2=6.765 (<0.001) 5 𝐻 = 1.799𝐸𝑥𝑝( . ∗ ∗ ) 85 44.36 2.77*10-09 0.35 α2=6.661 (<0.001) 6 𝑉 = 15608.743𝐸𝑥𝑝( . ∗ ∗ ) 85 30.54 3.69*10-07 0.27 β2=5.526 (<0.001) 7 𝐻 = 1.687𝐸𝑥𝑝( . ∗ ∗ ) 84 63.14 8.94*10-12 0.44 α2=7.946 (<0.001) 8 𝑉 = 16865.004𝐸𝑥𝑝( . ∗ ∗ ) 84 26.51 1.76*10-06 0.24 β2=5.149 (<0.001) 9 𝐻 = 3.792𝐸𝑥𝑝( . ∗ ∗ ) 107 92.18 4.82*10-16 0.47 α2=9.601 (<0.001) 10 𝑉 = 46044.596𝐸𝑥𝑝( . ∗ ∗ ) 107 63.77 1.88*10-12 0.38 β2=7.986 (<0.001) 11 𝐻 = 1.206𝐸𝑥𝑝( . ∗ ∗ ) 126 71.53 6.36*10-14 0.37 α2=8.458 (<0.001) 12 𝑉 = 10668.744𝐸𝑥𝑝( . ∗ ∗ ) 126 37.70 1.03*10-08 0.23 β2=6.140 (<0.001) 13 𝐻 = 3.847𝐸𝑥𝑝( . ∗ ∗ ) 103 116.17 1.74*10-18 0.53 α2=10.778 (<0.001) 14 𝑉 = 46934.973𝐸𝑥𝑝( . ∗ ∗ ) 103 90.89 9.55*10-16 0.47 β2=9.534 (<0.001) 15 𝐻 = 1.743𝐸𝑥𝑝( . ∗ ∗ ) 89 55.84 5.77*10-11 0.39 α2=7.473 (<0.001) 16 𝑉 = 15817.994𝐸𝑥𝑝( . ∗ ∗ ) 89 32.94 1.36*10-07 0.27 β2=5.739 (<0.001) Infrastructure 17 𝐻 = 1.361𝐸𝑥𝑝( . ∗ ∗ ) 36 28.54 6.17*10-06 0.46 α2=5.343 (<0.001) 18 𝑉 = 12120.473𝐸𝑥𝑝( . ∗ ∗ ) 36 12.97 9.98*10-04 0.28 β2=3.601 (<0.001) 19 𝐻 = 3.158𝐸𝑥𝑝( . ∗ ∗ ) 251 211.86 3.83*10-35 0.46 α2=14.555 (<0.001) 20 𝑉 = 36152.57𝐸𝑥𝑝( . ∗ ∗ ) 251 127.13 4.29*10-24 0.34 β2=11.275 (<0.001) 21 𝐻 = 3.871𝐸𝑥𝑝( . ∗ ∗ ) 103 93.51 4.79*10-16 0.48 α2=9.670 (<0.001) 22 𝑉 = 41707.263𝐸𝑥𝑝( . ∗ ∗ ) 103 62.38 3.57*10-12 0.38 β2=7.898 (<0.001) 23 𝐻 = 3.004𝐸𝑥𝑝( . ∗ ∗ ) 92 82.45 2.35*10-14 0.48 α2=9.080 (<0.001) 24 𝑉 = 38499.312𝐸𝑥𝑝( . ∗ ∗ ) 92 47.07 8.42*10-10 0.34 β2=6.861 (<0.001) 25 𝐻 = 1.462𝐸𝑥𝑝( . ∗ ∗ ) 30 66.34 7.24*10-09 0.70 α2=8.145 (<0.001) 26 𝑉 = 12811.695𝐸𝑥𝑝( . ∗ ∗ ) 30 35.51 2.05*10-06 0.56 β2=5.959 (<0.001) 27 𝐻 = 2.256𝐸𝑥𝑝( . ∗ ∗ ) 125 83.05 1.85*10-15 0.40 α2=9.113 (<0.001) 28 𝑉 = 17392.144𝐸𝑥𝑝( . ∗ ∗ ) 125 64.77 6.06*10-13 0.34 β2=8.048 (<0.001) 29 𝐻 . = 2.554𝐸𝑥𝑝( . ∗ ∗ . ) 81 67.59 3.23*10-12 0.46 α2=8.221 (<0.001) 30 𝑉 . = 26259,183𝐸𝑥𝑝( , ∗ ∗ . ) 81 34.27 1.04*10-07 0.30 β2=5.854 (<0.001) 31 𝐻 . = 4.154𝐸𝑥𝑝( . ∗ ∗ .) 96 65.48 2.05*10-12 0.41 α2=8.092 (<0.001) 32 𝑉 . = 58255.832𝐸𝑥𝑝( . ∗ ∗ .) 96 40.62 6.81*10-09 0.30 β2=6.373 (<0.001) 33 𝐻 = 2.238𝐸𝑥𝑝( , ∗ ∗ ) 96 25.50 2.16*10-06 0.21 α2=5.050 (<0.001) 34 𝑉 = 18543,48e( , ∗ ∗ ) 96 17.80 5.66*10-05 0.16 β2=4.219 (<0.001) 35 𝐻 = 2.108𝐸𝑥𝑝( , ∗ ∗ ) 80 76.86 3.06*10-13 0.50 α2=8.767 (<0.001) 36 𝑉 = 21129,425𝐸𝑥𝑝( , ∗ ∗ ) 80 33.10 1.64*10-07 0.30 β2=5.753 (<0.001) 37 𝐻 . = 2.907𝐸𝑥𝑝( , ∗ ∗ .) 93 76.11 1.19*10-13 0.46 α2=8.724 (<0.001) 38 𝑉 . = 30075,249𝐸𝑥𝑝( , ∗ ∗ .) 93 49.94 3.12*10-10 0.35 β2=7.067 (<0.001) 39 𝐻 = 2.433𝐸𝑥𝑝( , ∗ ∗ ) 71 75.96 9.85*10-13 0.52 α2=8.715 (<0.001) 40 𝑉 = 27001,867𝐸𝑥𝑝( , ∗ ∗) 71 45.62 3.70*10-09 0.40 β2=6.754 (<0.001) 41 𝐻 . = 1.685𝐸𝑥𝑝( , ∗ ∗ .) 41 15.72 3.04*10-04 0.29 α2=3.965 (<0.001) 42 𝑉 . = 14199.915𝐸𝑥𝑝( , ∗ ∗ .) 41 15.49 3.32*10-04 0.28 β2=3.935 (<0.001) Organisation 43 𝐻 = 5.305𝐸𝑥𝑝( , ∗ ∗ ) 106 113.55 2.30*10-18 0.52 α2=10.656 (<0.001) 44 𝑉 = 62464.476𝐸𝑥𝑝( , ∗ ∗ ) 106 78.76 2.17*10-14 0.43 β2=8.875 (<0.001) 45 𝐻 = 2.215𝐸𝑥𝑝( , ∗ ∗ ) 67 82.22 3.77*10-13 0.56 α2=9.068 (<0.001) 46 𝑉 = 26002.093𝐸𝑥𝑝( , ∗ ∗ ) 67 49.91 1.33*10-09 0.43 β2=7.065 (<0.001) Vehicle 47 𝐻 = 3.152𝐸𝑥𝑝( . ∗ ∗ ) 30 80.12 1.05*10-09 0.74 α2=8.976 (<0.001) 48 𝑉 = 35490.561𝐸𝑥𝑝( . ∗ ∗ ) 30 38.35 1.09*10-06 0.58 β2=6.200 (<0.001) 49 𝐻 = 9.617𝐸𝑥𝑝( . ∗ ∗ ) 78 21.84 1.26*10-05 0.31 α2=5.809 (<0.001) 50 𝑉 = 125669.12𝐸𝑥𝑝( . ∗ ∗ ) 78 16.68 1.08*10-04 0.25 β2=5.004 (<0.001)
The results related to the intermediate outcome factors of the infrastructure show that models associated with extra urban roads (models 17 and 18) generally have the highest values of 𝐻, 𝐸, and 𝑉, 𝐸, . In addition, the greater the number of lanes, the lesser the associated values of 𝐻, 𝐸, and 𝑉, 𝐸, , respectively. As expected, the narrower the lane, the greater the associated values of 𝐻, 𝐸, and 𝑉, 𝐸, , respectively. Perhaps, buses had a crash at a lower speed. However, for exposures lower than 2*106 passengers*km, extra-urban roads with 3 or more lanes (but narrow) are safer than urban roads. Moreover, a larger sidewalk increases the associated values of 𝐻, 𝐸, and 𝑉, 𝐸, , respectively. Although this result may be unexpected, it may be justified as follows: many pedestrians may move on these sidewalks close to the bus stops, and this might result in a higher likelihood of without collision crashes. According to Jovanis et al. (1991), this result may be useful to remember drivers to warn passengers before slowing down to stop at the bus stop.
As for organization factors, unlike Quintero et al. (2013) but according to Goh et al. (2014) these results show that the right of way priority strategy will reduce the associated values of frequency and the severity if the exposure value is up to approximately 4*106 passenger*km.
As for the intermediate outcome factors of the vehicle, the results show that the highest value of 𝐻, 𝐸, and 𝑉, 𝐸, result for standard, long and trolley ones (49, 50) as opposed to mean and short buses (47, 48) for exposure values lower than 2*106 km*passenger. For higher exposure values, longer bus vehicles appear to be the safest bus category.
Next, according to the third stage of the methodology, we can compute the risk index by using eqn. (8) for each route in the most critical conditions.
Then, according to the fourth stage, we can classify each route considering the risk scale. More precisely, referring to the winter weekdays, the risk values for each route are reported in Figure 2 and are presented by using a logarithm scale for ease.
Figure 2: Risk ranking for each route. High-risk routes are reported on the left. It is worth noting that, even if a different method was adoped to analyse data, the results of the route risk ranking are quite similar to those presented in Porcu et al. (2020). However, unlike Porcu et al. (2020), these models can show a different impact of the same factors at increasing rates of exposure.
0,00 10,00 20,00 30,00 40,00 50,00 60,00 70,00 L 1 L 18 L10 L20 L19 L11 17L L16 L12 L21 L15 L7 L8 L9 L22 L23 L2 3L L14 L13 L5 L4 L6 L og R Route code R1 R2 R3 R4
Several observations can be made from these results, giving particular attention to the R1 routes.
First, almost all the R1 routes have a medium-sized length. Nevertheless, the highest number of daily trips, operating hours, high frequency, and a relevant number of passengers further affect the exposure values of these routes, thus resulting in the greatest risk. Since these characteristics affect (increase) the passenger*km, it is not a surprise that the risk value increases. Second, R1 routes are characterized by 1 or 2 lanes per travel direction and have a lane width lower than 3.25 m with relatively large sidewalks. These characteristics cannot guarantee safer manoeuvrability and result in the highest risk values for higher exposure values.
Some recommendations follow. First, the PTC is suggested to revise the paths by addressing routes on roads with 1 and/or 2 lanes per travel direction and with narrow sidewalks, if any. Moreover, bus routes may benefit by a right of way priority strategy to reduce the risk of crash by separating the different traffic flows on the streets.
Second, standard and trolley buses are the safest type of vehicles to use for high values of exposure. Therefore, the PTC should consider the possibility of using these types of vehicles only on bus routes with higher values of passenger*km if clearly possible according to the accessibility of the paths and the availability in their fleet.
Finally, in order to obtain more accurate results, the PCT is advised to refine its crash database with more data on exposure and final and intermediate safety factors. Therefore, it is essential that the PTC improves the characteristics of its crash database by collecting as much information as possible from each bus crash.
4 Conclusions and Research Perspectives
Crash risk assessment on bus routes can help PTCs to improve their safety performance and could reduce the insurance premium costs. Nevertheless, as far as the authors know, there was a gap in the literature on the assessment of the crash risk in bus transits, especially regarding the frequency and the severity of the crash as a function of exposure factors.
This paper proposed an adjusted methodology to assess the crash risk in the transit network for each bus route by integrating safety factors, prediction models and risk assessment methods. Moreover, the experimentation of this method is illustrated in a real case study. This method can support the PTC to qualify for ISO 39001 (2012). In addition, the models calibrated in this study can be useful to assess the crash risk for new planned routes.
Further developments may follow from this study. First, it could be interesting to evaluate the crash risk types (e.g., sideswipe, rear-end, etc.) and causes, to understand which treatments may reduce and/or eliminate specific risks. Second, this framework is based on the prediction of many bivariate models of frequency and severity of crashes as input for the risk computation. A complex bivariate (frequency and severity) risk model with all intermediate outcome factors and exposure factors will be developed. This model may help derive a compact set of significant factors to explain the frequency and severity of crashes to measure the crash risk for each route.
References
Af Wåhlberg, A.E., (2002). Characteristics of low speed crashes with buses in public transport. Accident Analysis & Prevention, 34(5), 637-647.
Af Wåhlberg, A.E., (2004). Characteristics of low speed crashes with buses in public transport: part II. Accident Analysis & Prevention, 36(1), 63-71.
Albertsson, P., & Falkmer, T. (2005). Is there a pattern in European bus and coach incidents? A literature analysis with special focus on injury causation and injury mechanisms. Accident Analysis & Prevention, 37(2), 225-233.
Andreassen, D. C. (1989). Some aspects of accident costing and costs in Australia. Australian Road Research, 19(3), 205-215.
Andrews, J. D., & Moss, T. R. (2002). Reliability and risk assessment. Wiley-Blackwell. ISO 31010 (2009). Risk Management-Risk Assessment Techniques Geneva:
International Standards Organisation.
Barabino, B., Corona, G., & Angius, E. (2006). A methodology for the reconstruction of the "type" accident in a bus network: An Italian case. Ingegneria Ferroviaria, 61(5), 413-430.
Barabino B. & Di Francesco M. (2016). Characterizing, measuring, and managing transit service quality. Journal of Advanced Transportation, 50 (5), 818–840.
Barabino B. (2018). Automatic recognition of ‘low-quality’ vehicles and bus stops in bus services. Public Transport, 10(2), 257–289.
Barabino, B., Cabras, N. A., Conversano, C., & Olivo, A. (2020). An integrated approach to select key quality indicators in transit services. Social Indicators Research, 1-36.
https://doi.org/10.1007/s11205-020-02284-0
Bonera, M., Maternini, G., Parkhurst, G., Paddeu, D., Clayton, W., & Vetturi, D. (2020). Travel experience on board urban buses: A comparison between Bristol and Brescia. European Transport/Trasporti Europei, 76, 1-12.
Cafiso, S., Di Graziano, A., & Pappalardo, G. (2013). Road safety issues for bus transport management. Accident Analysis & Prevention, 60, 324-333.
Cheung, C., Shalaby, A., Persaud, B., & Hadayeghi, A. (2008). Models for safety analysis of road surface transit. Transportation Research Record, (2063), 168-175.
CCPS (1995). Guidelines for Chemical Transportation Risk Analysis, American Institute of Chemical Engineers: New York, 1995.
CTM (2020). “Carta della mobilità 2019-2020”, Cagliari, Italy, Available: http://www.ctmcagliari.it/
Evans, W. A., & Courtney, A. J. (1985). An analysis of accident data for franchised public buses in Hong Kong. Accident Analysis & Prevention, 17(5), 355-366.
Fine, W.T. (1971) Mathematical Evaluations for Controlling Hazards. Journal of Safety Research, 3, 157-166.
Goh, K. C. K., Currie, G., Sarvi, M., & Logan, D. (2014). Bus accident analysis of routes with/without bus priority. Accident Analysis & Prevention, 65, 18-27.
ISO 39001 (2012). Road Traffic Safety (RTS) Management Systems: Requirements with Guidance for Use. Geneva: International Standards Organisation.
Italian Ministry of Transport (2010). Studio di valutazione dei Costi Sociali dell’incidentalità stradale.
Jovanis, P. P., Schofer, J. L., Prevedouros, P., & Tsunokawa, K. (1991). Analysis of bus transit accidents: Empirical, methodological, and policy issues. Transportation Research Record, 1322, 17-28.
Kaplan, S., & Prato, C. G. (2012). Risk factors associated with bus accident severity in the United States: A generalized ordered logit model. Journal of Safety Research, 43(3), 171-180.
Law, T. H., Daud, M. S., Hamid, H., & Haron, N. A. (2017). Development of safety performance index for intercity buses: An exploratory factor analysis approach. Transport Policy, 58, 46-52.
Mannering, F. L., & Bhat, C. R. (2014). Analytic methods in accident research: Methodological frontier and future directions. Analytic Methods in Accident Research, 1, 1-22.
Mitsakis, E., Stamos, I., Grau, J. M. S., & Morfoulaki, M. (2015). Bus drivers risk perception of roadway hazards. Periodica Polytechnica Transportation Engineering, 43(1), 22-26.
Mullai, A. (2006). Risk management system-risk assessment frameworks and techniques (Vol. 5, No. 2006). DaGoB (Safe and Reliable Transport Chains of Dangerous Goods in the Baltic Sea Region) Project Office, Turku School of Economics, Turku, Finland. Porcu, F., Olivo, A., Maternini, G., & Barabino, B. (2020). Evaluating bus accident risks
in public transport. Transportation Research Procedia, 45, 443-450.
Prato, C. G., & Kaplan, S. (2014). Bus accident severity and passenger injury: evidence from Denmark. European Transport Research Review, 6(1), 17-30.
Quintero, L., Sayed, T., & Wahba, M. M. (2013). Safety models incorporating graph theory based transit indicators. Accident Analysis & Prevention, 50, 635-644.
Shah, S., Ahmad, N., Shen, Y., Pirdavani, A., Basheer, M., & Brijs, T. (2018). Road safety risk assessment: an analysis of transport policy and management for low-, middle-, and high-income Asian countries. Sustainability, 10(2), 389.
Strathman, J. G., Wachana, P., & Callas, S. (2010). Analysis of bus collision and non-collision incidents using transit ITS and other archived operations data. Journal of Safety Research, 41(2), 137-144.
Tiboni, M., & Rossetti, S. (2013). Implementing a road safety review approach for existing bus stops. WIT Transactions on the Built Environment, 130, 699-709.
Ye, Z., Wang, C., Yu, Y., Shi, X., & Wang, W. (2016). Modeling level-of-safety for bus stops in China. Traffic Injury Prevention, 17(6), 656-661.
Zegeer, C. V., Huang, H. F., Stutts, J. C., Rodgman, E., & Hummer, J. E. (1994). Commercial bus accident characteristics and roadway treatments. Transportation Research Record, 1467, 14-22.
Acknowledgements
This work has been partially supported by the Italian Ministry of University and Research (MIUR), within the Smart City framework (project: PON04a2_00381 “CAGLIARI 2020”) and POR FESR Sardegna 2014-2020 (project: CUP-G58C17000100006 “SIVAP”).
This study was supported by the MIUR (Ministry of Education, Universities and Research [Italy]) through a project entitled WEAKI TRANSIT: WEAK-demand areas Innovative TRANsport Shared services for Italian Towns (Project protocol: 20174ARRHT_004; CUP Code: F74I19001290001), financed with the PRIN 2017 (Research Projects of National Relevance) program. We authorize the MIUR to reproduce and distribute reprints for Governmental purposes, notwithstanding any copyright notations thereon. Any opinions, findings, and conclusions or recommendations expressed in this material are those of the authors and do not necessarily reflect the views of the MIUR.
The authors are very grateful to the CTM senior management for its support in this work and the opportunity to illustrate the results. Anyway, the views expressed in this paper are solely those of the authors and do not necessarily reflect those of the CTM.