Sigla di identificazione Distrib. Pago
Mh.
Ricerca Sistema Elettrico XCI RTEN- LP3 - 004Titolo
RELAP 5 pre-analysis on the HELENA facility for operational transients
Descrittori
Tipologia del documento: Rapporto tecnico
L 1
Collocazione contrattuale: Accordo di programma ENEA-MSE: tema di ricerca "Nuovo
nucleare da fissione"
Argomenti trattati: Generation IV Reactor
Reattori nucleari veloci Analisi di sistema Termoidraulica
Sommario
di
32
This work concerns the thermal-hydraulic pre-test analysis carried out to study the operational transients of the HELENA facility, designed at ENEA Brasimone Research Centre to qualify. the structural material proposed for the impeller of the centrifugai pump foreseen in LFRs. The simulations were performed using a version of the RELAP5/Mod.3.3 code purposely modified to account for lead properties and behavior. In the first part of the work the generai characteristics of the nodalization set-up for the HELENA loop are described, trying to give particular attention to the implementation of the pump component.
The second part of the activity deals with the analysis of results obtained by the code in relation to two different operational transients characterized by the different value of the friction loss coefficient of the calibrated orifice present inside the primary loop.
The obtained results suggest a possible start-up procedure of the HELENA facility and a first indication of its thermal-hydraulic behaviour.
Note Il presente documento recepisce il doc. CIRTEN-UNIPI RL 1076-2010
2 NOME
FIRMA
1 NOME
FIRMA
O EMISSIONE 2i'09/2010 NOME NA ~fanoMcwtj NA
-XlP lmlfJ
FIRMACIRTEN
CONSORZIO INTERUNIVERSITARIO PER LA RICERCA TECNOLOGICA NUCLEARE
UNIVERSITA’DIPISA
DIPARTIMENTO DI INGEGNERIA MECCANICA, NUCLEARE E DELLA PRODUZIONE
RELAP 5 pre-test analysis
on the HELENA facility
for operational transients
CIRTEN - UNIPI RL-1076/2010
AUTORI
N. Forgione, F. Oriolo, S. Palazzo
Pisa, September 2010
Lavoro svolto in esecuzione della linea progettuale LP3 punto C2 - AdP ENEA MSE del 21/06/07
Summary
This work concerns the thermal-hydraulic pre-test analysis carried out to study the operational transients of the HELENA facility, designed at ENEA Brasimone Research Centre to qualify the structural material proposed for the impeller of the centrifugal pump foreseen in LFRs. The simulations were performed using a version of the RELAP5/Mod.3.3 code purposely modified to account for lead properties and behavior.
In the first part of the work the general characteristics of the nodalization set-up for the HELENA loop are described, trying to give particular attention to the implementation of the pump component. The second part of the activity deals with the analysis of results obtained by the code in relation to two different operational transients characterized by the different value of the friction loss coefficient of the calibrated orifice present inside the primary loop.
The obtained results suggest a possible start-up procedure of the HELENA facility and a first indication of its thermal-hydraulic behaviour.
INDEX
Summary ... 2
1. RELAP5 nodalization ... 4
1.1 Primary loop ... 7 1.2 Secondary loop ... 152. Transient simulations... 17
2.1 Test matrix ... 17 2.2 Test A... 17 2.3 Test B... 263. Conclusions ... 31
1. RELAP5 nodalization
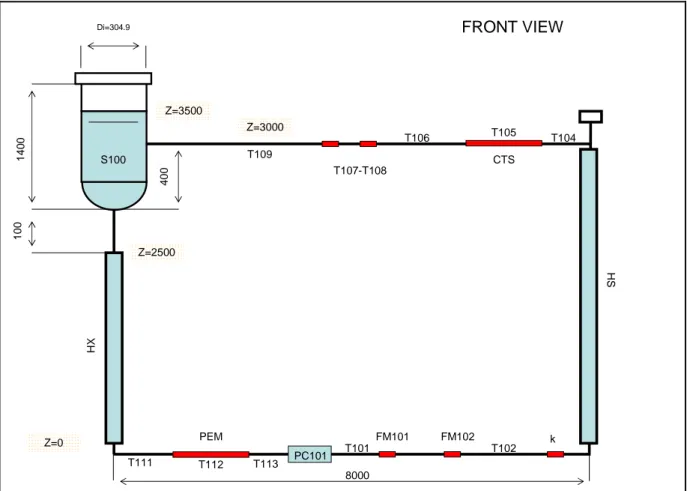
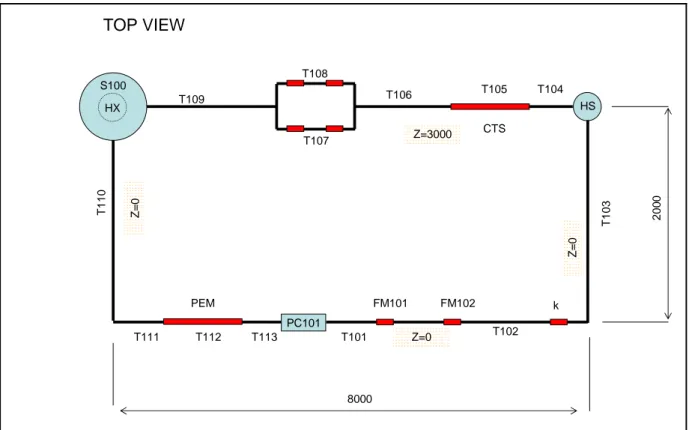
The HELENA facility, shown in Figures 1 and 2, was designed at ENEA Brasimone Research Centre to qualify the structural material proposed for the impeller of the centrifugal pump foreseen in LFRs of Generation IV. The primary loop, containing lead as working fluid, mainly consists of the heated and cooled sections, the centrifugal pump, the expansion vessel and the section with two parallel branches for the qualification of isolation ball valves. The pressurized water circulating into the secondary side of the Heat Exchanger (HX) removes the heat generated in the primary loop by the four electrical pins placed in the Heater System (HS). Stainless steel AISI 304 is taken into account as structural material for the design of all the components of this facility, which have also a superficial roughness value of 3.2·10-5 m and an external insulation of mineral rock-wool of 0.1 m. The RELAP5 nodalization set up to study the thermal-hydraulics behavior of the operational transients of HELENA facility is reported in Figure 3. Below, the adopted nodalization is explained in detail starting with the primary loop (in a counter-clockwise direction) and then with the secondary loop of the Heat Exchanger.
FRONT VIEW Z=3000 Z=3500 S100 Di=304.9 140 0 100 40 0 Z=2500 Z=0 HX HS k FM102 FM101 PEM PC101 CTS 8000 T107-T108 T109 T105 T106 T104 T101 T102 T112 T113 T111
TOP VIEW S100 T107 T108 Z=3000 T109 T106 T105 T104 HS Z= 0 T1 03 PC101 20 0 0 k FM102 FM101 T101 Z=0 T102 PEM HX T111 T112 T113 CTS T11 0 Z= 0 8000
Figure 3. RELAP5 Nodalization. TMDPVOL 300 TMDPVOL 320 PUMP 10 (PC-101) J-45 J-55 ANNULUS 310 (HX) PIPE 20 (T-101) PIPE 30 (T-102) PIPE 40 (T-103) PIPE 50 (HEATER) PIPE 70 (C.T.S. T-105) PIPE 60 (T-104) PIPE 80 (T-106) PIPE 200 (T-113) PIPE 190 (P.E.M. T-112) PIPE 180 (T-111) TMDPJUN 305 BRANCH 85 BRANCH 95 PIPE 90 (T-107) PIPE 91 (T-108) PIPE 100 (T-109) PIPE 170 (T-110) PIPE 140 PIPE 130 (S-100) PIPE 110 (S-100) PIPE 150 PIPE 160 (HX) TMDPVOL 120 J-25 J-35 J-65 J-75 J-135 J-145 J-175 J-185 J-195 J-315 J-165 J-155 x y z J-115 BRANCH 105
1.1 Primary loop
PUMP 10
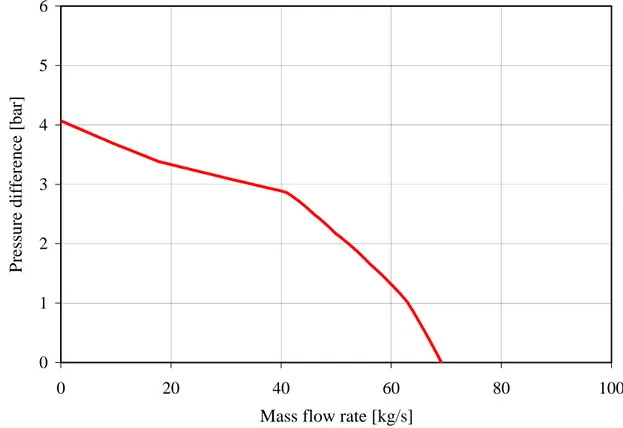
This component connects the outlet section of the pipe 200 with the inlet section of the pipe 20, with a flow area that has been taken equal to the minimum flow area of the adjoining volumes. The pressure-flow curve of the centrifugal pump was chosen so that at the nominal lead mass flow rate of 35 kg/s the pressure head corresponds to the nominal value of about 3 bar (see Figure 4). The main geometrical parameters of this component are:
Ac-s = 3.0857E-3 m2 L = 0.1 m (horizontal) 0 1 2 3 4 5 6 0 20 40 60 80 100
Mass flow rate [kg/s]
P
ressure di
fference [ba
r]
Figure 4. Performance characteristic of the centrifugal pump used in RELAP5.
PIPE 20
This pipe represents the section of the loop in which two different mass flow meters are expected to be installed. The main geometrical parameters of this component, located in the lower side of the primary loop (see Figure 3), are:
Di =Dhyd = 0.06268 m
Ac-s = 3.0857E-3 m2
SINGLE JUNCTION 25
It connects the outlet section of the pipe 20 with the inlet section of the pipe 30, with a flow area that is taken equal to the minimum flow area of the adjoining volumes (see Figure 3). The pressure loss coefficient considered in this junction is zero both for forward and reversed flow.
PIPE 30
The main geometrical parameters of this component, located in the lower side of the primary loop (see Figure 3), are:
Di =Dhyd = 0.06268 m
Ac-s = 3.0857E-3 m2
L = 2.0 m (horizontal) SINGLE JUNCTION 35
This junction represents a calibrated orifice, used to control friction losses and, consequently, the characteristic curve of the entire primary loop. It connects the outlet section of pipe 30 with the inlet section of pipe 40, with a flow area that is taken equal to the minimum flow area of the adjoining volumes (see Figure 3). The nominal value of the pressure loss coefficient considered in this junction is 30.0 both for forward and reversed flow.
PIPE 40
The main geometrical parameters of this component, located in the lower side of the primary loop (see Figure 3), are:
Di =Dhyd = 0.06268 m
Ac-s = 3.0857E-3 m2
L = 2.0 m (horizontal) SINGLE JUNCTION 45
It connects the outlet section of pipe 40 with the inlet section of pipe 50, with a flow area that is taken equal to the minimum flow area of the adjoining volumes (see Figure 3). The pressure loss coefficient considered in this junction is 0.5 both for forward and reversed flow.
PIPE 50
This pipe represents the heating section of the loop. The thermal power is generated by four cylindrical rods disposed in a square rod array with a pitch to diameter value of 1.6, having an active length of 1 m. The presence of the spacer grids in this component is considered by inserting a pressure loss coefficient value of about 9.0.
The main geometrical parameters of this component, located in the right side of the primary loop (see Figure 3), are:
Di =Dhyd = 0.03835 m Ac-s = 2.8744E-3 m2 p/D = 1.6 Drod = 0.0082 m L = 3.0 m (vertical, upward) SINGLE JUNCTION 55
It connects the outlet section of pipe 50 with the inlet section of pipe 60, with a flow area that is taken equal to the minimum flow area of the adjoining volumes (see Figure 3). The pressure loss coefficient considered in this junction is 0.5 both for forward and reversed flow.
PIPE 60
The main geometrical parameters of this component, located in the upper side of the primary loop (see Figure 3), are:
Di =Dhyd = 0.06268 m
Ac-s = 3.0857E-3 m2
L = 2.0 m (horizontal) SINGLE JUNCTION 65
It connects the outlet section of pipe 60 with the inlet section of pipe 70, with a flow area that is taken equal to the minimum flow area of the adjoining volumes (see Figure 3). The pressure loss coefficient considered in this junction is zero both for forward and reversed flow.
PIPE 70
This pipe represents the corrosion test section (C.T.S.) of the loop. The main geometrical parameters of this component, located in the upper side of the primary loop (see Figure 3), are:
Di =Dhyd = 0.06268 m
Ac-s = 3.0857E-3 m2
L = 2.0 m (horizontal) SINGLE JUNCTION 75
It connects the outlet section of pipe 70 with the inlet section of pipe 80, with a flow area that is taken equal to the minimum flow area of the adjoining volumes (see Figure 3). The pressure loss coefficient considered in this junction is zero both for forward and reversed flow.
PIPE 80
The main geometrical parameters of this component, located in the upper side of the primary loop (see Figure 3), are:
Di =Dhyd = 0.06268 m
Ac-s = 3.0857E-3 m2
L = 1.0 m (horizontal) BRANCH 85
It is a volume with three “internal” junctions. The first junction (J-1) connects the outlet section of pipe 80 with the inlet section of branch 85 with a flow area that is taken equal to the minimum flow area of the adjoining volumes; the pressure loss coefficient considered in this junction is zero both for forward and reversed flow. The second junction (J-2) connects the outlet section of
branch 85 with the inlet section of pipe 90, with a flow area that is taken equal to the minimum
flow area of the adjoining volumes; the pressure loss coefficient considered in this junction is 1.0 both for forward and reversed flow because of the presence of ball valves. The third junction (J-3) connects the outlet section of branch 85 with the inlet section of pipe 91 with a flow area that is taken equal to the minimum flow area of the adjoining volumes; the pressure loss coefficient considered in this junction is 1.0 both for forward and reversed flow because of the presence of ball valves.
The main geometrical parameters of this component (see Figure 3) are:
Di =Dhyd = 0.06268 m
Ac-s = 3.0857E-3 m2
L = 0.05 m (horizontal) PIPE 90
This pipe represents the first branch of the section used to test the ball valves. The main geometrical parameters of this component, located in the upper side of the primary loop (see Figure 3), are:
Di =Dhyd = 0.06268 m
Ac-s = 3.0857E-3 m2
PIPE 91
This pipe represents the second branch of the section used to test the ball valves. The main geometrical parameters of this component, located in the upper side of the primary loop (see Figure 3), are:
Di =Dhyd = 0.06268 m
Ac-s = 3.0857E-3 m2
L = 1.4 m (horizontal) BRANCH 95
It is a volume with three “internal” junctions. The first junction (J-1) connects the outlet section of pipe 90 with the inlet section of branch 95, with a flow area that is taken equal to the minimum flow area of the adjoining volumes; the pressure loss coefficient considered in this
junction is 1.0 both for forward and reversed flow because of the presence of ball valves. The
second junction (J-2) connects the outlet section of pipe 91 with the inlet section of branch 95 with a flow area that is taken equal to the minimum flow area of the adjoining volumes; the pressure loss coefficient considered in this junction is 1.0 both for forward and reversed flow because of the presence of ball valves. The third junction (J-3) connects the outlet section of the
branch 95 with the inlet section of pipe 100, with a flow area that is taken equal to the minimum
flow area of the adjoining volumes; the pressure loss coefficient considered in this junction is zero both for forward and reversed flow.
The main geometrical parameters of this component (see Figure 3) are:
Di =Dhyd = 0.06268 m
Ac-s = 3.0857E-3 m2
L = 0.05 m (horizontal) PIPE 100
The main geometrical parameters of this component, located in the upper side of the primary loop (see Figure 3), are:
Di =Dhyd = 0.06268 m
Ac-s = 3.0857E-3 m2
BRANCH 105
This volume represents the inlet part of the expansion vessel. It includes the description of three “internal” junctions, which connect it to the downward region of the loop. The first junction (J-1) connects the outlet section of pipe 100 with the inlet section of branch 105, with a flow area that is taken equal to the minimum flow area of the adjoining volumes; the pressure loss coefficient considered in this junction is 0.9 both for forward and reversed flow. The second junction (J-2) connects the branch 105 with the inlet section of pipe 110, with a flow area that is taken equal to the minimum flow area of the adjoining volumes; the pressure loss coefficient considered in this
junction is zero both for forward and reversed flow. The third junction (J-3) connects branch 105
with the inlet section of pipe 130, with a flow area that is taken equal to the minimum flow area of the adjoining volumes; the pressure loss coefficient considered in this junction is zero both for forward and reversed flow.
The main geometrical parameters of this component, located in the left side of the primary loop (see Figure 3), are:
Di =Dhyd = 0.30486 m
Ac-s = 0.72995 m2
L = 0.05 m (horizontal) PIPE 110
It represents the upper part of the expansion vessel that is only partially filled with liquid lead in order to contain the variation of fluid volume during the transient. In particular, with the primary fluid at rest, around 52% of its volume is filled with lead and the remaining 48% with argon. The main geometrical parameters of this component, located in the left side of the primary loop (see Figure 3), are:
Di =Dhyd = 0.30486 m
Ac-s = 0.72995 m2
L = 0.95 m (vertical, upward) SINGLE JUNCTION 115
It connects the outlet section of pipe 110 with the inlet section of time dependent volume 120, with a flow area that is taken equal to the minimum flow area of the adjoining volumes (see Figure 3). The pressure loss coefficient considered in this junction is zero both for forward and reversed flow.
TIME DEPENDENT VOLUME 120
It is totally filled with argon that has a pressure of 1.1 bara and a temperature of 673.15 K during all the simulated transients.
The main geometrical parameters of this component located in the left side of the primary loop (see Figure 3), are:
Ac-s = 100.0 m2
L = 1.0 m (horizontal) PIPE 130
This pipe represents the lower part of the expansion vessel component. The main geometrical parameters of this component, located in the left side of the primary loop (see Figure 3), are:
Di =Dhyd = 0.30486 m
Ac-s = 0.72995 m2
L = 0.40 m (vertical, downward) SINGLE JUNCTION 135
It connects the outlet section of pipe 130 with the inlet section of pipe 140, with a flow area that is taken equal to the minimum flow area of the adjoining volumes (see Figure 3). The pressure loss coefficient considered in this junction is 0.5 both for forward and reversed flow.
PIPE 140
The main geometrical parameters of this component, located in the left side of the primary loop (see Figure 3), are:
Di =Dhyd = 0.06268 m
Ac-s = 3.0857E-3 m2
L = 0.10 m (vertical, downward) SINGLE JUNCTION 145
It connects the outlet section of pipe 140 with the inlet section of pipe 150, with a flow area that is taken equal to the minimum flow area of the adjoining volumes (see Figure 3). The pressure loss coefficient considered in this junction is zero both for forward and reversed flow.
PIPE 150
It represents the inlet part of the HX. The main geometrical parameters of this component, located in the left side of the primary loop (see Figure 3), are:
Ac-s = 3.0857E-3 m2
L = 0.5 m (vertical, downward) SINGLE JUNCTION 155
It connects the outlet section of pipe 150 with the inlet section of pipe 160, with a flow area that is taken equal to the minimum flow area of the adjoining volumes (see Figure 3). The pressure loss coefficient considered in this junction is zero both for forward and reversed flow.
PIPE 160
This pipe represents the primary side of the HX. The typology of this heat exchanger is tube in tube model, having the internal wall, that separates primary and secondary fluids, total filled with aluminum powder. The main geometrical parameters of this component, located in the left side of the primary loop (see Figure 3), are:
Di =Dhyd = 0.06268 m
Ac-s = 3.0857E-3 m2
L = 2.0 m (vertical, downward) SINGLE JUNCTION 165
It connects the outlet section of pipe 160 with the inlet section of pipe 170, with a flow area that is taken equal to the minimum flow area of the adjoining volumes (see Figure 3). The pressure loss coefficient considered in this junction is 0.5 both for forward and reversed flow.
PIPE 170
The main geometrical parameters of this component, located in the left side of the primary loop (see Figure 3), are:
Di =Dhyd = 0.06268 m
Ac-s = 3.0857E-3 m2
L = 2.0 m (horizontal) SINGLE JUNCTION 175
It connects the outlet section of pipe 170 with the inlet section of pipe 180, with a flow area that is taken equal to the minimum flow area of the adjoining volumes (see Figure 3). The pressure loss coefficient considered in this junction is 0.5 both for forward and reversed flow.
PIPE 180
The main geometrical parameters of this component, located in the left side of the primary loop (see Figure 3), are:
Di =Dhyd = 0.06268 m
Ac-s = 3.0857E-3 m2
L = 1.0 m (horizontal) SINGLE JUNCTION 185
It connects the outlet section of pipe 180 with the inlet section of pipe 190, with a flow area that is taken equal to the minimum flow area of the adjoining volumes (see Figure 3). The pressure loss coefficient considered in this junction is zero both for forward and reversed flow.
PIPE 190
The main geometrical parameters of this component, located in the left side of the primary loop (see Figure 3), are:
Di =Dhyd = 0.06268 m
Ac-s = 3.0857E-3 m2
L = 2.0 m (horizontal) SINGLE JUNCTION 195
It connects the outlet section of pipe 190 with the inlet section of pipe 200, with a flow area that is taken equal to the minimum flow area of the adjoining volumes (see Figure 3). The pressure loss coefficient considered in this junction is zero both for forward and reversed flow.
PIPE 200
The main geometrical parameters of this component, located in the left side of the primary loop (see Figure 3), are:
Di =Dhyd = 0.06268 m
Ac-s = 3.0857E-3 m2
L = 0.9 m (horizontal)
1.2 Secondary loop
TIME DEPENDENT VOLUME 300
It is totally filled with water that has a pressure of 50 bara and a temperature of 503.15 K during all the simulated transients. The main geometrical parameters of this component, located in the left side of the primary loop (see Figure 3), are:
Ac-s = 100.0 m2
TIME DEPENDENT JUNCTION 305
It connects the time dependent volume 300 with the inlet section of annulus 310, with a flow area that is taken equal to the minimum flow area of the adjoining volumes. By this type of junction the water mass flow rate in the secondary side of the HX was imposed.
ANNULUS 310
This annulus represents the secondary side of the heat exchanger. In particular, the water flows through the outer side of the coaxial tube of HX in counter-current direction. The main geometrical parameters of this component, located in the left side of the primary loop (see Figure 3), are:
Di =Dhyd = 0.01336 m
Ac-s = 2.0058E-3 m2
L = 2.0 m (vertical, upward) SINGLE JUNCTION 315
It connects the outlet section of the annulus 310 with the inlet section of the time dependent
volume 320, with a flow area that is taken equal to the minimum flow area of the adjoining
volumes. The pressure loss coefficient set in this junction is 0.5 both for forward and reversed flow.
TIME DEPENDENT VOLUME 320
It is totally filled with argon that has a pressure of 50 bara and a temperature of 673.15 K for the initial instants of the transients, just before the start of the water injection inside the cooler system. The main geometrical parameters of this component, located in the left side of the primary loop (see Figure 3), are:
Ac-s = 100.0 m2
2. Transient simulations
2.1 Test matrixA detailed analysis of the thermal-hydraulic behaviour of the HELENA loop during operational transients was performed by the RELAP5/Mod.3.3 system code, modified at the University of Pisa to allow for lead as working fluid.
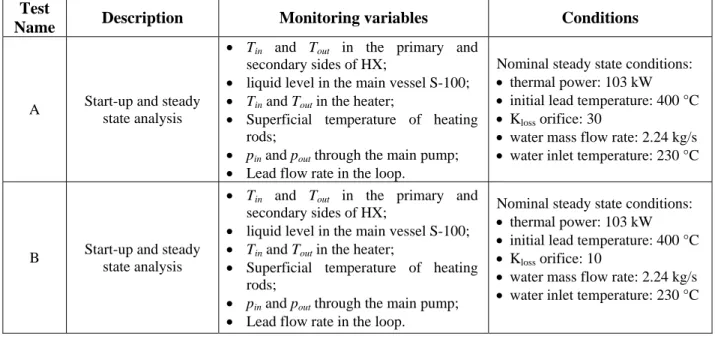
The test matrix of the simulations performed in the present work is shown in Table 1, which summarises the adopted boundary conditions and the main variables that were monitored.
Test
Name Description Monitoring variables Conditions
A Start-up and steady state analysis
• Tin and Tout in the primary and secondary sides of HX;
• liquid level in the main vessel S-100; • Tin and Tout in the heater;
• Superficial temperature of heating rods;
• pin and pout through the main pump; • Lead flow rate in the loop.
Nominal steady state conditions: • thermal power: 103 kW • initial lead temperature: 400 °C • Kloss orifice: 30
• water mass flow rate: 2.24 kg/s • water inlet temperature: 230 °C
B Start-up and steady state analysis
• Tin and Tout in the primary and secondary sides of HX;
• liquid level in the main vessel S-100; • Tin and Tout in the heater;
• Superficial temperature of heating rods;
• pin and pout through the main pump; • Lead flow rate in the loop.
Nominal steady state conditions: • thermal power: 103 kW • initial lead temperature: 400 °C • Kloss orifice: 10
• water mass flow rate: 2.24 kg/s • water inlet temperature: 230 °C
Table 1. HELENA test matrix.
2.2 Test A
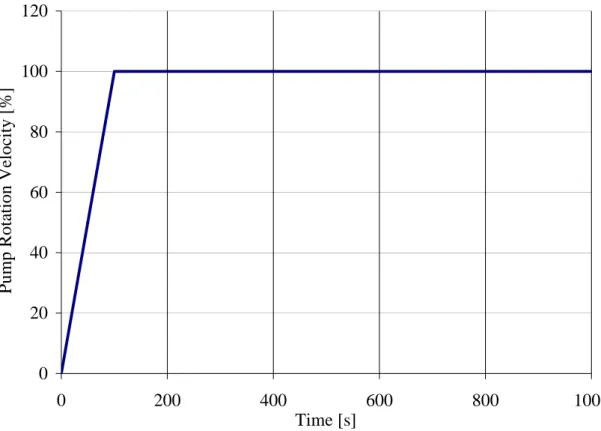
In this simulation, the nominal flow rate conditions were achieved by increasing the pump rotation velocity linearly in the first 100 s of transient and then maintaining it constant for the remaining duration of the simulation (see Figure 5).
0 20 40 60 80 100 120 0 200 400 600 800 1000 Time [s] Pump Rota tion Ve loc ity [% ]
Figure 5. Main pump rotation velocity.
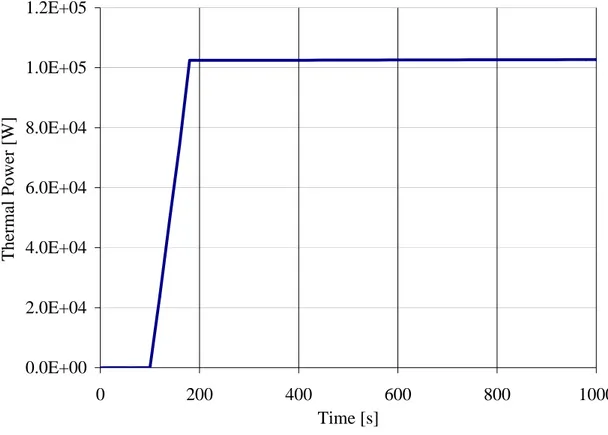
The generated thermal power produced by the four heating rods was released in the pipe 50 with a time trend shown in Figure 6. In particular, during the first 100 s the thermal power was not delivered to avoid a too high temperature increase until the mass flow rate was zero or relatively low. From 100 to 180 s the thermal power was linearly increased up to 103 kW and then was maintained.
The water flow rate in the secondary side of the heat exchanger (HX) was increased in a linear way from 200 to 260 s of the transient starting from zero to 2.24 kg/s and then is maintained constant (see Figure 7); the inlet temperature in the secondary side of the HX was imposed through the time-dependent volume 300 at 230 °C. In order to avoid a sudden drop in temperature of lead in the primary side of the loop during the first phases of the transient, the secondary side of HX was considered full of argon, having the same temperature of lead in the primary side of the loop.
0.0E+00 2.0E+04 4.0E+04 6.0E+04 8.0E+04 1.0E+05 1.2E+05 0 200 400 600 800 1000 Time [s] Thermal P o wer [W]
Figure 6. Thermal power imposed on pipe 50.
0 0.5 1 1.5 2 2.5 0 200 400 600 800 1000 Time [s]
Water Flow Rate [kg/s]
Concerning the initial conditions, the temperatures of all the components were initialized at 400 °C, while pressure was given the values corresponding to the gravimetric pressure present in the volumes with stagnant fluid.
The main goals of this simulation were the analysis the loop's behaviour during the start-up transient until reaching operational conditions; the time trend of some of the parameters, like temperature, pressure and flow rate have to be considered.
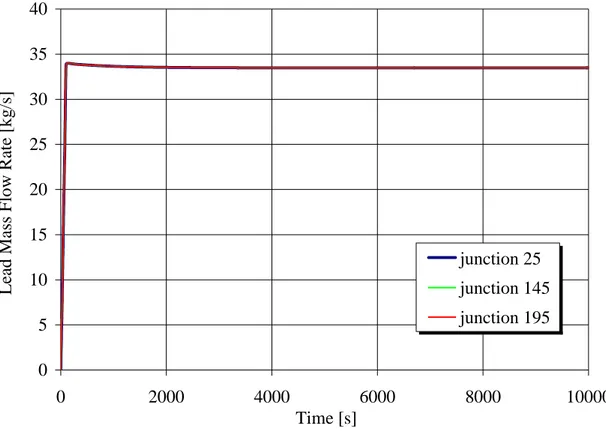
The calculated time trends of lead mass flow rates through the junctions 25, 145 and 195 are shown in Figure 8. As can be seen, the flow rate through each component increases from zero to 100 s in a linear way, reaching the nominal value of about 33.5 kg/s. The mass flow rate, after suffering a slight increase due to the inertia of the fluid caused by reaching the maximum speed of the pump, remains nearly constant in the remaining phase of the simulation.
0 5 10 15 20 25 30 35 40 0 2000 4000 6000 8000 10000 Time [s]
Lead Mass Flow Rate [kg/s]
junction 25 junction 145 junction 195
Figure 8. Lead mass flow rate in the primary loop.
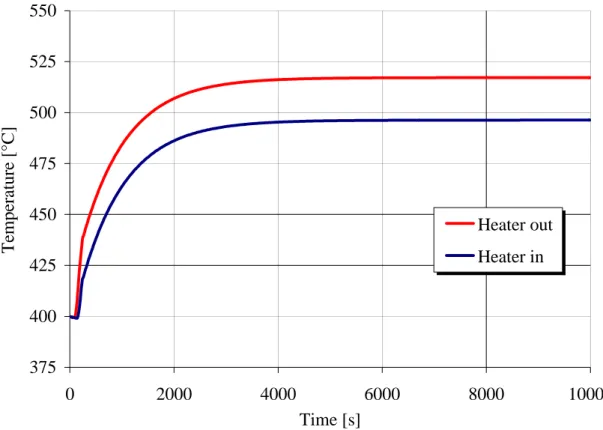
In Figure 9, we can observe the time trend of the lead temperatures in the inlet and outlet section of component 50, representing the heater section of the loop. It can be noted that these temperatures remained approximately constant in the first 100 s, due to the fact that in this period the thermal power was not provided; a small decrease in temperature observed during the first seconds after the beginning of simulation was caused by the heat exchange of each loop's structures with the outer environment. From 100 to 240 s the outlet temperature increased rapidly
because in this phase the rate of thermal power increase was high and, at the same time, the water mass flow rate in the HX had not yet reached its nominal value. The inlet temperature, however, maintained its initial value till 160 s due to the transit time of the fluid in the circuit, associated with the mixing phenomena that occurs between the hot fluid leaving the heat section and the cold fluid present in the other volumes, such as the main reservoir expansion vessel (S-100). After about 160 s the lead temperature started to increase throughout the loop and also in the inlet heater section with a linear trend.
375 400 425 450 475 500 525 550 0 2000 4000 6000 8000 10000 Time [s] Tem p erat ure [°C ] Heater out Heater in
Figure 9. Temperatures in component 50.
After 8000 s from the beginning of the transient, the lead temperature reached an asymptotic value of 496 °C in the inlet section of the heater system and, approximately, 517 °C in the outlet section.
In Figure 10, the time trend of inlet and outlet lead temperature in the primary side of the heat exchanger can be observed. In this case both the inlet and outlet temperatures also remained similar for the first 120 s of the transient and, then, a rapid temperature increase in the primary side of HX, when the power was provided in the heater section (after 100 s), can be observed. About 220 seconds after the start of the test began the heat removal, due to the rapid injection of water into the secondary side of the heat exchanger, that induces a greater rate of lead temperature increase at the HX outlet section respect to the one at the inlet section.
375 400 425 450 475 500 525 550 0 2000 4000 6000 8000 10000 Time [s] Tem p erat ure [°C ] HX_ inlet HX_outlet
Figure 10. Temperature upstream and downstream of the primary side of the HX.
Concerning the HX secondary side, the temperature time trends are illustrated in Figure 11. Both inlet and outlet temperatures reflect what was observed in the inlet section of HX primary side. At the beginning of the test these temperatures were coincident between them and with the initial temperature of the lead in the primary side of the loop. The start of the water injection in the secondary side at 200 s caused a sudden drop of the temperatures; the HX inlet temperature settles at a set value of 230 °C, while the HX outlet temperature reached a slightly higher value and then tends asymptotically to a value of about 240 °C.
Furthermore, the surface temperatures of the rods that are placed into the heating section were evaluated. In Figure 12 three different temperature values are illustrated, which correspond to that measured at the bottom, middle and top section of a single heating rod. As might be expected, the temperature trend is similar to that seen in Figure 9, where the lead temperatures in the heating section are reported. Each temperature underwent a fast growth due to the rapid activation of the heating rods and then stabilized itself asymptotically at a maximum value of 586 °C at the end of the test.
200 240 280 320 360 400 0 2000 4000 6000 8000 10000 Time [s] Tem p erat ure [°C ] HX_outlet HX_inlet
Figure 11. Temperature in the secondary side of the HX.
350 400 450 500 550 600 650 0 2000 4000 6000 8000 10000 Time [s] Tem p erat ure [°C ] top section middle section bottom section
The second important parameter that characterizes the HELENA loop is pressure; it was monitored at the inlet and outlet sections of the pump because the operating point on the characteristic curve depends on this value. The inlet pressure decreased reaching a nominal value of about 4.33 bar (see Figure 13) at about 2000 s, while the outlet pressure rapidly reached the steady state value of 7.33 bar after 160 s, caused by the fast activation of the centrifugal pump.
3.5 4.0 4.5 5.0 5.5 6.0 6.5 7.0 7.5 8.0 0 2000 4000 6000 8000 10000 Time [s] Pressure [bar] pump outlet pump inlet
Figure 13. Inlet and outlet pressure in the pump.
In Figure 14 the differential pressure value measured through the main pump is illustrated. At the steady state condition this parameter reached the nominal value of 3 bar, which represents the expected total friction loss through the entire loop. The reaching of maximum speed rotation of the pump after 100 s from the start of the simulation corresponds to the attainment of maximum differential pressure value, as can be seen comparing the graphs of Figures 5 and 14.
0.0 0.5 1.0 1.5 2.0 2.5 3.0 3.5 4.0 0 2000 4000 6000 8000 10000 Time [s] P ressure [bar]
Figure 14. Differential pressure measured through the main pump.
The last parameter that can be put in evidence in Test A is the liquid level in the component 110, that represents the upper part of the expansion vessel. In Figure 15 it is possible to observe how the liquid level in pipe 110 remained constant in the first phase of the transient because of the absence of thermal power. The level variation was not influenced much by an increase in the lead mass flow rate, but only after the activation of the heating rods, at about 120 s, a rapid rising in lead level can be noted. At the end of the simulation the liquid level value inside the expansion vessel showed a total increase of about 1.5 % with respect to the initial value (see Figure 15). The total liquid lead present in S-100 vessel at the beginning of the transient corresponds to a level of 0.9 m, while at the steady state condition the level reaches a value of about 0.92 m.
0.900 0.904 0.908 0.912 0.916 0.920 0.924 0 2000 4000 6000 8000 10000 Time [s] S-100 Liquid Level [m]
Figure 15. Liquid level in the expansion vessel S-100 (components 105, 110 and 130).
2.2 Test B
The aim of this simulation was to verify the behaviour of the main parameters that characterize HELENA loop when the friction losses inside the circuit were decreased by varying the pressure loss coefficient in the calibrated orifice, represented by the junction 35 in the nodalization (see Figure 3). In the following comparison of the computational results obtained for this test was made with respect to the Test A.
The variation of pressure through the main pump represents the immediate effect that can be pointed out after the drop of the pressure loss coefficient, as shown in Figure 16. The curves trends correspond to that already analyzed in Test A with the difference related to the liquid lead pressure that flows out of the main pump, which reaches a value of about 7.0 bar instead of 7.33 bar for the Test A, while the inlet pressure stabilizes itself at a value of 4.2 bar (cfr. Figure 16 with Figure 13).
3.5 4.0 4.5 5.0 5.5 6.0 6.5 7.0 7.5 0 2000 4000 6000 8000 10000 Time [s] Pressure [bar] pump outlet pump inlet
Figure 16. Inlet and outlet pressure in the pump.
This reduction in outlet pressure value can be put in evidence in Figure 17, in which the pressure difference between the outlet and the inlet sections in both the tests A and B are visualized, as results from the decrease in friction loss coefficient. The differential pressure measured in the last simulation reaches 2.8 bar, showing a variation of 0.2 bar in respect to the previous simulation.
A decrease in friction loss coefficient caused an increases of the flow of the liquid metal (see Figure 18). The total lead mass flow rate achieved a value of about 41.3 kg/s at the end of the transient simulation with a difference of almost 7.8 kg/s respect to the value obtained in Test A. Another important parameter that was influenced by a variation of friction loss coefficient is the lead temperature inside the loop; in Figure 19 both the inlet and outlet temperatures of the lead that flow through the heating section are shown. In order to make a better comparison between these temperature trends and those calculated in the previous test, all are included in the same graph. It is possible to observe that the temperature flowing out of the heater asymptotically reached a value of about 511 °C, less than that obtained in Test A, while the inlet temperature stabilizes at a value of 494 °C, which is very closed to that calculated in Test A.
0.0 0.5 1.0 1.5 2.0 2.5 3.0 3.5 4.0 0 2000 4000 6000 8000 10000 Time [s] P ressure [bar] Test A Test B
Figure 17. Differential pressure measured through the main pump.
0 5 10 15 20 25 30 35 40 45 0 2000 4000 6000 8000 10000 Time [s]
Lead Mass Flow Rate [kg/s]
Test A Test B
375 400 425 450 475 500 525 550 0 2000 4000 6000 8000 10000 Time [s] Tem p erat ure [°C ]
Heater out (Test A) Heater out (Test B) Heater in (Test A) Heater in (Test B)
Figure 19. Temperatures in component 50.
Also the superficial temperatures of the heating rods showed a reduction in value with respect to that calculated in Test A. The Figure 20 illustrated superficial temperatures at the initial and final section of the heating rods inserted in the heater component 50. The temperature calculated at the top part of the rods decreased to 572 °C, that is 14 °C less than the same temperature obtained in the previous Test A, while, regarding the temperature at the bottom part of the heating rods, a value of 557 °C, that is 9 °C less than the same temperature obtained in the previous Test A is reached.
The last parameter that can be taken into account was the lead liquid level variation in the main expansion vessel S-100. The slight decrease of the lead temperature inside the loop caused a modest difference of this parameter compared to the value obtained with the Test A, as shown in Figure 21, where both the trends are reported.
375 425 475 525 575 625 0 2000 4000 6000 8000 10000 Time [s] Tem p erat ure [°C ]
top section (Test A) top section (Test B) bottom section (Test A) bottom section (Test B)
Figure 20. Superficial temperatures of the heating rod at different elevations.
0.900 0.904 0.908 0.912 0.916 0.920 0.924 0 2000 4000 6000 8000 10000 Time [s] S-100 Liquid Level [m] Test A Test B
3. Conclusions
The results obtained in the prediction by the RELAP5 code of the start-up and steady state scenarios for the HELENA facility give important information about the thermal-hydraulic behaviour of this circuit for what concerns the lead temperature in the heater system and in the heat exchanger, the liquid level inside the expansion vessel S-100 and the lead flow rate inside the primary loop for two different pressure loss conditions.
In particular, the level variation inside the expansion vessel observed during both the analysed transients results very negligible respect to the total available free volume. The maximum surface temperature of the heater rods remain under a value of 600 °C, limiting the level of the lead temperature inside the loop under 520 °C.
Future developments of the present work will involve the implementation in the RELAP model of the pressure-flow curve of the centrifugal pump that will be effectively installed in the HELENA facility and the simulation of the main accidental transients.