XXX-X-XXXX-XXXX-X/XX/$XX.00 ©20XX IEEE
In-line monitoring of laser welding using
a smart vision system
Simone Pasinetti, Giovanna Sansoni, Franco Docchio Department of Mechanical and Industrial Engineering University of Brescia
Brescia, Italy [email protected] Abstract— This paper presents a vision system for the in-line
monitoring of laser welding. The system is based on a coaxial optical setup purposely chosen to guarantee robust detection of the joints and optimal acquisition of the melt pool region. Two procedures have been developed: the former focuses on keeping the laser head locked to the joint during the welding; the latter monitors the appearance of the keyhole region. The system feedbacks the joint position to the robot used to move the welding laser and monitors the penetration state of the laser. The goal is to achieve a continuous adaptation of the laser parameters (power, speed and focusing) to guarantee the weld quality. The developed algorithms have been designed to optimize the system performance in terms of the elaboration time and of accuracy and robustness of the detection. The overall architecture follows the Industrial Internet of Things approach, where vision is embedded, edge-based analysis is carried out, actuators are directly driven by the vision system, a latency-free transmission architecture allows interconnection as well as the possibility to remotely control multiple delocalized units.
Keywords—image processing, laser welding, melt pool analysis and characterization, IoT.
I. INTRODUCTION
Smart manufacturing is a key concept in the Industry 4.0 paradigm. It expresses the evolution of the manufacturing enterprises toward a very high level of interconnection and cooperation of their resources. Both Information Technologies (IT) and Operational Technologies (OT) will contribute to develop very high integration at all levels inside the factory. Among the OTs, those concurrent to increase the efficiency and spread of advanced automation are of interest at the levels of production, maintenance and quality control, for their smart implementation.
Vision systems and image processing tools are very promising in this context. Recent developments are in the directions of miniaturizing the vision components and of increasing their affordability, in view of embedding and connecting them for a number of applications in process control, robotics and human-machine interaction.
In this paper we present a smart approach to the in-line monitoring of a laser welding process. The activity has been developed in collaboration with TTM Laser S.p.A. an Italian company specialized in the construction of laser welding machines. The welding of metallic sheets is very critical, especially in relation with the control of the process parameters (i.e.: laser power, focus condition and welding speed). To
guarantee a good quality of the welding in real-time, a specific vision system has been developed and suitable image processing implemented to constantly monitor the melt pool, in view of closing the loop with the laser equipment, to adapt the process parameters in-line in an integrated work-frame. This paper presents the hardware and the software components of the vision system, and the most interesting experimental results.
II. THE VISION SYSTEM FOR IN-LINE MONITORING OF THE LASER WELDING PROCESS
Welding closed-loop control plays a key role in the implementation of a smart process, characterized by high quality of the weld, safety and shortened time. These objectives require a continuous monitoring of the melt pool, to allow the on-time variation of the laser power, the lens focusing, the speed of the welding head and its position with respect to the weld joint.
Among the techniques developed to perform the process parameters control, those based on the analysis of the plasma emitted in the ultraviolet [1] or in the infrared ranges [2] are well known, as well as those exploiting the analysis of either acoustic waves [3], or reflected laser light [4]. A number of methods have been developed to perform reliable robot-based seam tracking, either based on the use of contact sensors [5], or acoustic waves [6], or magnetic field sensors [7]. Simplicity and robustness are the main characteristics of the proposed solutions; however, they lack in flexibility and in completeness of the parameters taken in consideration. To overcome these limitations, the research has been addressed toward the development of vision systems, which process the images acquired from the field whilst the welding is being performed; the main advantage is the possibility of reconfiguring them depending on the particular application, by designing the image processing chain which is more peculiar for that application [8], [9], [10].
The vision system presented in this paper follows this philosophy: a single optical head, mounted on a robot manipulator, acquires the scene coaxially with the welding head. The images are captured by a video camera and are analyzed by two different elaboration chains. The former (thereafter called Seam Tracking: SeaT) performs the tracking of the weld joint, and guarantees that the welding laser is kept in the optimal position with respect to the two joints; the latter, (called Keyhole Monitor: KeyM) monitors the melt pool, and feedbacks information about the quality of the welding. The overall idea follows the Industrial Internet of Things approach, where vision is embedded, edge-based analysis is carried out, actuators are directly driven by the vision system, a latency-free transmission
architecture allows interconnection, as well as the possibility to remotely control multiple delocalized units.
A. The hardware setup
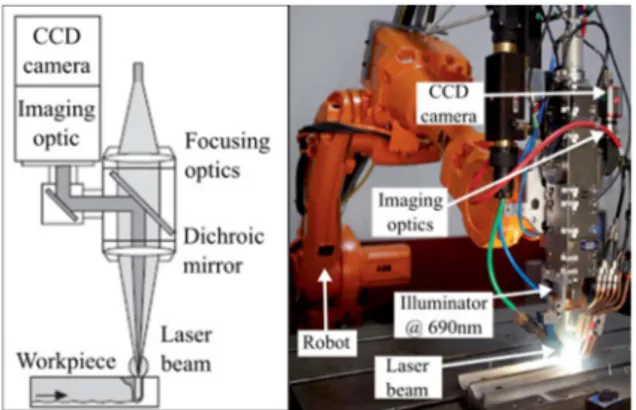
The system, shown in Fig. 1, is based on a Basler Giga-Ethernet ACE640-100Gm camera, an ABB-IRC5 robot controller and an anthropomorphic manipulator IRB4600-60/2.05. The camera is embedded in an optical head Precitec YW-52, mounted on the robot manipulator. This configuration allows the camera to coaxially acquire the field of interest, moving with the robot arm, along the joint. The LabView 2014 Platform has been used to develop the image processing operations, using the IMAQ Vision VI palette [11].
Fig. 1. The system hardware. Schematic layout of the optical head (left) and welding head mounted on the robot arm (right).
The camera is connected to a CompactRIO controller, allowing the embedded integration of machine vision, motion control and industrial I/O within a single, high performance controller. The architecture is shown in Fig. 2: acquired images are sent to the CompactRIO for fast, local elaboration. The vision output is sent to the robot, which actuates the motion trajectory, and to the optical head controller, for closing the loop on the laser welding parameters. The CompactRIO is connected to a supervisor computer for image storing, and further data analysis: the architecture is open, and allows the central unit to remotely monitor multiple welding stations, and to store data from each one for further analysis.
Fig. 2. Scheme of the system architecture.
The camera is equipped with a 50 mm focal length lens and the image resolution is 659 by 494 pixels. Both the intrinsic parameters (used for compensating optical and perspective distortions) and the extrinsic parameters (estimating the camera
pose and orientation with respect to the measurand) have been estimated [12], [13].
The resulting dimension of the FOV is 11 mm by 8.1 mm, leading to a spatial resolution Rs of 16.7 μm/px. The minimum value of the feature, which can be reliably detected in this experimental setup, has been evaluated equal to 33.4 μm [14]. A dedicated illumination system is provided, to decouple the effect of laser illumination from the melt pool. The device is the Cavilux HF (Cavitar Inc), which illuminates the scene at 640 nm: this wavelength is far from the laser source, a Nd:YAG laser emitting at 1064 nm, so that the two light sources can be easily decoupled by means of an optical filter at 960 nm. The effect of this solution is well visible in Fig. 3, showing the scenes acquired in the two different illumination conditions: in the image at left, the melt pool is completely hidden by the plasma light, while, in the image at right, the features of interest are well visible. These are the joint (black, vertical segment in the upper part of the figure), and the keyhole (the part of the melt pool framed by the oval overlay) [15]. In the following sections the two procedures developed to track the joint and to segment the keyhole from the melting pool are presented.
(a) (b) Fig. 3. Influence of the illumination on the visibility of the melt pool. (a) Image
of the melt pool in the absence of the light at 690nm; (b) image of the melt pool in the presence of the light at 690 nm and of the optical filter at 960 nm.
B. The SeaT Procedure
The SeaT procedure focuses on keeping the laser head locked to the joint during the welding, as schematically shown in Fig. 4.
Since the camera is mounted coaxially with the laser head, the joint region is always visible in the top region of each frame, as shown in Fig. 3. Hence, the idea is to perform a frame-by-frame estimate of both the joint center position and of the joint width and to calculate the offset that must be applied to the current position of the welding tool, along the direction perpendicular to the motion, to keep it aligned with the center of the joint. To this aim, a region of interest is defined in correspondence with the joint (J_ROI in Fig. 5.a), and a line profile analysis is carried out. Since the joint region is markedly darker than the background, it can be segmented by analyzing the gray levels along a suitable number of lines, as shown in the figure. For each profile a thresholding is carried out to detect the joint region (bold line in Fig. 5.b). The difference d and the mean value m between the position indexes of points A and B estimate the joint gap and the position of the joint center C respectively. To cope with noise, the average values μd and μm of parameters
d and m are taken over the total number of lines respectively
[16].
(a)
(b)
Fig. 5. The algorithm developed in the SeaT procedure. (a) Line profiles applied to J-ROI; (b) thresholding and definition of gap length d and center C.
Average values μd and μm at frame n are compared to the
ones calculated at frame n-1: if the corresponding differences are within a predefined interval, current values μd and μm are
transformed into real world coordinates and sent to the robot controller for the appropriate motion of the laser head. A suitably developed camera calibration algorithm performs the conversion from pixels to millimeters [17]. In contrast, for values μd and μm
significantly higher than those evaluated at the previous frame, no offset is provided, and the next frame is elaborated. The idea behind this procedure is that the joint does not exhibit sudden changes in shape, so that the offset between consecutive frames must be confined in a narrow range. On the other hand, it is reasonable to attribute large discrepancies to noise.
C. The KeyM Procedure
The aim of this procedure is to detect incomplete keyhole penetration, because this situation yields non-optimal welds. This task is performed monitoring the appearance of the keyhole region. Fig. 3.b shows how the melt pool looks like
during the process: it is drop-shaped, oriented symmetrically with respect to the welding direction, and positioned in the central part of the image. There are a number of very bright spots, due to residual reflections of the laser. The keyhole corresponds to the circular shaped region framed by the oval in the figure: in the presence of full penetration, this region presents a darker spot, roughly in the centre of the keyhole. The detection of both the lighter area inside the oval (thereafter called upper keyhole aperture) and of the darker area (lower
keyhole aperture) with respect to the background is mandatory
to reveal if the welding process performs correctly (i.e., both the apertures are present), or if the laser does not penetrate along the material thickness (i.e., the lower aperture is absent). The problem is not trivial, since both false positive and false negative detections are possible. Robustness and simplicity of the elaboration are the two main requirements, to cope with the light disturbances and the elaboration rate. Fig. 6 shows the basic steps of the KeyM procedure. In the first step, a ROI centered in correspondence with the position of the laser beam is defined (Fig. 6.a): due to coaxial acquisition, the keyhole will appear at this position, during welding. In the second step, the image regions corresponding to saturated gray levels are removed (a simple threshold is applied) and replaced with black blobs; a dilation of very dark gray values is then applied, to reduce residual border effects (Fig. 6.b) [18]. In the third step, a thresholding mechanism is applied as follows: (i) four line profiles, oriented as shown in Fig. 6.c are extracted from each image, (ii) the mean line profile among them is calculated, (iii) the maximum (max) and the minimum (min) gray levels on the mean profile are extracted and combined as follows:
ΤΗ = [(max-min) x 0.35] + min (1)
(a) (b) (c)
(d) (e) (f) Fig. 6. Basic steps of the KeyM procedure. (a) ROI definition; (b) saturated spots suppression; (c) line profiles calculation; (d) effect of the binarization; (e) effect of the morphological operations applied to the image; (f) image masking. In Eq. (1), TH is the threshold used to binarize the image. The thresholding is adaptive to each single frame and robust against noise. The result of this step is shown in Fig. 6.d, where the keyhole region corresponds to the central blob in the image. To better segment it with respect to the background, suitable
morphological operations are carried out: the blobs at the border are rejected, and the residual particles are filtered out depending on their area and position (fourth step). The result is presented in Fig. 6.e; this image is used to mask the one in Fig. 6.a, leading to the result shown in Fig. 6.f, where the keyhole is segmented from the image (upper keyhole aperture detection). The last step of the procedure is aimed at detecting the darker area (lower
keyhole aperture) within the upper keyhole aperture. An iterative
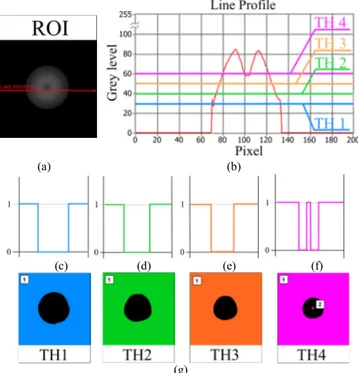
algorithm has been designed, where a threshold is used to binarize the image and blob counting is carried out at each iteration. When two blobs are detected the algorithm stops, and reports the full penetration occurrence; a suitable exit condition is provided in case the full penetration is not detected. Fig. 7 clarifies the concept.
(a) (b)
(c) (d) (e) (f)
(g)
Fig. 7. Iterative procedure for the detection of the full penetration condition. (a) Simulated full penetrating keyhole; (b) gray levels of the line profile in the image at left; (c) binarized profile for TH1; (d) binarized profile for TH2; (e) binarized profile for TH3; (f) binarized profile for TH4; (g) blob detection for thresholds TH1-TH4.
The image in Fig. 7.a represents a simulated keyhole in case of full penetration; the plot in Fig. 7.b is the gray level profile of the image corresponding to the red line of the image on the left. This profile presents a central minimum, corresponding to the lower keyhole aperture region. Starting from a threshold value TH1, the gray levels grater than TH1 are set to 1 and the other ones are set to 0, resulting in the binary profile shown in Fig. 7.c. For increasing values of the thresholds (TH2 and TH3 in the figure) the portion of values set to zero decreases, resulting in the profiles of Fig. 7.d and Fig. 7.e. When the threshold equals TH4, the regions set to zero are doubled, as shown in Fig. 7.f: this condition is used to detect the presence of the lower keyhole aperture, and to stop the loop. The extension of this process to the whole image is carried out through blob analysis, as presented in Fig. 7.g, where, for each threshold value the detected blobs are shown.
III. EXPERIMENTAL RESULTS
The SeaT procedure has been applied to the analysis of a suitable number of videos of joints differing both in their dimension and orientation. An example of the results in shown in Fig. 8, for joints differing in the dimension of the gaps and in their orientation with respect to the welding direction. The joint in Fig. 8.a presents a gap of 0.730 mm: the gap value estimated by the algorithm equals 43.7 pixels, (solid white line ovarlayed to the image) yielding a length of 731 μm (calculated as 43.7 (px) x 16.7 (mm/px)). The oval at the center of the line overlays the position of the centre of the joint. The joint in the central image of the figure spans about 33 μm, i.e., it is at the spatial resolution limit. Nevertheless, the gap is detected and corresponds to the 2.1 pixels wide line visible in Fig. 8.b. The image in Fig. 8.c corresponds to the region captured for a non linear joint, 55 μm wide: the gap is detected but underestimated in width (the solid line spans about 11 pixels, corresponding to 185 μm), the reason being the smoothness of the joint borders, which result in low values of the image edges. However, the same effect is observable in all the subsequent frames: this underestimation represent a common mode distubance, which does not affect the estimate of the offset applied between consecutive frames. The elaboration time is 30 ms for each frame, which is adequate considering that the laser speed is in the order of 3,000 mm/min.
(a) (b) (c) Fig. 8. Performance of the SeaT procedure. (a) Linear joint with 0.73 mm gap; (b) linear joint with 0.033 mm gap; (c) non linear joint with 0.55 mm gap.
The KeyM procedure has been evaluated during welding sessions performed at pre-set values of the process parameters (laser power and lens focusing), to control in advance the quality of the welding. An example of the performance is presented in Fig. 9. The output of the algorithm is shown in Fig. 9.a: the green check identifies the frames where the algorithm detects a welding state consistent with the actual welding, either in the case of incomplete penetration (as from frame 15 to frame 84) or in the case of full penetration (as in frames from 116 to 144). The red cross identifies those frames where the algorithm fails: as an example, frames 113, 148 and 178 correspond to a full penetration state, but the algorithm does not detect it (i.e., only the upper aperture is recognized). Fig. 9.b and Fig. 9.c report the error occurrences of the algorithm over the whole frame sequence (crosses represent the algorithm output, and rectangular frames represent the actual state of penetration). It is quite evident that the error rate is very low: on average, in the worse case, wrong detections are lower that 3.2 %. The performance in terms of the elaboration time is quite satisfactory, especially considering the high variability of the image features, due to
unpredictable reflections of the laser light: mean values span from 20 ms to 30 ms.
(a)
(b)
(c)
Fig. 9. Example of the analysis of a welding. (a) output of the algorithm; (b) upper aperture detection; (c) lower aperture detection
The sensitivity of the algorithm has been evaluated as the ratio between the number TP of True Positive detections and the number P of Positive situations, corresponding to the actual presence of full penetration. The specificity has been evaluated as the ratio between the number TN of True Negative detections and the number N of Negative situations, corresponding to the absence of the penetration. P and N have been determined by counting the number of frames in each video where the penetration was full and partial/absent respectively. Referring again to the examples in Fig. 9.b and Fig. 9.c, the sensitivity is 0.98 and 0.92 respectively; the specificity is 0.83 and 0.97 respectively.
IV. CONCLUSIONS
In this paper a vision system for the in-line monitoring of laser welding processes has been presented. The system is based on a coaxial optical setup purposely chosen to guarantee robust detection of the joints and optimal acquisition of the melt pool. Two procedures have been presented, the former providing robust tracking of the joints, the latter implementing the continuous detection of the penetration of the laser in correspondence with the weld joint, by detecting the upper and the lower apertures of the keyhole. Simple processing, using thresholding, binarization and blob counting has been implemented, following the criterium of achieving the maximum performance at the minimum elaboration time. The analysis carried out so far shows the robustness of the detection against the high variability of the illumination of the melt pool and the low visibility of the keyhole features. The vision system is being tested on a weld unit produced by TTM, where the feedback to the welding head parameters yields increased quality of the welds. As a result human intervention is strongly reduced, the system parameters are controlled seamlessly and the process can be controlled remotely. The system architecture follows the Industrial Internet of Things approach, where the vision unit is integrated in the communication infrastructure. The parallel monitoring of multiple welding units is then possible from a remote single central unit. Moreover, the availability of a huge quantity of images and of corresponding analysis results opens the door to the development of a Machine Learning approach for the keyhole monitoring, exploiting Neural Network-based algorithms.
ACKNOWLEDGMENTS
The authors acknowledge Marco Tebaldi and Elia Bertelli for their invaluable contribution in the development of the research.
REFERENCES
[1] J. Kwon, O. Kwon, Y. Jang, K. Lee, H. Choi, S. Hong, “Development of Neural network based Plasma Monitoring System for Laser Welding Quality Analysis”, IEEE TENCON, pp. 678-681, 1999.
[2] P. G. Sanders, K. H. Leong, J. S. Keske, G. Kornecki, “Real-time monitoring of laser beam welding using infrared weld emissions”, J. Las. Appl., vol. 10, n. 5, pp. 205-212, 1998.
[3] D. Farson, A. Ali, Y. Sang,”Realtionship of optical and acustic emissions to laser weld penetration”, Weld. J., vol. 77, n. 4, pp. 142s-148s, 1998. [4] D. P. Hand, C. Peters, J. D. C. Jones, “Nd: YAG laser welding
processmonitoring by non-intrusive optical detection in the fibre optic delivery system”, Meas. Sci. Tech., vol. 6, n. 9, pp. 1389-1394, 1995.
[5] J. G. Bollinger, “Using a tactile sensor to guide a robotic welding machine”, Sens. Rev., vol. 1, n. 3, pp. 136-141, 1981.
[6] F. B. Prinz, K.T. Gunnarson, Robotic seam tracking, The Robotic Institute, Pittsburgh, Pennsylvania, 1984.
[7] F. B. Prinz, J. Hoburg, “Sensor for seam characterization in robotic arc welding”, Proc. Winter Meet. ASME, pp. 278-287, 1982.
[8] B. Regaard, S. Kaierle, R. Poprawe, “Seam-tracking for high precision laser welding applications methods, resctrictions and enhanced concepts”, J. Las. Appl., vol 21, n. 4, pp. 183-195, 2009.
[9] X. Yanling, Y. Huanwei, Z. Jiyong, L. Tao, C. Shanben, “Real time seam tracking control technology during welding based on passive vision sensor”, J. Mat. Proc. Tech., vol. 212, n. 8, pp. 1654-1662, 2012. [10] F. Bardin, A. Cobo, J. M. Lopez-Higuera, O. Collin, P. Aubry, T. Dubois,
M. Högström, P. Nylen, P. Jonsson, J. D. Jones, D. P. Hand, “Closed-loop power andfocus control of laser welding for full penetration monitoring”, App. Opt., vol. 44, n. 1, pp. 13-21, 2005.
[11] National Instruments, IMAQ Vision for Labview User Manual, National Instruments, 2004.
[12] G. Sansoni, P. Bellandi, F. Docchio, “3D system for the measurement of tube eccentricity: an improved, rugged, easy to calibrate layout”, Meas. Sci. Tech., vol 24, n. 3, 035901, 2013.
[13] P. Bellandi, G. Sansoni, A. Vertuan, “Development and characterization of a multi-camera 2D-vision system for enhanced performance of a drink serving robotic cell”, Rob. Comp. Int. Manuf., vol. 28, n. 1, pp. 35-49, 2012.
[14] P. West, A roadmap for building a machine vision system, Imagenation, Portland, Oregon.
[15] B. Martin, A. Loredo, M. Pilloz, D. Grevey, “Characterisation of cw Nd : YAG laser keyhole dynamics”, Opt. Las. Tech., vol. 33, pp. 201–207, 2001.
[16] G. Arulmozhi, Statistics For Management, 2nd ed., Tata McGraw-Hill Education, Pennsylvania, 2009.
[17] A. Gruen, T. S. Huang, Calibration and Orientation of Cameras in Computer Vision, 1st ed., Springer-Verlag, Berlin, 2001.
[18] T. B. Moeslund, Introduction to video and image processing, 1st ed., Springer Verlag, London, 2012.