Foam injection molding with
physical blowing agents
Unione Europea UNIVERSITÀ DEGLI STUDI DI SALERNO
FONDO SOCIALE EUROPEO
Programma Operativo Nazionale 2007/20013 “Ricerca Scientifica, Sviluppo Tecnologico, Alta Formazione”
Regioni dell’Obiettivo 1 – Misura III.4 “Formazione superiore ed universitaria”
Department of Industrial Engineering
Ph.D. Course in “Scienza e tecnologie per
l’industria chimica, farmaceutica e alimentare”
(XI Cycle-New Series)
Foam Injection molding with physical blowing
agents
Supervisor
Ph.D. student
Prof. Giuseppe Titomanlio
Valentina Volpe
Prof. Roberto Pantani
Scientific Referees
Prof. Lih-Sheng (Tom) Turng
Prof. Volker Altstädt
Ph.D. Course Coordinator
Acknowledgments
At the end of these three years, full of challenges but also of moments of joy and of satisfaction, I must thank all those who, in different ways, have allowed to accomplish my work in the best way.
A special thanks to Prof. Giuseppe Titomanlio for guided and helped me from the beginning.
I cannot find the right words to express my gratitude and the enormous esteem for Prof. Roberto Pantani. In more than 7 years we have shared many experiences but above all he taught me many things, both from the academic and from the human point of view. Today, that with sadness and a little fear I realized that the time to leave “I1” is getting closer, I want to say thank to him because, if I have arrived so far, it is mainly due to him!
Special thanks to Prof. Turng and Prof. Altstadt for their availability and their valuable advice.
Thanks to all those who have put their knowledge at my disposal: Prof. Berenika Hausnerova, Prof. Tom Sedlacek and Ing. Paolo Addesso.
All these years would not have been so intense and pleasant without Andrea Sorrentino, Vito Speranza, Felice De Santis, Umberto Vietri and Ivano Coccorullo. Thank you for helping me and supported ... I will miss you! A virtual hug to Luigi Dello Ioio, Gemma De Nicola and the “erasmus boys” Armando Rafael Macedo da Mota, Maria Alexandra Ronda Escudero, Marcelo Passos Da Costa and Rui Nuno Ferreira Pinto, who in recent years have worked with me, making work less tiring and more enjoyable.
Thanks to all the boys and girls who in these years have gone in our lab to make it more cheerful and interesting.
I conclude by thanking my family and Vincenzo for their support in all these years.
Publication list
“Shear-Induced Nucleation and Growth in Isotactic Polypropylene”, R. Pantani, I. Coccorullo, V. Volpe, G. Titomanlio, Macromolecules 2010, 43, 9030–9038
“Mutual effect of flow and crystallization: investigations in flow-induced crystallization and crystallization flow-induced solidification”, R. Pantani, I. Coccorullo, V.Speranza, V. Volpe, S. Di Domenico, G.Titomanlio, Polymer Processing Society 26th Annual Meeting, July 4-8, 2010 Banff (Canada)
“Injection molding of microcellular polymers”, V. Volpe*, A. Sorrentino, R. Pantani, G. Titomanlio, XVI Scuola Nazionale di Scienza dei Materiali – INSTM, 27 settembre-2 ottobre 2010 Bressanone (BZ) “Injection molding of microcellular polymers”, V. Volpe*, A.
Sorrentino, R. Pantani, G. Titomanlio, proceedings EPF 5th Summer School - “Fundamental and developments in polymer processing science and technology”, 15-20 Maggio 2011, Gargnano (BS)
“Injection molding of microcellular PLA”, V. Volpe*, A. Sorrentino, R. Pantani, G. Titomanlio, proceedings Third International Conference on Biofoams, Capri (Na) 21-23 settembre 2011
“Foam injection molding of poly(lactic acid) with physical blowing agents”, R. Pantani, A. Sorrentino, V. Volpe, G.Titomanlio, Polymer Processing Society 29th Annual Meeting, Nuremberg (Germany) 15-19 Luglio 2013.
i
Index
ACKNOWLEDGMENTS PUBBLICATION LIST INDEX... I FIGURES INDEX ... V TABLES INDEX ... XI ABSTRACT ... XIII CHAPTER 1STATE OF THE ART ... 1
1.1 INJECTION MOLDING ... 1 1.2 CELLULAR MATERIALS ... 2 1.2.1FOAMING PROCESS ... 4 Homogeneous nucleation ... 5 Heterogeneous nucleation ... 7 Cell growth... 9
Stabilization of the structure ... 9
1.3 BLOWING AGENTS ...10
1.3.1PHYSICAL BLOWING AGENTS ...10
1.3.2CHEMICAL BLOWING AGENTS ...12
1.4 BATCH FOAMING PROCESS ...15
1.5 FOAM INJECTION MOLDING ...17
1.6 BIODEGRADABLE POLYMERS...22
1.6.1BIODEGRADABLE POLYMER:POLY(LACTIC)ACID ...23
1.7 FOAM INJECTION MOLDING OF BIODEGRADABLE POLYMERS...26
1.8 EFFECT OF GAS ON THE RHEOLOGY OF A POLYMER ...27
1.9 MONITORING OF CAVITY PRESSURE AND TEMPERATURE PROFILES ...29
CHAPTER 2 MATERIALS AND METHODS ...31
2.1 CONVENTIONAL POLYMERS FOR INJECTION MOLDING ...31
2.1.1POLYPROPYLENE HIFAXBA238G3 ...31
ii
2.2.1POLY(LACTIC)ACID PLA2002D ... 34
2.2.2POLY(LACTIC)ACID PLA4032D ... 34
2.3 BLOWING AGENT: NITROGEN ... 35
2.4 BATCH FOAMING EQUIPMENT ... 35
2.5 FOAM INJECTION MOLDING EQUIPMENT ... 36
2.6 SLIT RHEOMETER ... 38
2.7 DENSITY MEASUREMENTS: ARCHIMEDES’ PRINCIPLE ... 42
2.8 CROSS-VOGEL MODEL ... 44
2.9 TEST METHOD FOR TENSILE PROPERTIES ... 46
2.10 TEST METHOD FOR IMPACT RESISTANCE ... 50
Unnotched specimens ... 50
2.11 TEST METHOD FOR FLEXURAL PROPERTIES ... 50
2.12 SKYSCAN 1174 FOR TOMOGRAPHY ... 53
CHAPTER 3 BATCH FOAMING PROCESS ... 55
3.1 SAMPLE IDENTIFICATION ... 58
3.2 EXPERIMENTAL CONDITIONS ... 59
3.3 EXPERIMENTAL RESULTS ... 60
3.3.1FOAMING TEMPERATURE EFFECT ... 60
3.3.2COOLING BY WATER ... 63
3.3.3SOLUBILIZATION TIME EFFECT ... 66
3.3.4COMPARISON BETWEEN COOLING RATE AND SOLUBILIZATION TIME ... 67
3.3.5COMPARISON BETWEEN PS WITH PLA ... 68
CHAPTER 4 POLYPROPYLENE ... 71
HIFAX BA 238 G3 ... 71
4.1 EXPERIMENTAL CONDITIONS ... 72
4.2 ANALYSIS WITH CROSS MODEL ... 73
4.3 RHEOLOGICAL MEASUREMENTS ... 73
4.4 MORPHOLOGICAL ANALYSIS ... 75 CHAPTER 5
iii
5.1 THICKER CAVITY ...77
5.1.1ANALYSIS WITH CROSS MODEL ...78
Injection temperature 220°C ...79
Injection temperature 240°C ...83
5.2 THINNER CAVITY ...85
5.2.1ANALYSIS WITH CROSS MODEL ...86
5.2.2SOLUBILITY ...87
5.2.3RHEOLOGICAL MEASUREMENTS ...88
5.2.4DENSITY MEASUREMENTS:ARCHIMEDES’ PRINCIPLE ...90
5.2.5MECHANICAL PROPERTIES ...91
Flexural test ...91
Impact Resistance ...93
5.2.6MORPHOLOGICAL ANALYSIS ...93
Cell size and distribution ...94
Skin distribution ... 102 Tomography ... 104 CHAPTER 6 POLY(LACTIC) ACID 2002D ... 107 6.1 EXPERIMENTAL CONDITIONS ... 107 6.2 RHEOLOGICAL MEASUREMENTS ... 108 6.3 SOLUBILITY ... 110 6.4 DENSITY MEASUREMENTS ... 111 CHAPTER 7 POLY(LACTIC) ACID 4032D ... 115 7.1 RHEOLOGICAL PART ... 115 7.1.1EXPERIMENTAL CONDITIONS ... 115 7.1.2SOLUBILITY ... 117
7.1.3ANALYSIS WITH CROSS MODEL ... 117
7.1.4RHEOLOGICAL MEASUREMENTS ... 118 7.1.5DENSITY MEASUREMENTS ... 120 7.2 MECHANICAL PROPERTIES ... 122 7.2.1FLEXURAL TEST ... 123 7.2.2IMPACT RESISTANCE ... 125 7.2.3TENSILE PROPERTIES ... 125 7.3 MORPHOLOGY ... 127 7.4 CRISTALLINITY ... 130
iv
7.6 RESULTS: MONITORING OF CAVITY PRESSURE AND TEMPERATURE PROFILES
... 133
7.6.1EFFECT OF BACK PRESSURE ... 134
Back pressure 2 bar ... 135
Back pressure 3 bar ... 138
Back pressure 4 bar ... 139
Back pressure 5 bar ... 142
Mechanical properties ... 146 Flexural test ... 146 Impact resistance ... 147 Tensile properties... 147 7.6.2MORPHOLOGICAL ANALYSIS ... 148 CHAPTER 8 RELATIONSHIPS BETWEEN FOAM STRUCTURE AND PROPERTIES ... 151
8.1 POLYSTYRENE ... 152
8.2 POLY(LACTIC) ACID... 155
CHAPTER 9 CONCLUSIONS ... 161
v
Figures index
Figure 1. Polymeric foams: open-cells (a) and closed-cells (b). ... 3
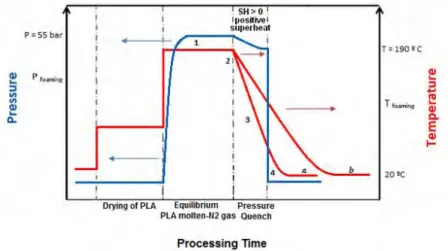
Figure 2. Evolution of temperature and pressure during a discontinuous process of foaming. ... 4
Figure 3. Homogeneous bubble nucleation. ... 5
Figure 4. Typical nucleation process. T0 = temperature, P0 = initial pressure and PS = final pressure. ... 5
Figure 5. Heterogeneous bubble nucleation. ΔG*hetero< ΔG*homo... 8
Figure 6. Schematic of nucleating particle interaction with gas and polymer. ... 8
Figure 7. Structure of Poly-lactic acid. ...23
Figure 8. Stereochemistry [62] ...24
Figure 9. Mechanism to obtain Poly(lactic acid). ...25
Figure 10. Hydrolysis of PLA. ...26
Figure 11. Typical pressure evolution inside the mold´s cavity [78]. ...29
Figure 12. Injection of polymer/gas solution (a); Cooling of skin on contact with the cold wall (b); Foaming of core inside the compact skin (c). ...30
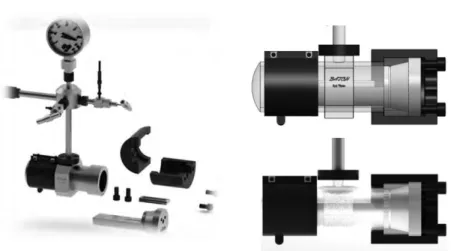
Figure 13. Hermetic system of batch process and your its constituents. ...36
Figure 14. Scheme of a typical screw for foam injection molding. ...37
Figure 15. Cavity geometry utilized in this work. ...38
Figure 16. Slit for rheological measurements...38
Figure 17. Transducer position on the slit rheometer. ...39
Figure 18. Geometry of the slit. ...40
Figure 19. Mechanism for density measurements. ...43
Figure 20. Cross model terms [90]. ...45
Figure 21. Viscosity behavior of PC [90]. ...46
Figure 22. Mechanism utilized in tests of traction. ...47
Figure 23. Stress-strain curve for a typical thermoplastic. ...48
Figure 24. Ductile behavior and fragile/brittle behavior. ...49
Figure 25. Test machine of tensile testing. ...49
Figure 26. Impact testing machine. ...50
Figure 27. Curves of Flexural Stress Versus Flexural Strain. ...52
Figure 28. Flexural Testing Machine and schematic representation of the test. ...52
Figure 29. Scheme of flexural test. ...53
Figure 30. SkyScan1174 compact micro-CT. ...53
Figure 31. Micro-position stage. ...54
Figure 32. Steps of the process about pressure and temperature; a-process by water, b-process by air. ...55
Figure 33. Scheme of the foaming procedure. ...56
Figure 34. DSC of the PLA 4032D. ...57
Figure 35. Solubility of nitrogen into PLA at temperatures of 180 and 200°C. ...58
Figure 36. Samples of PLA with foaming temperature between 150-120ºC (scale 1000 μm) ...61
vi
1000 μm) ... 62
Figure 38. Effect of foaming temperature for tsol=5h and cooling by air. ... 63
Figure 39. Samples of PLA with foaming temperature between 110-50ºC (scale
1000 μm)and fast cooling rate. ... 64
Figure 40. Effect of foaming temperature for tsol=1h and cooling by water. ... 65
Figure 41. Comparison between samples of PLA cooled by air (a) and by water (b) at
foaming temperature of 110°C. ... 65
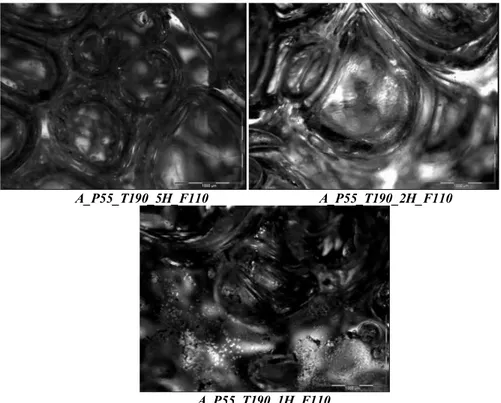
Figure 42. Samples of PLA with solubilization times equal to 5, 2 and 1h and
foaming temperature of 190ºC (scale 1000 μm). ... 66
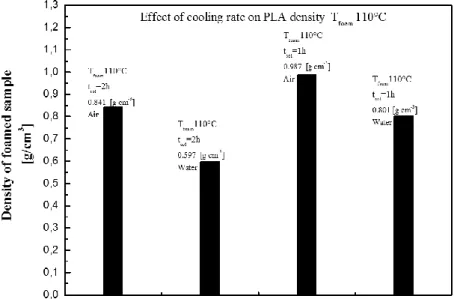
Figure 43. Effect of solubilization time at Tfoaming=110°C and cooling by air. ... 67
Figure 44. Samples of PLA with different cooling type (air and water) and different
solubilization time (2h and 1h) at Tfoaming=110°C (scale 1000 μm). ... 68
Figure 45. Effect of cooling rate and solubilization time for Tfoaming=110°C. ... 68
Figure 46. Samples of PS with different foaming temperature (110 and 90ºC) and
tsol=1h (scale 1000 μm). ... 69
Figure 47. Comparison between PLA vs. PS. ... 70 Figure 48. Effect of back pressure on the sample average density. ... 72 Figure 49. Comparison of the experimental data of BA238G without gas with the
Cross-Vogel Model which describes independent viscosity data for the same material at the same temperature (T=220°C) ... 73
Figure 50. Pressure profiles during the injection phase. ... 74 Figure 51. Pressure drops vs screw velocity for BA238G with gas and without gas
(T=220°C). ... 74
Figure 52. Viscosity vs shear rate for BA238G with gas and without gas (T=220°C).
... 75
Figure 53. Average density of parts taken at different distances from the injection
point. ... 75
Figure 54. Skin thickness analysis and cells distribution for the sample of BA238G
obtained at 240°C with shot volume of 36 ccm and 1.5 g of nitrogen injected. ... 76
Figure 55. Samples geometry utilized in the first set of experiments with PS 678E. 77 Figure 56. Comparison of the experimental data of unfoamed PS 678E with
Cross-Vogel Model at different process temperatures. ... 78
Figure 57. Amount of nitrogen injected in PS 678E at T= 220°C. ... 79 Figure 58. Pressure drops of measured in the thinner slit (thickness=0.75 mm;
width=10 mm) for PS 678E with different amounts of nitrogen (T=220°C)... 80
Figure 59. Pressure drops measured in the thicker slit (thickness=2 mm; width=20
mm) for PS 678E with different amounts of nitrogen (T=220°C). ... 80
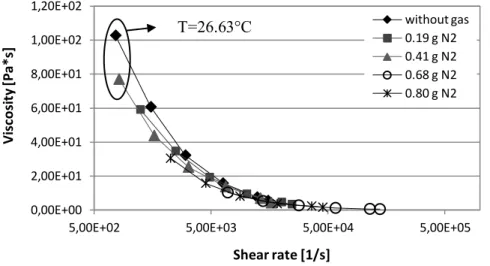
Figure 60. Evolution of viscosity with shear rate for PS 678E with different amounts
of nitrogen (T=220°C). ... 82
Figure 61. Pressure drops of PS 678E with different amounts of gas (T=240°C). ... 84 Figure 62. Viscosity vs shear rate for PS 678E with different amounts of nitrogen
(T=240°C). ... 84
Figure 63. Reduction in density for samples of PS 678E with different amounts of
vii (T=220°C). ...85
Figure 65. Amount of nitrogen injected corresponding to different gas pressures, for
PS 678E at injection temperature of 220°C in a thinner cavity (thickness=5mm). ....86
Figure 66. Comparison of rheological data of unfoamed samples of PS 678E with
Cross-Vogel Model (second slit; T=220°C). ...87
Figure 67. Solubility of nitrogen inside of PS 678E (T=220°C)...88 Figure 68. Pressure drops at different injection flow rates for PS 678E with different
amounts of nitrogen (second slit; T= 220°C). ...88
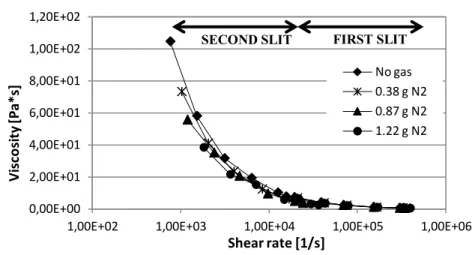
Figure 69. Viscosity vs shear rate for PS 678E with different amounts of nitrogen
(second slit; T= 220°C). ...89
Figure 70. Reduction in density for PS 678E with different amounts of nitrogen (T=
220°C). ...90
Figure 71. Flexural stress versus flexural strain of foamed and unfoamed samples of
PS 678E injected at 74 ccm/s (T=220°C). ...91
Figure 72. Flexural modulus at different injection flow rates for PS 678E with
different amounts of nitrogen (T= 220°C). ...92
Figure 73. Modules of elasticity multiplied for the ratio between the density of pure
PS 678E and the density of the foamed samples (T=220°C). ...92
Figure 74. Impact resistance multiplied for the ratio between the density of pure PS
678Eand the density of the foamed samples (T=220°C). ...93
Figure 75. Position of the morphological observations (length=50 mm). ...94 Figure 76. Micrographs of PS 678E foamed at 220°C with different amount of gas.
...95
Figure 77. Percentage of void due to cells with radius included in defined ranges for
samples of PS 678E with 0.19 g of gas. ...96
Figure 78. Percentage of void due to cells with radius included in defined ranges for
samples of PS 678E with 0.41 g of gas. ...96
Figure 79. Percentage of void due to cells with radius included in defined ranges for
samples of PS 678E with 0.68 g of gas. ...97
Figure 80. Percentage of void due to cells with radius included in defined ranges for
samples of PS 678E with 0.80 g of gas. ...97
Figure 81. Cooling rate change over the cross section of an injection molded foam.
...98
Figure 82. Radii distribution along the thickness of the sample of PS 678E with 0.19
g of nitrogen. ...99
Figure 83. Radii distribution along the thickness of the sample of PS 678E with 0.41
g of nitrogen. ...99
Figure 84. Radii distribution along the thickness of the sample of PS 678E with 0.68
g of nitrogen. ... 100
Figure 85. Radii distribution along the thickness of the sample of PS 678E with 0.80
g of nitrogen. ... 101
Figure 86. Radii distribution along the sample thickness for PS 678E with different
amounts of nitrogen (T=220°C). ... 101
Figure 87. Skin thickness of the sample of PS 678E with 0.19 g of gas. ... 102 Figure 88. Skin thickness of the sample of PS 678E with 0.41 g of gas. ... 103
viii
Figure 90. Skin thickness of the sample of PS 678E with 0.80 g of gas. ... 104 Figure 91. Thin slices of the sample with 0.68 g of N2 taken every 3 mm from a length of 38 mm to a length of 50 mm (direction of flow perpendicular to the section). ... 105
Figure 92. Thin slices of the sample with 0.80 g of N2 taken every 3 mm from a length of 38 mm to a length of 50 mm (direction of flow perpendicular to the section). ... 106
Figure 93. Amount of nitrogen injected in PLA 2002D at different gas pressures
(T=220°C). ... 108
Figure 94. Geometry of the mold cavity utilized in experiments with PLA 2002D
(T=220°C). ... 108
Figure 95. Pressure drops at different values of injection flow rate for PLA 2002D
with different amounts of nitrogen (second slit; T=220°C). ... 109
Figure 96. PLA 2002D: evolution of viscosity at different values of shear rate (second
slit;T=220°C) ... 110
Figure 97. Solubility of nitrogen inside of PLA 2002D. ... 111 Figure 98. Sample lengths at different values of injection flow rate for PLA 2002D
with different amounts of nitrogen (T=220°C). ... 112
Figure 99. Reduction in density with respect to the unfoamed samples at different
values of injection flow rate for PLA 2002D with different amounts of nitrogen. .. 113
Figure 100. Geometry of the mold cavity utilized for experiments with PLA 4032D
(T=200°C). ... 116
Figure 101. Amount of nitrogen injected in PLA 4032D (T=200°C). ... 116 Figure 102. Solubility of nitrogen inside of PLA 4032D (T=200°C). ... 117 Figure 103. Comparison of the experimental data of PLA 4032D without gas with
the Model (second slit; T=200°C). ... 118
Figure 104. Comparison of the experimental data of PLA 4032D without gas with
the rheological data of the PLA 4032D molded (second slit; T=200°C). ... 118
Figure 105. Pressure drops at different values of injection flow rate for PLA 4032D
with different amounts of nitrogen (second slit; T=200°C). ... 119
Figure 106. Evolution of viscosity at different values of shear rate for PLA 4032D
with different amounts of nitrogen (second slit; T=200°C). ... 120
Figure 107. Length of the samples of PLA 4032D molded with different amounts of
gas (T=200°C). ... 121
Figure 108. Reduction in density with respect to the unfoamed samples of PLA
4032D at different values of injection flow rate and different amount of gas. ... 121
Figure 109. Position of the specimen on which the mechanical tests were carried
out. ... 122
Figure 110. Stress vs strain curve of an unfoamed sample of PLA 4032D and of a
sample of PLA 4032D foamed with 0.81 grams of nitrogen in PLA with an injection flow rate of 13 ccm/s. ... 123
Figure 111. Moduli of elasticity at different injection flow rates for PLA 4032D with
different amounts of nitrogen injected (T=200°C). ... 124
Figure 112. Reduction in Modulus compared to the unfoamed samples of PLA
ix (T=200°C). ... 125
Figure 114. True modulus of PLA 4032D with different amounts of nitrogen at
different injection flow rates (T=200°C). ... 126
Figure 115. Reduction in true modulus of PLA 4032D with different amounts of
nitrogen at different injection flow rates (T=200°C). ... 126
Figure 116. Elongation at break of PLA 4032D with different amounts of nitrogen at
different injection flow rates (T=200°C). ... 127
Figure 117. Foamed samples of PLA 4032D molded at 200°C with 0.49 g of Nitrogen
at different injection flow rates. ... 128
Figure 118. Foamed samples of PLA 4032D molded at 200°C with 0.81 g of Nitrogen
at different injection flow rates. ... 129
Figure 119. Percentage of void due to cells with radius included in defined ranges
for samples of PLA 4032D with 0.49 g of nitrogen into the PLA. ... 130
Figure 120. Percentage of void due to cells with radius included in defined ranges
for samples of PLA 4032D with 0.81g of nitrogen into the PLA. ... 130
Figure 121. Differential Scanning Calorimetry: melting at 10°C/min of skin and core
of unfoamed samples of PLA 4032D (200°C). ... 131
Figure 122. Differential Scanning Calorimetry: melting at 10°C/min of skin and core
of foamed samples with 0.81 g N2 injected in PLA 4032D (200°C). ... 131
Figure 123. Amount of N2/PLA 4032D solution injected at different back pressures
(in hydraulic system) and variation of the respective ratio between the grams of gas and the grams of PLA. ... 132
Figure 124. Cavity geometry utilized for monitoring cavity pressure and
temperature profiles with PLA 4032D. ... 133
Figure 125. Amount of gas absorbed corresponding to each back pressure applied
during the dosage phase, with 1.2 g of nitrogen injected into molten PLA (T=200°C). ... 134
Figure 126. Micrographs of the foamed samples of PLA 4032D molded with back
pressure 2 bar (T=200°C). ... 135
Figure 127. Pressure profiles and screw position of a foamed sample of PLA 4032D
molded at back pressure 2 bar (T=200°C). ... 136
Figure 128. Temperature profiles and screw position of a foamed sample of PLA
4032D molded at back pressure 2 bar (T=200°C). ... 136
Figure 129. Micrographs of the foamed samples of PLA 4032D molded with back
pressure 3 bar (T=200°C). ... 138
Figure 130. Temperature profiles and screw position of a foamed sample of PLA
4032D molded at back pressure 3 bar (T=200°C). ... 139
Figure 131. Micrographs of the foamed samples of PLA 4032D molded with back
pressure 4 bar (T=200°C). ... 140
Figure 132. Pressure profiles of a foamed sample of PLA 4032D molded at back
pressure 4 bar (T=200°C). ... 141
Figure 133. Temperature profiles and screw position of a foamed sample of PLA
4032D molded at back pressure 4 bar (T=200°C). ... 141
Figure 134. Micrographs of the foamed samples of PLA 4032D molded with back
x
(T=200°C). ... 143
Figure 136. Compressibility of the solution at different values of back pressures for
PLA 4032D (T=200°C). ... 144
Figure 137. Length of the samples of PLA 4032D at different back pressures in the
hydraulic system (T=200°C)... 145
Figure 138. Reduction in density of samples of PLA 4032D at different back pressure
(T=200°C). ... 145
Figure 139. Specimen utilized for mechanical tests with second set of samples of
PLA 4032D... 146
Figure 140. Comparison between modules of elasticity obtained at 2 and 5 mm/min
for PLA 4032D (T=200°C). ... 146
Figure 141. Impact resistance of samples of PLA 4032D foamed at different values
of back pressure in the hydraulic system (T=200°C). ... 147
Figure 142. Modulus of elasticity obtained from traction tests on samples of PLA
4032D at different back pressures in the hydraulic system (T=200°C)... 148
Figure 143. Image of a sample molded with back pressure 3 bar and the same
image modified with the software. ... 148
Figure 144. Percentage of void due to cells with radius included in defined ranges
for samples of foamed PLA 4032D molded with back pressure of 3 bar (T=200°C). ... 149
Figure 145. Percentage of void due to cells with radius included in defined ranges
for samples of foamed PLA 4032D molded with back pressure of 5 bar (T=200°C). ... 149
Figure 146. Strut-Face cubic model. ... 152 Figure 147. Relative Young’s modulus versus relative foam density for PS 678E
(T=220°C). ... 153
Figure 148. Relative Young 's modulus versus strut volume fraction φ for PS 678E
(T=220°C). ... 154
Figure 149. Variation of the void percentage with the average Young's modulus for
PS 678E (T=220°C). ... 154
Figure 150. Voids percentage inside of the foamed samples of PS 678E versus the
foam density (T=220°C). ... 155
Figure 151. Sample geometry of the first set of tests on PLA 4032D. ... 156 Figure 152. Strut volume fraction at different injection flow rates for all the solution
of PLA 4032D (T=200°C). ... 156
Figure 153. Deformation parallel (a) and perpendicular (b) to flow direction. ... 157 Figure 154. Strut volume fraction for PLA 4032D with different amounts of gas in
the two direction of positioning. ... 157
Figure 155. Relative Young’s modulus versus relative foam density for PLA 4032D
(T=200°C). ... 158
Figure 156. Sample geometry of the second set of tests on PLA 4032D. ... 158 Figure 157. Variation of the relative Young’s modulus with the relative foam density
for PLA 4032D (T=200°C). ... 159
xi
Tables index
Table 1. Advantages and disadvantages of polymeric foams. ... 4
Table 2. Properties of inert gases used as blowing agents ...11
Table 3. Chemical blowing agents [9]. ...14
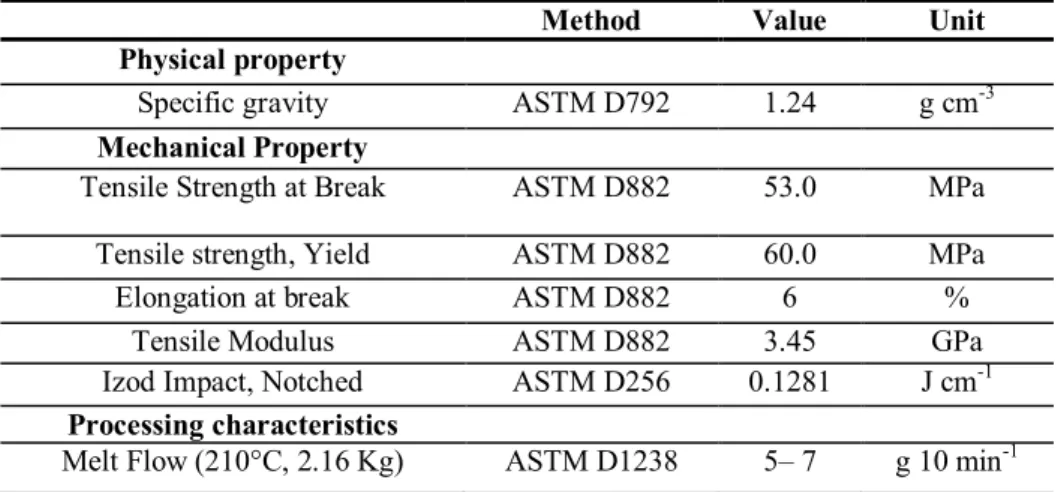
Table 4. Physical and mechanical properties for HIFAX BA 238 G3 [78, 81-83]. ...31
Table 5. Thermal properties and processing characteristics for HIFAX BA 238 G3 ...32
Table 6. Specific heat of PS 678E [84]. ...32
Table 7. Properties for PS 678E [83-88] ...33
Table 8. Parameters of Cross-Vogel Model. ...33
Table 9. Properties for PLA 2002D [89]. ...34
Table 10. Properties for PLA 2002D [89-90]. ...35
Table 11. Slits geometry. ...38
Table 12. Operative conditions of SkyScan. ...54
Table 13. Summary of the I step of tests performed by Batch foaming process. ...59
Table 14. Summary of the next tests performed by Batch foaming process. ...60
Table 15. Experimental conditions ...72
Table 16. Experimental conditions. ...77
Table 17. Pressure values measured by pressure transducers in the thinner slit (thickness=0.75 mm; width=10 mm). ...81
Table 18. Pressure values measured by pressure transducers in the thicker slit (thickness=2 mm; width=20 mm). ...81
Table 19. Increment in temperature equivalent to the reduction in viscosity. ...83
Table 20. Reduction in density for samples of PS 678E with different amounts of nitrogen (T=220°C). ...83
Table 21. Pressure values measured by pressure transducers in the slit. ...84
Table 22. Experimental conditions. ...86
Table 23. Pressure values measured by pressure transducers in the slit (PS 678E at 220°C). ...89
Table 24. Reduction in temperature equivalent to the reduction in viscosity (PS 678E at 220°C). ...90
Table 25. Experimental conditions. ... 107
Table 26. Pressure values measured by means of pressure transducers for PLA 2002D foamed by Nitrogen. ... 109
Table 27. Values of reduction in density at different values of injection flow rate for different amount of gas. ... 113
Table 28. Experimental conditions. ... 116
Table 29. Pressure values measured by means of pressure transducers for PLA 4032D foamed by Nitrogen (T=200°C). ... 119
Table 30. Values of reduction in density at different values of injection flow rate for different amount of gas. ... 122
Table 31. Experimental conditions. ... 134
Table 32. Features of the sample of PLA 4032D molded at back pressure of 2 bar in the hydraulic system (T=200°C). ... 135
xii
the hydraulic system (T=200°C). ... 138
Table 34. Features of the sample of PLA 4032D molded at back pressure of 4 bar in
the hydraulic system (T=200°C). ... 139
Table 35. Features of the sample of PLA 4032D molded at back pressure of 5 bar in
the hydraulic system (T=200°C). ... 142
Table 36. Geometrical and physical features of the foamed samples of PLA 4032D at
different back pressures in the hydraulic system. ... 144
Table 37. Strut volume fraction φ at different injection flow rates for PS 678E with
xiii
Abstract
Foam injection molding uses environmental friendly blowing agents under high pressure and temperature to produce parts having a cellular core and a compact solid skin (the so-called “structural foam”). The addition of a supercritical gas reduces the part weight and at the same time improves some physical properties of the material through the promotion of a faster crystallization; it also leads to the reduction of both the viscosity and the glass transition temperature of the polymer melt, which therefore can be injection molded adopting lower temperatures and pressures.
In this work, the effect of the addition of a blowing agent within a polymeric matrix and the influence of the process conditions on the rheology of the melt, on the physical and mechanical properties and on the morphology of the final product was analyzed.
Several polymeric materials were adopted in this work: two thermoplastic polymers commonly used for conventional injection molding and previously well characterized, namely a semi-crystalline polypropylene and an amorphous polystyrene, and two grades of a biodegradable polymer, polylactic acid (PLA). With particular reference to biodegradable polymers, the utilization of the foam injection molding process with physical blowing agents seems the ideal solution to problems of moldability caused by the high viscosity and operative condition very close to those of degradation for this class of materials.
Before the foam injection molding, the PLA was foamed by means of a batch foaming system. In particular, the effect of foaming temperature, solubilization time and cooling rate on the morphology of the samples and on their density was analyzed.
Several foam injection molding experiments were carried out by using cavities with two different thicknesses and under different experimental conditions. Rheological measurements of the polymer/gas solutions were also obtained by means of a modified nozzle with a slit rheometer with pressure transducers which allow to obtain on-line viscosity measurements. Rheological measurements conducted on the polymer-gas mixtures, showed a significant reduction in viscosity. Furthermore, reduction in density of the foamed samples compared to the unfoamed ones varies with increasing amount of gas injected and increases with increasing injection flow rate, reaching values higher than 40% for polystyrene and of almost 50% in the case of PLA. The analysis of the mechanical properties for both materials showed that the values of Young's modulus were lower than that of the molded part without gas. However, the reduction in Young’s modulus of the foamed parts compared to the Young’s modulus of the unfoamed ones is almost entirely compensated by the reduction in density. On increasing the amount of gas, the morphology of the samples becomes more homogeneous,
xiv
there seems to be an optimal physical blowing agent content that leads to the best microcellular structure and the maximum density reduction and mechanical properties.
Finally, a study of the effect of gas on the crystallinity of the PLA was carried out by Differential Scanning Calorimetry (DSC) and Wide Angle X-ray Scattering. Results shown a higher cristallinity of the foamed core with respect to the compact skin and the unfoamed part. This is an aspect of considerable importance for biodegradable polymers, for which the crystallinity has a marked effect on properties.
Chapter 1
State of the art
1.1 Injection molding
Injection moulding is one of the most versatile and important manufacturing processes, capable of mass-producing complicated plastic parts in net shape with excellent dimensional tolerance.
Injection molding was patented in 1872 by the brothers Hyatt (USA) and in spite of passing of the century XX this process suffered an enormous evolution, and nowadays it is possible to observe technology and sophisticated equipment associated to injection molding.
Injection molding is a cyclic process. The number of operations that take place in an injection molding machine between two consecutive moldings is called “molding cycle”. The optimization of this cycle is fundamental to ensure an economical and competitive process.
The raw material (resin), placed in the form of pellets inside the hopper, is fed into the barrel by the screw rotation. The solid resin is heat-melted by means of band heaters and by the frictional heat generated on the inside of the barrel. The injection molding cycle starts when the mould closes. This step should be as quick as possible to reduce cycle time. Following is the sequence of the steps which take place during injection molding
Injection: after the nozzle of the cylinder takes contact with the mold, the
piston (or the screw) is pushed forward obliging the molten polymer to flow into the mold. The injection speed (or ideally the profile of speeds) results from a compromise between speed (to secure the global filling of impression) and the quality of the final product (very high speeds can produce marks on the surface and levels of orientation exaggerated). Flows injections of 100 to 500 g/s are a common practice.
Pressurization/holding: after the filling of the mold, it is necessary to
continue to pressurize the melt inside the impression, in order to reduce the shrinkage due to cooling and to prevent the melt reflux. However, the pressurization must not be excessive, in order to avoid damages which can result a difficult ejection. This phase ends as soon as the channel of entry in the mold (named “gate”), or the part itself, are solidified.
2
Cooling Time: as soon as the consolidation of the gate has occurred, the
piston returns to back position (in case of screw machines this starts to swirl initiating the plasticating of more material, being force to retracted due of generated pressure), and the molding continues to cool inside of a mold. The cooling phase ends as soon as the part reaches a temperature that allows the extraction without distortion. This part of the cycle is merely an operation of heat loss by the material, depending on the thickness of molding and the project of the mold (namely of its cooling system). The slower the cooling will be, the lower will result the intensity of the internal tensions due to cooling.
Opening/ Ejection: the time for this operation depends on the
characteristics of the closing unit and on the movements of the mould for opening. It is a critical operation from the productive point of view, and takes place simultaneously, by means of appropriate mechanisms, with the separation of sprue and feed channels.
Pause Time: it is the period of time that passes from the moment at
which the part it is ready to be moved of the mold and the beginning of a new cycle. It can be reducer to nearly zero for automatic systems.
1.2 Cellular materials
Cellular materials, otherwise known as foams, are biphasic materials, usually made of a solid matrix in which a fluid phase is dispersed. In general, the fluid phase is dispersed in the matrix in the form of three dimensional polyhedra, known as cells.
The first cellular synthetic plastic was an unwanted cellular phenol– formaldehyde resin produced by early workers in this field. The elimination of cell formation in these resins, as given by Baekeland in his 1909 patent, is generally considered the birth of the plastics industry. The first commercial cellular polymer was sponge rubber, introduced between 1910 and 1920. Cellular polymers have been commercially accepted in a wide variety of applications since the 1940s [1]. The development of various technologies for polymer synthesis and more recently, of newly designed polymer processing equipment, was the key factor that propelled the development of polymeric foams between the 1950s and the 1970s. Dedicated efforts from scientists and engineers around the world resulted in an increased understanding of foaming mechanisms and in enhanced techniques for efficient foam production. After the 1980s, increasing insight in environmental issues of both polymeric materials and blowing agent contributed further to the reinforcement of the foam industry(Lee S. T. 2007) [2].
The use of polymer foams in today’s world has constantly increased. Polymer foams are found virtually everywhere in our modern world and are used in a wide variety of applications. The selection of a polymer for
3 application in the form of foam requires the analysis of the desired properties, degree of difficulty or facility of material processing and production costs.
The foam of polymeric materials can be carried out either by mechanical, chemical or physical means. Some of the most commonly used methods are the following [3]:
Thermal decomposition of chemical blowing agents, generating either nitrogen or carbon dioxide or both, by application of heat or as a result of exothermic heat of reaction during polymerization.
Mechanical whipping of gases into a polymer system, which hardens either by catalytic action or heat or both, thus entrapping the gas bubbles in the matrix.
Volatilization of low boiling liquids within the polymer mass as a result of the exothermic heat of reaction or by application of heat.
Volatilization by exothermic heat of reaction of gases produced during polymerization, such as occurs in the reaction of isocyanate with water to form carbon dioxide.
Expansion of gas dissolved in a polymer mass upon reduction of pressure in the system.
Incorporation of sphere in a polymer mass. The hollow micro-sphere may consist of either glass or plastic beads.
Expansion of gas filled beads by application of heat, or expansion of these beads in a polymer mass by heat of reaction.
Physical expansion of gas in solution with a polymer matrix due to a pressure reduction.
Polymeric foams can be classified in open-cells and closed-cells. The gas phase in a cellular polymer is distributed in voids, pores, or pockets called cells. If these cells are interconnected in such a manner that gas can pass from one to another, the material is termed open-celled. If the cells are discrete and the gas phase of each is independent of that of the other cells, the material is termed closed-celled (Figure 1).
(a) (b)
4
Foams may be flexible or rigid depending on whether their glass transition temperature is below or above the room temperature, which in turn depends on their chemical composition, the degree of cristallinity, the degree of cross-linking. Intermediate from flexible and rigid foams are semi-rigid or semi-flexible.
The main applications for plastic foamed can be found in the building, automobile, packaging and sport industries. In Table 1 advantages and disadvantages of polymeric foams are reported.
Table 1. Advantages and disadvantages of polymeric foams.
Advantages Disadvantages
Low density Complexity of processing
Economy of the material Relatively high levels of combustibility Excellent thermal and
acoustic insulation Levels of toxic fumes produced by combustion of relatively high Design freedom Difficulties reprocessing
Comfort Environmental problems associated with
some expanding agents
1.2.1 Foaming process
Foams with thermoplastic matrix are generally produced by a process based on the phase separation that occurs within a polymer/gas solution. The phase separation is induced by compelling the system to a condition of thermodynamic instability. The basic foaming process consists in three main steps: bubble formation or nucleation, growth of the bubble and stabilization of the structure. In Figure 2 it is possible to see the evolution of temperature and pressure during the steps of a foaming process.
Figure 2. Evolution of temperature and pressure during a discontinuous process
5 The first step in the production of a foam is the formation of gas bubbles in the liquid phase. Thermodynamically there are two processes to generate bubbles, homogeneous and heterogeneous nucleation.
Homogeneous nucleation
In the classical theory of nucleation, the nucleation rate is governed by the rate at which invisible gas clusters are energized by effective diffusion as a result of supersaturation to exceed the critical radius. In particular, homogeneous nucleation occurs when a sufficient number of dissolved gas molecules form clusters for time a long enough to make a critical bubble radius to cross over the resistance path, as shown in Figure 3.
Figure 3. Homogeneous bubble nucleation.
Figure 4A shows a single phase containing molten polymer saturated with gas at a certain pressure. Figure 4B shows the formation of a second gas phase when the pressure is reduced from P0 to PS. Thermodynamic
instability is the reason for nucleation of tiny bubbles. Formation of bubbles involves creation of new surfaces with certain volumes. Usually the embryos are spherical in size and therefore easier mathematical expressions can be derived based on thermodynamic principles.
Figure 4. Typical nucleation process. T0 = temperature, P0 = initial pressure
6
In the metastable region, the total work includes surface area generation, size expansion, and evaporation.
(1)
σ = surface tension A = bubble surface area Pg = gas pressure Pl = liquid pressure Vb = bubble volume n = molecules number μg = chemical potential μl = chemical potential
At equilibrium, the chemical potentials, μg and μl, are equal, and equation
1 can be rewritten to express Gibbs free energy as:
(2)
where r is the bubble radius. The maximum value of
occurs at a critical size r*, or when there is a critical number of gas molecules in the embryo, and represents the free energy of formation of the critical nucleus.
The spherical shape of the nucleus is assumed to represent minimum resistance for nucleation for a given volume. In general, such an assumption is reasonable. But in polymeric systems non spherical geometries might be encountered. The activation free energy for homogeneous nucleation of a critical nucleus is derived as:
(3)
where ΔP is the supersaturated pressure.
The nucleation rate Nhom 0 in a gas-polymer system can be expressed as
follows:
(4)
where
is the minimum work to sustain a bubble, C0 is the
concentration of gas molecules per unit volume of the metastable state, and k and T are the Boltzmann constant and absolute temperature, respectively, and f0 the frequency factor for the rate at which gas molecules join a critical
7 It is possible to see that, when the degree of supersaturation is increased, the critical free energy decrease. Physically this means that a greater amount of gas in the polymer makes it easier for bubbles to form. Blander and Katz [4] obtained the following equation for the rate of nucleation:
(5) where m represents the mass of a gas molecule. In polymer processing, it is reasonable to assume Pl equal to P, representing the surrounding pressure
while the gas/melt resides in the barrel. Then, the difference between Pb and
P becomes superheat.
(6)
In the conventional nucleation theories, the rate of nucleation is governed by the rate of diffusion (or vaporization) of gas molecules from the surrounding liquid through the interphase. For general liquids, Kagan [5], included the hydrodynamic and heat transfer effects for vaporization. Also other authors developed a similar correction to account for diffusion and viscosity-controlled nucleation rate.
Heterogeneous nucleation
This is the most common type of nucleation found in polymer systems containing additives. The efficiency of producing bubbles depends on several factors, such as the type and shape of nucleating particles and interfacial tensions of solid and solid-gas interface. Blander and Katz proposed a simple heterogeneous nucleation model for liquids in 1975.
(7) The primary benefit comes from the interface, which acts like a catalyst for nucleation. The presence of tiny particles and cavities reduces the activation energy required to achieve a stable nucleus. Figure 5 shows the reduction of Gibbs free energy associated with the heterogeneous nucleation process.
8 G
Figure 5. Heterogeneous bubble nucleation. ΔG*hetero< ΔG*homo.
The thermodynamics of heterogeneous nucleation and its mathematical analysis are given in Uhlmann and Chalmers [6]. The heterogeneity factor can be used to correct the activation energy term derived for homogenous nucleation, as shown in the following:
(8)
Figure 6. Schematic of nucleating particle interaction with gas and polymer. For the configuration shown in Figure 6, Uhlmann and Chalmers derived an expression for as:
(9)
Then:
(10)
where θ is the wetting angle, is the heterogeneity factor, and σ represents the interfacial tensions of a polymer-gas bubble.
9
Cell growth
Bubble growth is the key step in polymer foam generation processes. The mechanical properties of foam polymers are closely related to the size of the bubbles created inside the material. However, cell growth is a phenomenon that is not fully understood. The classical theory suggests that the growth is controlled by diffusivity of the gas and by the stiffness of the substrate. The critical size of the bubble is dependent on the temperature because of the vapor tension. In particular, critical size of the bubble is inversely proportional to the difference between the vapor pressure and the liquid pressure. As the temperature increases the critical size of the bubble decreases because of the increase of the vapor pressure. For this reason, small bubbles are generated and start to grow at high temperatures of polymer melt. Another phenomenon occurs simultaneously with the opposite effect. The viscosity is also reduced with the increase of the temperature, increasing the diffusivity of the gas in the polymer. As a result of this effect, the possibility of a collapse of the bubbles increases (cell density decreases). By applying the Laplace's law, it can be concluded that the gas pressure required to maintain a small bubble is higher than that of a bigger bubble. Therefore, the gas tends to diffuse from the smaller bubble to the larger one, resulting in a collapse of the small bubble, confirming the tendency that if they have enough time, the small bubbles will disappear. In 2009, Moon et al. [7] developed a theoretical framework to improve bubble growth rate and size predictions during microcellular injection molding process. Most common methods of analysis use a constant viscosity and surface tension to predict the size of the bubbles. Under actual situations, however, when the polymer contains gases, changes occur in the viscosity and surface tension that cause discrepancies between the estimated and observed bubble sizes. Moon and co-workers demonstrated that a model using variable bubble properties predicted bubble sizes that were closer to actual observations compared to results obtained from standard analysis tools.
Stabilization of the structure
The terminal phase of growth is dominated by the surroundings as the presence of molds or dies, internal pressure and gas permeability in the expanded cells and the mechanical properties of the material. Stabilization of bubbles is accomplished by cooling the foamed molten plastic to provide the necessary increase in viscosity. In particular in injection molding, since. it is a process of rapid cooling and with limited volume, the fluid pressure exceeds the pressure of the surrounding gas by increase the viscosity of the material, getting the bubbles unable to continue their growth.
10
1.3 Blowing agents
Polymeric foam is generally characterized by blowing agent indwelling and expansion within the polymeric matrix. Unstable foaming like boiling occurs and must be sustained by the surrounding polymeric material to form a stable cellular product. In most cases, blowing agent is virtually indispensable in the polymeric foaming process. There are a great variety of organic and inorganic blowing agents suitable for the process. From the nature of gas formation, it can be classified as physical blowing agent (PBA) and chemical
blowing agent (CBA) [2]. CBA are generally solids at standard temperature
and pressure (STP) and undergo a chemical transformation producing gas, while PBA, generally a liquid or gas at STP, undergo either a reversible change of state or expansion(Singh). Both PBA and CBA have been well
established for specific foaming processes
.
1.3.1 Physical blowing agents
Physical blowing agents (PBA) provide gas for the expansion of polymer by undergoing a change in physical state. The change may involve volatilisation (boiling) of a liquid or release of a compressed gas to atmospheric pressure after it was been incorporated into a polymer, generally at elevated temperature et/or pressure.
Physical blowing agents (PBAs) can be incorporated within the polymer matrix using various methods:
(i) physical blending and physical dissolution (ii) physical blending and chemical decomposition (iii) physical dissolution
(iv) chemical reaction and encapsulation.
Among these, physical blending and dissolution is considered the most commonly implemented method in the industry of polymeric foams.
Under high pressure, and sometimes elevated temperature, a physical blowing agent can be compressed as a critical or super critical fluid, depending on the processing temperature and the critical temperature of the fluid. It then contacts and dissolves into the polymeric melt to form a saturated polymer/gas system, which can foam when subjected to a lower pressure (or higher temperature) environment. When the solution is forced through an orifice to outside atmosphere, a sudden pressure reduction occurs, which automatically builds up a high supersaturation to convert the dispersed gas molecules into gas bubbles. Fast expansion and slow cooling are characteristic of the foam extrusion and foam injection molding. Namely, as soon as the polymer is cooled and sufficiently solidified to build up strength to hold the bubbles, a foam product is made. Due to the saturation of blowing agent in the fresh foam, a counter-diffusion with the surrounding air naturally occurs. As a result, blowing agent concentration in the cell
11 continues to decrease as opposed to the increase of air concentration. After a sufficiently long aging time, the foam will consist solely of air voids dispersed throughout the polymer matrix.
The most important physical blowing agents are: volatile organic chemicals (VOC)
including hydrocarbons (HC) chlorofluorocarbons (CFC)
hydrochlorofluorocarbons (HCFC) hydrofluorocarbons (HFC)
Inert gases, such as carbon dioxide, nitrogen, and oxygen
High solubility of CFC in many thermoplastics has led to their use to make foams for many different thermoplastics. CFC were usually added as auxiliary blowing agents to enhance polyurethane foam expansion. Since it was discovered that CFCs cause ozone depletion issues, it has been a great challenge to find a proper replacement.
Currently inert gas are the most widely used blowing agent. This is partly because nitrogen is cheap, abundant and by far the most environmentally acceptable as it is simply borrowed from the atmosphere. The same is true for carbon dioxide even though it is greenhouse gas.
Table 2. Properties of inert gases used as blowing agents
Carbon Dioxide Nitrogen Oxygen
Chemical formula CO2 N2 O2
Molecular weight 44 28 32
Boiling point [°C] -78.3 -195.8 -183.0
Critical temperature [°C] 31 -146.9 -118.3
Critical pressure [MPa] 7.38 3.4 5.0
Heat of vapourisation at BP [kJ/mol] 6.8 - -
Gas conducibility [mW/mK] at 25 °C 16.4 25.8 26.6
Vapour pressure [kPa] at 25 °C 6434 very high very high
Flammable limit in air [vol%] none none none
Many factor must be considered prior to selecting the PBA:
1. Environmental acceptability
The stratospheric ozone depletion potential (ODP) of a blowing agent is an index defined as stratospheric ozone depleted per unit mass of a given product
Global warming (GWPotential) Ground level air pollution Tropospheric degradation Long-term breakdown products Alogen content
12
2. Toxicity 3. Flammability
4. Compatibility with materials of construction 5. Boiling point
6. Molecular weight (lower costs per mole of PBA) 7. Vapour pressure in the temperature range used
8. High heat of vapourisation while still getting a high bowling
efficiency is desired
9. Good solubility in raw material and poor solubility in finished foam 10. Compatibility with materials of construction
For thermoplastics, good solubility of the physical blowing agent means relatively lower minimum melt pressure to get and keep the BA in solution. This allows the melt temperature to be reduced which make it easier to cool the melt to the optimum temperature. If the BA has poor solubility, a high melt pressure and temperature is requested to force the BA into solution. This can degrade the polymer and make it more difficult to cool the melt to the optimum temperature, leading to poor cell structure, loss in blowing efficiency, surface imperfection, non-optimal closed cell content.
1.3.2 Chemical blowing agents
Some chemicals are capable of liberating gaseous components via reactions and/or thermally induced decomposition. When these occurrences take place within the polymeric melt, the decomposing chemical automatically acts as a blowing agent. Some chemicals fit certain polymer processing nicely. These kinds of chemicals are referred to as chemical blowing agents (CBAs). CBA refers more to process than product. In comparison to the requirements set for the suitability of PBAs for foaming applications, the requirements for the processing suitability of CBAs appear to be more stringent. This is so because chemical reactions and/or heat are involved, so that the dispersion of the blowing agent throughout the melt and the heat sensitivity of the polymer impose serious concerns that aggravate the processing of polymeric foams using CBAs. In other words, heat sensitive polymer and the required shear to attain dispersion are legitimate material and processing issues. Moreover, common CBAs possess a decomposition temperature 100°C above the melting point of the semi-crystalline polymers. Removing the extra heat usually becomes a serious processing bottleneck.
The decomposition of a CBA not only depends on the processing thermal profile, but also on its residence time under the decomposition temperature. If it requires too high a temperature to trigger its decomposition, or takes too much time to complete the decomposition reaction, it will be extremely difficult to incorporate to the plasticator.
13 Quite a few common CBAs are exothermic in nature. Exothermic reactions can promote gas expansion, but at the expense of weakening the polymeric melt strength due to the additional heating. At low expansion, polymer strength is usually not a concern, but strength becomes more critical as expansion ratio increases. Because the enthalpy plays a mixed role in the homogenizing, expansion, and stabilization stages of the foaming process, caution has to be exercised when selecting the CBA and foam fabrication method.
Most CBAs involve simple gases, which are very volatile. The inherent low solubility of the gas in the polymer combined with a high temperature profile may result in over-expansion and cell opening followed by collapsing. In contrast, PBA has less volatility and higher solubility to allow more dissolution in the melt. As a result, there are generally substantial plasticizing benefits, which renders more heat removal from the gas/melt possible. However, the volatile and less soluble CBAs virtually make a narrower foaming window. The density of the obtained foams would thus be relatively high. However, the volatile gas facilitates a sharp nucleation. If kept under control, it would be easier to obtain a fine-celled structure when using a CBA.
Many factor must be considered prior to selecting the PBA:
1. The gas release temperature closely matches the processing
temperature of the polymer. If the CBA decomposition temperature is significantly above the polymer process temperature, little or no foaming will occurs. If the CBA decomposition temperature is significantly below the polymer process temperature, poor cell structure and surface skin quality is likely to result. Along with the correct decomposition temperature, the CBA must release the gas at a controllable but rapid rate.
2. The reaction products and residue of CBA must be compatible with
material to be foamed and have little or no detrimental effect on properties or colour of the end product.
3. Performance
4. Cost-effectiveness and competitiveness of the finished product in a
particular application
5. Kind and amount of decomposed gas(es)
6. Appropriate decomposition with other additives (i.e., peroxide) 7. Nucleating effects out of decomposed particles
8. Color from leftover or by-products
9. Type of the reaction occurring during the process (exothermic or
endothermic).
Exothermic blowing agents are the organic origin substances, and as result of their decomposition nitrogen is emitted. During the decomposition of these blowing agents the heat emission occurs, which results in the increase of polymer temperature and gas pressure. Endothermic blowing agents are the inorganic origin and during their decomposition the carbon
14
dioxide is emitted. The use of endothermic chemical blowing agents activates the cooling of moulded parts and have impact on the decompression of gas inside moulded part, that contributes to the shortening of the cooling phase and time of the whole cycle of injection moulding process. When using the endothermic chemical blowing agents the porous structure with smaller pores sizes can be obtain, moulded parts have good surface quality and better mechanical proprieties than into the case of exothermic chemical blowing agents.[8]
Quite a few common CBAs are exothermic in nature. Exothermic reactions can promote gas expansion, but at the expense of weakening the polymeric melt strength due to the additional heating. At low expansion, polymer strength is usually not a concern, but strength becomes more critical as expansion ratio increases. Because the enthalpy plays a mixed role in the homogenizing, expansion, and stabilization stages of the foaming process, caution has to be exercised when selecting the CBA and foam fabrication method.
Most CBAs involve simple gases, which are very volatile. The inherent low solubility of the gas in the polymer combined with a high temperature profile may result in over-expansion and cell opening followed by collapsing. In contrast, PBA has less volatility and higher solubility to allow more dissolution in the melt. As a result, there are generally substantial plasticizing benefits, which renders more heat removal from the gas/melt possible. However, the volatile and less soluble CBAs virtually make a narrower foaming window. The density of the obtained foams would thus be relatively high. However, the volatile gas facilitates a sharp nucleation. If kept under control, it would be easier to obtain a fine-celled structure when using a CBA.
Table 3. Chemical blowing agents [9].
Blowing agent Class Volatiles
produced Decomposition range [°C] Gas yield [ccm/g]
Azocarbonamide Carbonamide N2, CO, CO2 190-230 220
Dinitrosopenta-methylenethetramine Nitrosoamine N2, NO, H2O, CH3, NH2 160-200 210
Benzenesulphono-hydrazide Hydrazide N2, H2O 146 170-250
4,4’Oxybis(benzenesul
phonohydrazide) Hydrazide N2, H2O 150 120-180
Dimethyl N,N’-dinitroso terephthalamide Terephthalamide N2, H2O, CO2 90-105 180 Azoisobutyronitrile Azo N2 95-98 136
Sodium Bicarbonate Inorganic CO2 100-130 125-130
Terephthalazide Acid azide N2 85-112 107-311
15 Recently a new foam injection molding technology that enables the ease of processing of the CBA method with the foaming characteristics of a PBA, but in a cost-effective fashion was proposed [10]. In particular, a single screw extruder was used to produce CO2 gas-laden polymer strands, that
then will be used as feed in injection molding.
1.4 Batch foaming process
Foaming of polymers can be carried out in a batch apparatus by dissolving a blowing agent in the matrix. The solubility of the blowing agent is then reduced rapidly by producing a thermodynamic instability in the structure (e.g., a pressure decrease), to induce nucleation of the bubbles. To stabilize the bubbles, the foam cells are vitrified when the temperature is reduced below the Tg (glass transition temperature) of the polymer.
Various foaming strategies have been adopted to reduce density and improve foam mechanical properties.
About 25 years ago, Martini and his colleagues [11] reported microcellular polymeric foams by using gas (in particular CO2) as physical
blowing agent. Later on, other authors followed this research’s line and Okamoto et al. [12] developed new technologies for producing nanocomposite polymeric foams by using poly(L-lactide) (PLA)/clay nanocomposite (PLACN) in a batch process by using supercritical CO2 as
physical foaming agent. This technology was used for different subsequent studies. In 2003, Ray and Okamoto [13], foamed pure PLA and PLA composite with organically modified MMT below Tm in batch mode, using
supercritical carbon dioxide as physical-blowing agent, in order to study the difference in morphology of cell structures. Also Ema and Okamoto [14] incorporated nanoclay in semi-crystalline PLA for batch foaming using supercritical carbon dioxide as blowing agent. These researchers noted that the dispersed nanoclay acted as nucleating sites for the cell formation.
Recently, also other Authors [15] studied the batch foaming of modified (by chain extender epoxy functionalized) semi-crystalline PLA, using CO2 as
physical blowing agent. The system consisted in an autoclave with a volume of 300 ccm connected by means of a boost device to the gas tank (containing CO2). The maximum working pressure was 200 bar and the limit in
temperature was 350 C. The reactor was thermally regulated by temperature-controlled oil. A basket holding four samples was designed to simultaneously foam the neat and modified PLAs. The specimens were cut from the hot pressed plates into discs with 6 mm diameter and placed into the reactor. A CO2 purge was performed prior to all experiments.
The foaming protocol was subdivided in several step: saturation of polymer with CO2 under pressure, at the temperature of 165°C and at
pressure ranging from 9.6 MPa to 14.2 MPa, for a time long enough to insure a sorption equilibrium in the entire sample; thermal stabilization of