Relevant phenomena and process
parameters in granulation for
manufacturing of pharmaceutical,
nutraceutical and zootechnical
products
(Questa pagina deve essere lasciata in bianco.
Cancellare questo testo nella versione definitiva)
UNIVERSITY OF SALERNO
DEPARTMENT OF INDUSTRIAL ENGINEERING
Ph.D. Course in Industrial Engineering
Curriculum in Chemical Engineering - XXXI Cycle
RELEVANT PHENOMENA AND PROCESS
PARAMETERS IN GRANULATION FOR
MANUFACTURING OF PHARMACEUTICAL,
NUTRACEUTICAL AND ZOOTECHNICAL
PRODUCTS
Supervisor
Ph.D. student
Prof. Anna Angela Barba
Veronica De Simone
Scientific Referee
Prof. Gaetano Lamberti
Ph.D. Course Coordinator
Prof. Ernesto Reverchon
(Questa pagina deve essere lasciata in bianco.
Cancellare questo testo nella versione definitiva)
To You…I raise my eyes...
To You…concrete absence of an eternal passage but more present of who is present...
iii
Publications
International journals
De Simone V., Dalmoro A., Lamberti G., d'Amore M., Barba A.A., “Central composite design in HPMC granulation and correlations between product properties and process parameters”, New Journal of Chemistry, 41 (2017) 6504-6513
doi: 10.1039/C7NJ01280B
De Simone V., Dalmoro A., Lamberti G., Caccavo D., d’Amore M., Barba A.A., “HPMC granules by wet granulation process: Effect of vitamin load on physicochemical, mechanical and release properties”, Carbohydrate Polymers, 181 (2018) 939-947
doi: 10.1016/j.carbpol.2017.11.056
De Simone V., Caccavo D., Lamberti G., d’Amore M., Barba A.A., “Wet-granulation process: phenomenological analysis and process parameters optimization”, Powder Technology, 340 (2018) 411-419
doi: 10.1016/j.powtec.2018.09.053
De Simone V., Dalmoro A., Lamberti G., Caccavo D., d’Amore M., Barba A.A., “Effect of binder and load solubility properties on HPMC granules produced by wet granulation process”, Journal of Drug Delivery Science and Technology, 49 (2019) 513-520
doi.org/10.1016/j.jddst.2018.12.030
Book chapter
De Simone V., Caccavo D., Dalmoro A., Lamberti G., d’Amore M.; Barba A.A., “Inside the phenomenological aspects of wet granulation: role of process parameters”, chap. V in “Granularity in Materials Science”, InTech Ed., 2018, ISBN 978-1-78984-308-8
iii
Proceedings
International
Barba A.A., d’Amore M., Dalmoro A., De Simone V., Lamberti G., “Production of granulates of hydroxypropyl methylcellulose loaded with vitamin B12 by wet granulation process”, 8th International Granulation
Workshop-Granulation Conference, 28-30/06/2017, Sheffield (UK), England De Simone V., Dalmoro A., Caccavo D., Lamberti G., d’Amore M., Barba
A.A., “Vitamins-loaded HPMC granules by wet granulation process: impact of liquid binder/vitamin solubility on HPMC granules properties”, 23rd
International Congress of Chemical and Process Engineering CHISA 2018, 25-29/08/2018, Prague (CZ), Czech Republic
De Simone V., Caccavo D., Lamberti G., d’Amore M., Barba A.A., “Phenomenological analysis, process parameters optimization and mathematical modeling of a low-shear wet granulation process”, 23rd
International Congress of Chemical and Process Engineering CHISA 2018, 25-29/08/2018, Prague (CZ), Czech Republic
De Simone V., Caccavo D., Lamberti G., d’Amore M., Barba A.A., Dalmoro A., Low-shear wet granulation process: a new strategy in design and manufacturing of granular materials, to be presented to 3rd European Conference on Pharmaceutics, 25-26/03/2019, Bologna, Italy
National
De Simone V., Dalmoro A., Lamberti G., Barba A.A., “Design of Experiment’s approach in granulation processes”, national conference GRICU 2016, 12-14/09/2016, Anacapri (NA), Italy
I
Contents
Publications ... iii
Proceedings ... iii
Contents ... I
Figures index ... VII
Tables index ... XI
Abstract ... XIII
Introduction ... 1
I.1 Why granular? ... 1
I.2 Scientific relevance of the granulation process ... 2
I.3 Industrial relevance of the granulation process ... 4
I.4 Main aims of this thesis ... 5
I.5 Outline of the thesis ... 5
Wet granulation: state of the art ... 7
II.1 Wet granulation process ... 7
II.2 Physical phenomena in wet granulation ... 9
II.2.1 Wetting and nucleation ... 9
II.2.2 Consolidation and growth ... 14
II.2.3 Attrition and breakage ... 16
II.3 Apparatuses and technologies in wet granulation .. 17
II.4 Parameters in wet granulation process ... 19
II.4.1 Feed material properties ... 20
II.4.1.1 Powder properties ... 20
II.4.1.2 Binder phase properties ... 20
II.4.2.1 Liquid to solid ratio and binder addition rate ... 21
II.4.2.2 Binder phase delivery method ... 22
II.4.2.3 Impeller rotation speed ... 23
II.4.2.4 Process time ... 23
II.5 Mathematical approach to describe the phenomena
involved in wet granulation ... 24
II.6 Chapter II remarks... 28
Methodologies and experimental apparatus set up ... 29
III.1 Generalities ... 29
III.2 Granulation experimental set up layout ... 29
III.3 Granules manufacture ... 32
III.3.1 Preparation of unloaded granules ... 32
III.3.2 Preparation of loaded granules ... 32
III.4 Techniques of Design of Experiments ... 34
III.4.1 Full Factorial Design ... 36
III.4.2 Central Composite Design ... 37
III.5 Granules characterization by standard protocols 38
III.5.1 Residual moisture content ... 39III.5.2 Compressibility and flowability ... 39
III.5.3 Granulometry and morphology ... 41
III.5.4 Thermal behaviour ... 41
III.5.5 In vitro dissolution... 42
III.5.5.1 Release of active molecules ... 42
III.5.5.2 Erosion of polymer... 43
III.5.6 Statistical analysis ... 43
III.6 Granules characterization by ad hoc methods ... 44
III.6.1 Mechanical properties ... 44
III.6.2 Dynamic Image Analysis device ... 45
III.7 Chapter III remarks ... 49
III
IV.1 Production of HPMC granules by Design of
Experiment approach ... 51
IV.1.1 Generalities ... 51
IV.1.2 Materials ... 52
IV.1.2.1 Why hydroxypropyl methylcellulose? ... 53
IV.1.3 Methodologies ... 53
IV.1.4 Results and discussions ... 55
IV.1.4.1 Screening of process parameters ... 55
IV.1.4.2 Process parameters effect on granules properties ... 56
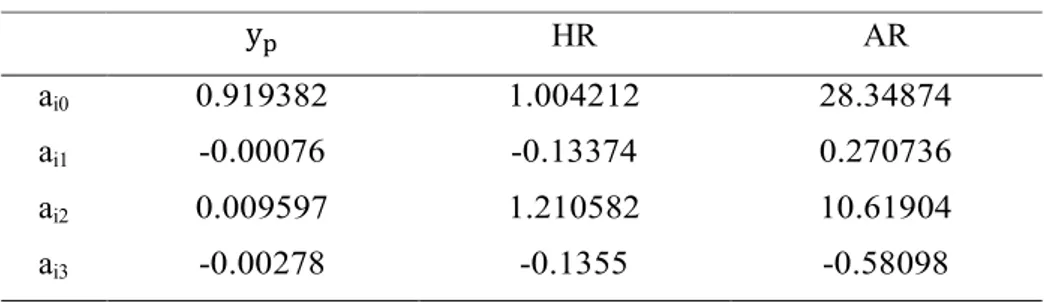
IV.1.4.3 Mathematical semi-empirical correlations ... 61
IV.2 Effect of vitamin payload on physicochemical,
mechanical and release properties of HPMC granules .. 67
IV.2.1 Generalities ... 67
IV.2.2 Materials ... 67
IV.2.2.1 Vitamin B12 ... 68
IV.2.3 Methodologies ... 68
IV.2.4 Results and discussions ... 69
IV.2.4.1 Effect of payload on physical granules properties ... 69
IV.2.4.2 Effect of payload on mechanical granules properties ... 70
IV.2.4.3 Effect of payload on morphological granule properties... 73
IV.2.4.4 Effect of payload on thermal granule properties ... 74
IV.2.4.5 Effect of payload on release granule properties ... 75
IV.3 Effect of binder phase and active molecule
solubility on granules properties... 79
IV.3.1 Generalities ... 79
IV.3.2 Materials ... 79
IV.3.2.1 Vitamin D2 ... 80
IV.3.3 Methodologies ... 80
IV.3.4 Results and discussions ... 81
IV.3.4.1 Effect of binder phase and vitamin solubility on physical granule properties ... 81
IV.3.4.2 Effect of binder phase and vitamin solubility on mechanical granule properties ... 84
IV.3.4.3 Effect of binder phase and vitamin solubility on release and erosion
granule properties... 85
IV.4 Chapter IV remarks ... 89
Phenomenological analysis for process parameters
optimization in wet granulation ... 93
V.1 Generalities ... 93
V.2 Materials ... 94
V.3 Methodologies ... 94
V.4 Results and discussions ... 97
V.4.1 Phenomenology through the analysis of the time evolution of the PSDs ... 97
V.4.2 Optimization of the process time ... 100
V.4.3 Optimization of binder flow rate and impeller rotation speed ... 101
V.5 Chapter V remarks ... 108
Mathematical modeling of the low-shear wet granulation
... 111
VI.1 Generalities ... 111
VI.2. From the continuous to the discretized form of
PBEs ... 112
VI.3 Equations discretization ... 114
VI.3.1 Agglomeration phenomena ... 114
VI.3.1.1 The kernel of coalescence ... 115
VI.3.2 Breakage phenomena ... 117
VI.3.2.1 The selection and breakage functions ... 118
VI.3.3 Nucleation phenomena ... 119
VI.3.4 Models implementation ... 120
VI.4 Modeling results ... 122
VI.5 Towards scale-up approaches for the wet
granulation process ... 125
VI.6 Chapter VI remarks ... 126
V
References ... 131
Symbols ... 151
Abbreviations ... 155
Appendix ... 157
Acknowledgments ... 163
VII
Figures index
Figure I.1 a. Published papers (patterned bars, axis y to the left) and citations (grey
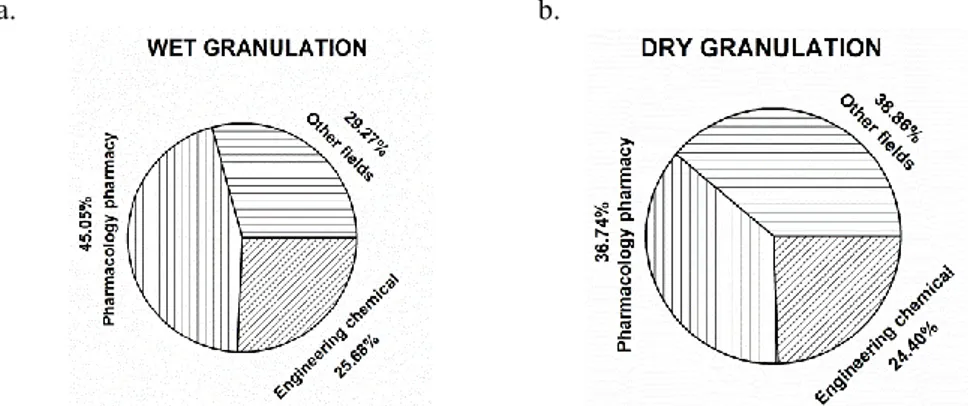
bars, axis y to the right) on the topic containing the words “wet granulation”. b. Published papers (patterned bars, axis y to the left) and citations (grey bars, axis y to the right) on the topic containing the words “dry granulation”. The data were obtained using the option “all data bases” ... 3
Figure I.2 Wet and dry granulation are prevalently applied in pharmacology
pharmacy and engineering chemical fields. The other fields are: chemistry medical, chemistry multidisciplinary, materials science multidisciplinary, engineering environmental, food science technological, metallurgy metallurgical engineering, chemistry physical, and chemistry applied ... 3
Figure II.1 Saturation stages of granules (Newitt, 1958, Iveson et al., 2001a) ... 8 Figure II.2 Formation mechanisms of the granules: (a) traditional description
(Sastry and Fuerstenau, 1973); (b) modern approach (Ennis and Litster, 1997) ... 9
Figure II.3 The five steps of nucleation: (1) drops formation; (2) impact of the drops
on powder bed and possible breakage; (3) coalescence of the drops on the surface of the powder; (4) drops penetration into the pores of the powder bed; (5) mixing of the liquid binder and powder by mechanical dispersion (Litster et al., 2001, Hapgood et al., 2002) ... 11
Figure II.4 Nucleation mechanism by (Schæfer and Mathiesen, 1996): a. immersion
mechanism; b. distribution mechanism ... 11
Figure II.5 Nucleation Regime Map (MRN) (Hapgood et al., 2003) ... 12 Figure II.6 Granule growth: a. growth by coalescence; b. growth by layering (Ennis
et al., 2007) ... 14
Figure II.7 Growth Regime Map (GRM) (Iveson et al., 2001b) ... 15 Figure II.8 Mechanisms of granules size reduction: a. attrition; b. breakage (Ennis
et al., 2007) ... 16
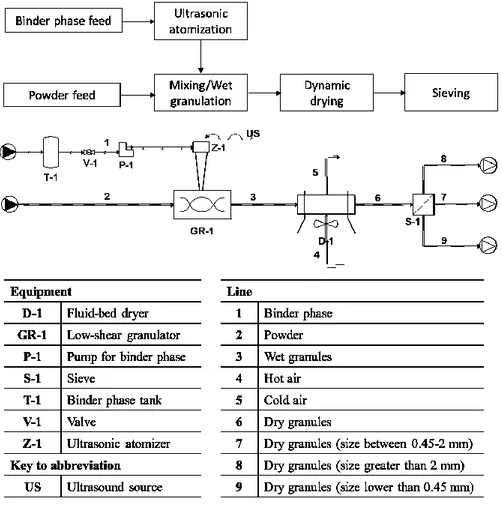
Figure III.1 Process schematization of granules production through the wet
granulation technique; the main sections are reported: the liquid binder phase (1) is pushed through peristaltic pump to the ultrasonic atomizer (Z-1), which sprays it on the powders (2) placed in the low-shear granulator (GR-1), where the wet granules (3) are formed. Then, the wet granules are subjected to the dynamic drying process (D-1), using hot air (5). After this step, the obtained dry granules (6) are separated
by sieves (S-1) in three fractions (7-8-9). Finally, only the fraction of interest (7) is recovered and characterized ... 30
Figure III.2 Process schematization of loaded granules production according to the
method 1 (dissolution of active molecule in binder phase)... 33
Figure III.3 Process schematization of loaded granules production according to the
method 2 (pre-mixing of active molecule with the powder at 78 rpm for 10 min) ... 34
Figure III.4 DIA device based on the free falling particles scheme, in agreement
with the standard ISO 13322-2:2006 ... 46
Figure III.5 Proper calibration sheet made of 38 disks of known dimensions: one of
2 cm, two of 1 cm, five of 5 mm, ten of 500 µm and ten of 200 μm ... 46
Figure III.6 Impact of the Ellipse Ratio (ER) value on the shape of the particle .... 48
Figure IV.1 Granules obtained with different combination of factors and levels: a.
particles with size smaller than 0.45 mm, b. particles with size between 0.45 and 2 mm, that is the size range required, and c. particles with size larger than 2 mm ... 60
Figure IV.2 Comparison between experimental and calculated product yield data
(calculated using a semi-quadratic fitting model) ... 64
Figure IV.3 Comparison between experimental and calculated Hausner Ratio data
(calculated using a semi-quadratic fitting model) ... 64
Figure IV.4 Comparison between experimental and calculated Angle of Repose data
(calculated using a semi-quadratic fitting model) ... 65
Figure IV.5 Particle Size Distributions (PSDs) of unloaded and loaded dry granules
with size between 0.45–2 mm ... 70
Figure IV.6 Typical force-deformation curves obtained for loaded and unloaded dry
granules with size between 0.71–1 mm ... 71
Figure IV.7 Compression analyses: strength of unloaded and loaded dry granule for
the three particle fractions (0.45-0.71 mm, 0.71–1 mm, 1–2 mm) ... 71
Figure IV.8 Compression analyses: young modulus of unloaded and loaded dry
granule for three particle fractions (0.45-0.71 mm, 0.71–1 mm, 1–2 mm) ... 72
Figure IV.9 Scanning Electron Microscope: a) HPMC powders; b) HPMC granule;
c) vitamin B12-loaded HPMC granule (payload 1 %); d) vitamin B12-loaded HPMC granule (payload 2.3 %); e) vitamin B12-loaded HPMC granule (payload 5 %) ... 73
Figure IV.10 DSC scans of pure vitamin B12, pure HPMC powders,
HPMC-vitamin B12 (payload 5 %) mixture, pure HPMC granules, HPMC granules with vitamin B12 (payloads 1 %, 2.3 %, 5 % w/w) ... 74
Figure IV.11 Photos of vitamin B12 loaded HPMC granules (payload 1 %, size
0.45-2 mm) prepared by method 1 (predissolving of vitamin B12 in binder phase volume) and method 2 (pre-mixing of vitamin B12 with the powders of HPMC at 78 rpm for 10 min)... 76
IX
size 0.45–2 mm; payloads 1 %, 2.3 % and 5 % w/w) ... 77
Figure IV.13 Percentage of vitamin B12 released from HPMC granules (granules
size 0.45–2 mm; payloads 1 %, 2.3 % and 5 % w/w) after 1 months of storage at room conditions ... 77
Figure IV.14 Microscope (Leica DM-LP) photos of 𝐺1 and 𝐺2granules (a, larger size; b, smaller size). 4 X magnification... 83
Figure IV.15 Particle Size Distributions (PSDs) of granules (0.45-2 mm in size)
unloaded (𝐺1, 𝐺2) and loaded with 1 % and 2.3 % of vitamins (𝐺1-B12, 𝐺2-D2).. 83
Figure IV.16 Mechanical properties of the unloaded and loaded granules with size
between 0.45-0.71 mm, 0.71-1 mm and 1-2 mm, in terms of granule strength. Data are shown as mean value ± standard deviation (SD) ... 85
Figure IV.17 Time profiles of the vitamin B12 and vitamin D2 percentage released
from 𝐺1 and 𝐺2 granules, respectively. The experiments were performed in distilled water at room temperature, pH 6.5 and under 50 rpm stirring. Data are shown as mean ± standard deviation (repeatability 3) ... 86
Figure IV.18 Time profiles of the eroded HPMC percentage from 𝐺1 and 𝐺2
granules. The experiments were performed in distilled water at room temperature, pH 6.5 and under 50 rpm stirring. Data are shown as mean ± standard deviation (repeatability 3) ... 87
Figure IV.19 Time profiles of the eroded HPMC and released vitamin B12
percentage from 𝐺1 granules (payloads 1 % and 2.3 %) ... 87
Figure IV.20 Time profiles of the eroded HPMC and released vitamin D2
percentage from 𝐺2 granules (payloads 1 % and 2.3 %) ... 88
Figure V.1 Undersize cumulative distribution of the HPMC particles at the process
times of 0, 2, 3, 6, 9, 12, 15, 18 and 20 min: a. undersize cumulative distribution by number 𝑄0; b. undersize cumulative distribution by volume, 𝑄3. The illustrated tests were carried out granulating 50 g of HPMC 20 powder with 93 rpm, 100 ml of binder, and a flow rate of 34 ml/min ... 98
Figure V.2 Number of particles per unit volume (axis y, right for 0 min and left for
the others) with a given diameter (axis x) at different times of the granulation process. The data shown were obtained working 50 g of HPMC 20 powder with an impeller rotation speed of 93 rpm and a distilled water volume and flow rate of 100 ml and 34 ml/min respectively. Each experimental point represents a mean value from three independent experiments ... 98
Figure V.3 Particle Size Distribution cumulated with ellipse ratio (ER): a. the
cumulative numeric undersize distribution (𝑄0); b. the density distribution by number (𝑞0𝑙𝑜𝑔) ... 99
Figure V.4 a. Granulation yield (% w/w of wet granules with size between 2000 μm
granules with size between 10000 μm and 20000 μm). Data are illustrated as mean values ± standard deviations (repeatability 3)... 100
Figure V.5 a. Response surface of granulation yields (% w/w of wet granules with
size between 2000 μm and 10000 μm) at the optimized process time (12 min), calculated by varying rpm and binder flow rate. Black balloons represent the experimental results of run 1-9, red stars represent the validation runs (102 rpm and 24 ml/min and 78 rpm and 42 ml/min). b. Response surface in a 2D contour plot representation... 103
Figure V.6 a. Response surface of big scrap (% w/w of wet granules with size
between 10000 μm and 20000 μm) at the optimized process time (12 min) determined by varying rpm and binder flow rate. Black balloons represent the experimental results of run 1-9, red stars represent the validation runs (102 rpm and 24 ml/min and 78 rpm and 42 ml/min). b. Response surface in a 2D contour plot representation... 105
Figure V.7 a. Response surface of weighted mean particle size of the volume
distribution density vs binder flow rate and rpm. Black balloons represent the experimental results of run 1-9, red stars represent the validation runs (102 rpm and 24 ml/min and 78 rpm and 42 ml/min). b. Response surface in a 2D contour plot representation... 106
Figure VI.1 Normalized coalescence kernel: (a) constant kernel; (b) sum kernel; (c)
product kernel; (d) coagulation kernel;(e) Equi Kinetic Energy kernel ... 117
Figure VI.2 Comparison between model predictions and experimental data of PSDs
at different times of wet granulation process, performed with an impeller rotation speed of 93 rpm and a binder phase flow rate of 34 ml/min. A: Agglomeration; B: Breakage; N: Nucleation. A indicates the pure agglomeration model; A+B the agglomeration and breakage model; A+B+N the agglomeration, breakage and nucleation model ... 124
XI
Tables index
Table I.1 Thesis map ... 6
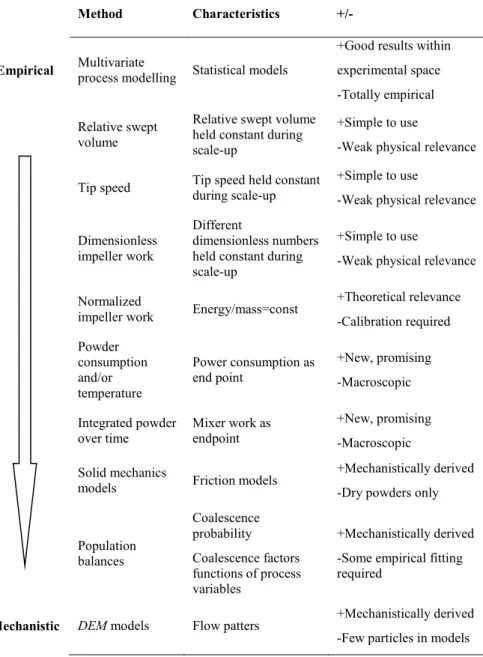
Table II.1 An overview of different granulation models ranging from pure empirical
to more or less mechanistic ones (Björn et al., 2005) ... 26
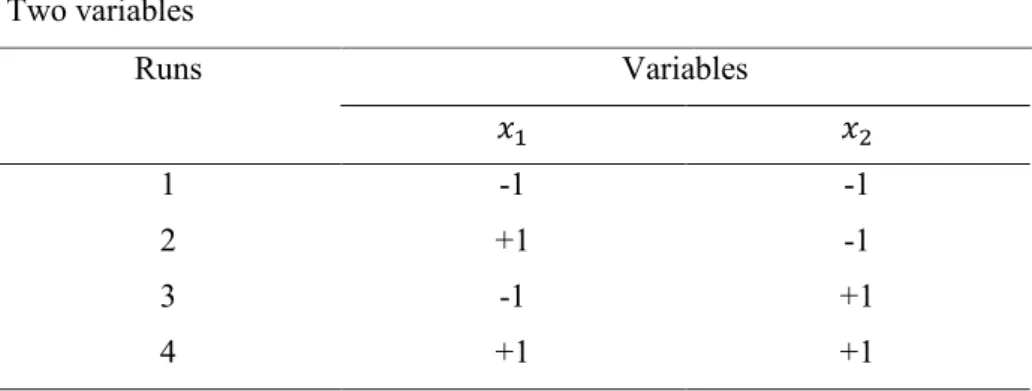
Table III.1 22 Full Factorial Design matrix for a combination of two factors (𝑥1 and
𝑥2), each taking two levels. The levels are conventionally given by minus one (-1), for low level, and plus one (+1), for high level ... 36
Table III.2 32 Full Factorial Design matrix for a combination of three factors (x1
and x2), each taking three levels. The levels are conventionally given by minus one
(-1), for low level, plus one (+1), for high level, and zero (0), for the medium level) ... 37
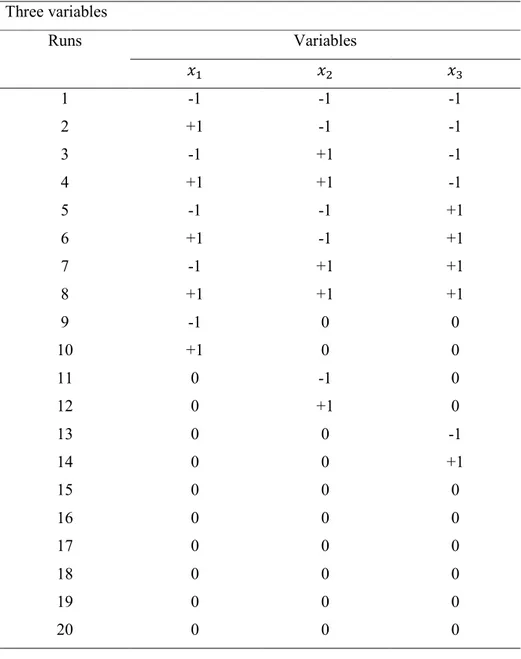
Table III.3 Central Composite Design matrix for three factors (𝑥1, 𝑥2and 𝑥3) and
three levels (conventionally encoded as -1, 0 and +1). The center point is replicated six once ... 38
Table III.4 U.S. Pharmacopeia table: flowability degree respect to carr index,
hausner ratio and angle of repose values ... 41
Table IV.1 Hydroxypropyl methylcellulose (HPMC 20) powder properties,
provided by Pentachem Srl (San Clemente, RN-Italy) ... 52
Table IV.2 The intensities (levels) values for each factor ... 53 Table IV.3 Experimental work plan for three variables at three levels, according to
the CCD statistical protocol ... 54
Table IV.4 Average values with standard deviation of the product yield (% w/w of
dry granules within the size range 0.45-2 mm) and of the manufacturing scraps (small scrap: % w/w of dry granules with size lower than 0.45 mm; big scrap: % w/w of dry granules with size greater 0.45 mm) ... 57
Table IV.5 Average values with standard deviation of the moisture, bulk density,
and tapped density of the granules with size 0.45-2 mm ... 58
Table IV.6 Average values with standard deviation of the Hausner Ratio, Carr Index
and Angle of Repose of the granules with size 0.45-2 mm ... 59
Table IV.7 Regression coefficients of the tested correlations by using a linear model
Table IV.8 Regression coefficients of the tested correlations by using a
semi-quadratic model ... 62
Table IV.9 Regression coefficients of the tested correlations by using a quadratic
model ... 62
Table IV.10 R-square values of the response variables (yp, HR, and AR)... 63
Table IV.11 𝛥𝐴𝐼𝐶 values of the response variables (𝑦𝑝, HR, and AR) ... 63 Table IV.12 Combination of levels not present in the plan work ... 65 Table IV.13 Correlations’ validations: experimental data and predicted value for
combination of levels not present in the plan work ... 65
Table IV.14 Unloaded and loaded granule properties (size 0.45–2 mm) in terms of
product yields, flow indices, residual moisture content and mean particle size, obtained after drying and sieving (big scrap: particle fraction with size greater than 2 mm; small scrap: particle fraction with size lower than 0.45 mm) ... 69
Table IV.15 Product yield, Hausner Ratio and Carr Index of vitamin B12-loaded
granules (payload 1 %, size 0.45-2 mm) obtained predissolving of vitamin B12 in binder phase volume) and method 2 (pre-mixing of vitamin B12 with the powders of HPMC at 78 rpm for 10 min) ... 75
Table IV.16 Physical properties of the unloaded granules (𝐺1 and 𝐺2) and of those
loaded with vitamin B12 and vitamin D2, obtained after drying and sieving (granule size 0.45-2 mm), in terms of product yields, manufacturing scrap (big scrap and small scrap) and flow indices. Data were expressed as mean value ± standard deviation (SD)... 82
Table V.1 Work plan for two independent variables (factors, k), each at three
intensities (levels, L), in agreement with Full Factorial Design protocol
(𝑟𝑢𝑛 𝑛𝑢𝑚𝑏𝑒𝑟 = 𝐿𝑘) ... 95
Table V.2 Results of the run in terms of granulation yield, big scrap and
volume-weighted mean particle size at the optimized process time (12 min)... 102
Table V.3 Fitting parameters for the polynomial fitting equation and the coefficient
of determination ... 102
Table V.4 Comparison between experimental results and modeling predictions .. 107
Table VI.1 Examples of 𝛽(𝑢, 𝑣) and degrees of homogeneity ... 116 Table VI.2 Parameters values of fitting ... 123
XIII
Abstract
Wet granulation is a size enlargement process used in many fields, such as pharmaceutical, nutraceutical, zootecnichal, etc., due its ability to improve technological properties of the final product, compared to the powder form, and/or to realize suitable delivery systems for drug/functional molecules for oral administrations/food preparations and/or to produce intermediate processing products. In spite of its widespread use, economic importance and almost 50 years of research, granulates manufacture is still based on empirical approach. Moreover, phenomena involved in powders aggregation are not well understood, and thus it is difficult to successfully obtain a product with tailored features without extensive experimental tests.
In the scientific literature the approach to the granulation study is based on experimental tests, to investigate the impact of formulation and process variables on granules properties, or on modeling activities, to mathematically describe the involved phenomena. The two approaches, experimental and theoretical, are rarely applied together. In this study a novel integrate strategy of investigation was applied to elucidate the role of the phenomenological aspects, and their connection with the main operating parameters in granulation process, on the granules final properties, in order to develop physical-mathematical descriptions of the size enlargement unit operation, which can indubitably constitute a starting point for scale up purposes.
The first step of the Ph.D. research activity was the design and realization of a bench scale experimental set up, with the innovative feature of using an ultrasonic atomizer for spraying the wetting phase in order to improve its dispersion degree on the surface of powder bed. Four are the main sections composing the realized apparatus: feeding section, production section, stabilization section and separation section. For the preparation of granules, hydroxypropyl methylcellulose (HPMC) was used as powder model material due to its versatile properties. It is an easy to handle, available at low cost, odourless, hypoallergenic, biocompatible, and not toxic polymer, used as excipient in the formulation of hydrogel-based matrices in form of tablets or granules, in order to provide controlled release of oral solid dosage systems. Distilled water was used as binder phase. In the built configuration, the powder was placed in a low-shear granulator and agglomerated by spraying the binder phase. The produced wet granules were stabilized by dynamic drying in presence of a hot air flow, because the evaporation of the residual moisture slows down the degradation of the granules. The dry granules were
separated by manual sieving with cutoff sizes from top to bottom as follows: 2 mm, 0.45 mm and a collection pan. Three granules fractions were obtained by the separation step: a fraction of “big scrap”, i.e. particles with size larger than 2 mm, one of “small scrap”, i.e. particles with size smaller than 0.45 mm, and one of “useful”, i.e. particles with size between 0.45-2 mm. The range size 0.45-2 mm was considered as the fraction of interest being a size typical range of granules in the food, pharmaceutical and zootechnical fields. Finally, only the fraction of useful was subjected to characterization methods carried out adopting both the ASTM (American Society for Testing and Materials) standards and ad hoc innovative protocols. In particular, a new procedure for analysing the mechanical properties of granules, and an ad hoc built Dynamic Image Analysis (DIA) device, based on the free falling particle scheme, for monitoring the evolution of the PSD during the wet granulation process, were developed.
The experimental campaigns were planned by Design of Experiments (DoEs) approaches. A system with three process parameters (factors), i.e. impeller rotation speed (rpm), binder to powder ratio, and binder phase flow rate, each at three intensities (levels) was considered. Their impact on granules properties were assayed to find the best process operating conditions able to produce granules with tailored features, i.e. high product yield (% w/w of dry granules with size between 0.45 mm and 2 mm), low residual moisture content, and good flowability and compressibility properties. Under phenomenological point of view, it was observed that not all the combinations of parameter levels ensure good granulation. There are operating conditions, like low rpm with high binder phase flow rate and low binder to powder ratio, or, high rpm with lower binder phase flow rate and binder to powder ratio, which combined together can produce a high amount of granules with size lower than requested one (0.45-2 mm), i.e. failure of the aggregation phenomena. Others, like low rpm with high binder phase flow rate and high added binder phase amount, instead, can achieve clusters of powder and binder, i.e. over wetting phenomena, which is a condition to avoid. The best conditions of granulation were obtained with high rpm, high binder to powder ratio and low binder phase flow rate.
To fully understanding the behaviour of HPMC granules as active ingredient delivery systems, the intensities of process parameters, which are found to give the better product yield, were used in the production of loaded granules. In particular, the effect of three formulation variables, i.e. molecule payload, molecule solubility and binder type, on physical and mechanical properties of granules were investigated and, moreover, analysis of release mechanisms were speculated. A hydrophilic compound, vitamin B12, and a lipophilic one, vitamin D2, were employed as model molecules. First of all, the best loading method in HPMC granules for the hydrophilic molecule, vitamin B12 (payload 1 % w/w), was investigated. Vitamin B12 was
XV
incorporated in the HPMC granules by two different loading methods: according to the method 1, the vitamin B12 was dissolved in the liquid binder phase (here the binder phase was a solution of distilled water and vitamin B12); according to the method 2, the vitamin B12 was pre-mixed with HPMC powders (here the powder was a mixture of HPMC and vitamin B12). It was observed that the loading method type does not influence the granules flowability properties and the product yield, however, a better dispersion of vitamin B12 inside the HPMC polymer matrix was achieved by using the method 1, perhaps for the uniform spraying of B12 together with the binder phase. Thus, by exploiting the most successful method 1, two different payloads of vitamin B12 and vitamin D2 (1 % and 2.3 % w/w) were assayed. Due to lipophilic properties of the D2, a binder phase made by a solution of ethanol and water with a 75/25 v/v ratio was used to produce vitamin D2 loaded HPMC granules. Results showed that the use of ethanol in the binder phase reduces the product yield and leads to the formation of granules with less defined shape, smaller mean size, less hard structure and worse flowability. Moreover, the presence of ethanol induces a slightly faster polymer erosion respect to granules obtained by using only water. The increase of payload both for the hydrophilic and lipophilic molecule leads to the formation of granules with a harder and more compact structure. The vitamins solubility influences their release mechanism: diffusion for the hydrophilic molecule (at 3 hours the vitamin B12 was fully released, regardless of the payload and of the HPMC erosion rate) and erosion for the lipophilic one (at 3 hours the amount of vitamin D2 released was similar to the amount of eroded HPMC).
Due to the relevance of size distributions in practical uses of granulates (the process yield is based on this parameter), hardware and software of a
DIA-device for PSD analysis were designed, developed, tested and then used
to perform studies on the growing of the powder agglomerates during the process. PSD measurements were used to obtain a basic understand of the phenomenological aspects for optimize the key process parameters, i.e.: process time, impeller rotation speed and binder phase flow rate. The process parameters optimization was carried out by Response Surface Methodology (RSM) and using the granulation yield (% w/w of wet granules within the size range 2-10 mm) as the main variable of interest. It was observed that the agglomeration, breakage and nucleation phenomena occur simultaneously in the granulator, with the predominance of the agglomeration during the binder addition phase, later balanced by the breakage phenomenon. Thanks to this initial phenomenological analysis, process time was optimized. Response surface studies indicated that the interaction between the impeller rotation speed and the binder flow rate influences the granulation yield (and in general the granules PSDs), especially at high rpm.
Agglomeration, breakage and nucleation phenomena experimentally observed by PSDs analysis were mathematically described by using the Population Balance Equations (PBEs) approach. PBEs were discretized in 60 classes, ranging from 60 to 20000 μm with a geometrical progression of 21/6,
therefore, the resulting model was a system of 60 Ordinary Differential Equations (ODEs), one for each class, which was implemented and solved numerically by MATLAB® 2014b software. Suitable mathematical functions
to describe phenomena and parameters were selected from literature or purposely developed in this work. In particular, three models with increasing complexity were considered: a pure agglomeration model that disregards all the other phenomena; an agglomeration and breakage model; a complete model with agglomeration, breakage and nucleation. The different modeling structures were then validated by comparison with experimental data. As overall result, it was observed that a pure agglomeration model overestimates the granules formation and, despite the presence of the breakage factor improves the model capabilities, the best matching with experimental evidences was obtained using the complete model, which takes into account also the nucleation phenomena. Achieved results prove that the developed modeling structures respond to physical observed phenomena.
1
Chapter I
Introduction
I.1 Why granular?
Granulation, also known as agglomeration, pelletization, or balling, is a “size-enlargement process” of small particles (powders in crystalline or amorphous status) into larger coherent and stable masses, called granules, in which the original particles are still identifiable. The aim of the granulation process is to improve the properties of the final product compared to the powder form and/or to realize suitable delivery system for drug/functional molecules for oral administrations/food preparations and/or to produce intermediate processing products. Under technological point of view, due to more regular shape and larger size, the granules give better flow properties for safer and cheaper transport and storage, lower the caking and lump formation (especially for hygroscopic materials), improve heat transfer features, allow to obtain a more uniform distribution of the incorporated active molecule, lower the powder dispersion in the environment, linked to a reduced inhalation, handling and explosion risks hazard (Perry and Green, 1999, Iveson et al., 2001a).
In spite of its widespread use, economic importance and almost 50 years of research, granulation in practice was more of an art than a science, i.e., there were a qualitative understanding of both the granule growth mechanisms and the effects of different variables on agglomeration phenomena (Iveson et al., 2001a). Over the past decade, design, scale-up, and operation of granulation processes have been considered as quantitative engineering and significant advances have been made to quantify the granulation processes (Hapgood et al., 2003).
Basically, the granulation methods are divided into dry and wet ones (Shanmugam, 2015). Dry granulation is based on the mechanical compression (slugs) or compaction (roller compaction) of a dry powder, while the wet granulation exploits a granulation liquid called “binder phase” to agglomerate the powder particles. During wet granulation, the binder
phase is added to the powder in a tumbling granulator, high or low shear mixer granulator, fluidized bed granulator, or similar devices, allowing the particles agglomeration. The bonds between particles depend on a combination of capillary pressure, surface tension and viscous forces. This second process involves a final step of granules stabilization by removal of the wetting phase to make the relevant bonds permanent (Shanmugam, 2015, Iveson et al., 2001a, Iveson and Litster, 1998b).
Among these two techniques, wet granulation is the most widely used, as can be seen from data on scientific relevance of granulation process, reported in the paragraph I.2. Nowadays, wet granulation is recognized as an example of “powder particle design”. The granule final features are controlled by a perfect combination of formulation variables (feed-materials properties, i.e.: binder phase viscosity, liquid-solid surface tension, Particle Size Distribution (PSD) and binder phase adhesive properties) and operating variables (i.e.: binder phase volume, binder phase flow rate, method of binder phase addition, impeller rotation speed and process time) (Mahdi et al., 2018, Luo et al., 2017). In addition, final granules properties depend on phenomena taking place in granulators, i.e. physical transformations of the powder particles, with kinetic mechanisms and aggregation rate controlled by formulation and process variables (Hapgood et al., 2003, Perry and Green, 1999). Therefore, to produce granular structures with tailored features (in terms of size and size distribution, flowability, mechanical and release properties, etc.), both a careful characterization of the feed-material properties and a deep understanding of operating parameters and phenomena involved during granule formation are needed (Hapgood et al., 2003, Suresh et al., 2017, Litster, 2003b). This can also lead to optimized processes in terms of production costs and other types of resources involved. However, the majority of literature is concerned experimentally with the role of material properties and process conditions on the properties of the product granules, while, quantitative aspects of the phenomena are still not well understood.
I.2 Scientific relevance of the granulation process
The granulation is a topic strongly treated in literature for almost 50 years. Some of the earliest pioneering work were performed by Newitt (1958) and Capes (1965) using sand in drum granulators. Since then, a large volume of work has been published that studying several materials, ranging from minerals to pharmaceuticals, and using several equipment, ranging from fluidised beds to high shear mixers. Over the years, a number of books and comprehensive review papers have been written to summarise the state of knowledge in this discipline (Iveson et al., 2001).
A query of the Web of Science (the well-known Thomson Reuter’s database indexing the scientific journals), carried out in mid-September 2018
3
searching for papers with the “topic” containing the words “wet granulation” (using the option “All Databases), gave a list of 1647 papers published since 2007 to the date of the request, i.e. roughly in last ten years. These papers produced more than 10 thousand of citations during the time span of the investigation. The evolution with time of the published papers (patterned bars, visible on the left axes) and of the citations (grey bars, visible on the right axes) is show in Figure I.1 (a.) (data for 2018 were not reported since they are not yet complete).
a. b.
Figure I.1 a. Published papers (patterned bars, axis y to the left) and citations (grey
bars, axis y to the right) on the topic containing the words “wet granulation”. b. Published papers (patterned bars, axis y to the left) and citations (grey bars, axis y to the right) on the topic containing the words “dry granulation”. The data were obtained using the option “all data bases”
a. b.
Figure I.2 Wet and dry granulation are prevalently applied in pharmacology
pharmacy and engineering chemical fields. The other fields are: chemistry medical, chemistry multidisciplinary, materials science multidisciplinary, engineering environmental, food science technological, metallurgy metallurgical engineering, chemistry physical, and chemistry applied
As can see, the publishing rate has a constant trend until to 2014, and it is increased in time until today, signifying a mature subject of investigation. On the other hand, the number of citations have an increasing trend in time if the data of 2014 are not considered, showing an increasing interest for this topic from all over the world. The prevalent research area for this subject is “pharmacology and pharmacy” seen that the granules can constitute a good delivery system for drug/functional molecules for oral administrations/food preparations or intermediate products for the preparation of tablets. However, several journals in the area “engineering chemical” have treated this topic. In particular, of 1647 papers 742 (i.e. 45.05 %) fall within the area “pharmacology and pharmacy” and 423 (i.e. 25.68 %) in the area “engineering chemical”, suggesting the strong interest of the wet granulation process from an engineering point of view (see Figure I.2 (a.)).
The same search (since 2007), done using "dry granulation" as topic, gave 993 published papers with about 8 thousand citations during the time span of the investigation (always from 2007 to 2017). The time evolution of the published papers (patterned bars, visible on the left axes) and of the citations (grey bars, visible on the right axes) is illustrated in Figure I.1 (b.). Also the dry granulation is predominantly used in the area “pharmacology and pharmacy”. Of 1037 papers 381 (i.e. 36.74 %) regard the area “pharmacology and pharmacy” and 253 (i.e. 24.40 %) the area “engineering chemical” (see Figure I.2 (b.)).
All these data showed the continuous appeal of granulation for the scientific community and clearly underlined that among the two methods of granulation the wet one is the most studied and applied despite the fact that it involves multiple unit processes (such as wet massing, drying and sieving). Therefore, the wet granulation is the technique used for the granules production in this Ph.D. thesis.
I.3 Industrial relevance of the granulation process
Granulation finds application in a wide range of industries including mineral processing, agricultural products, detergents, pharmaceuticals, foodstuffs, nutraceuticals, cosmetics, zootechnical and specialty chemicals. For marketing reason and technological aspects, granules are used for processing both intermediate materials and final products of many industrial transformations. In the chemical industry alone it has been estimated that 60 % of products are manufactured as particulates solid and a further 20 % use powders as ingredients. The annual value of these products is estimated at US$1 trillion in the US alone (Iveson et al., 2001a). In pharmaceutical field, solid dosage forms remain an important part of the overall drug market, despite the success and the development of new pharmaceutical forms. The oral solid dosage forms market was of $571 million in 2011 and projected to reach $870 million at the end of 2018 (Wright, 2016). In particular, among
5
novel drugs approved by FDA (Food and Drug Administration), 46 % in 2014 and 32 % in 2016 were solid dosage products (Langhauser, 2017), most of them made of granules. The most important pharmaceutical industries, such as Patheon, Aesica, Rottendorf Pharma GmbH, Catalent Pharma, continually do investments in oral solid manufacturing solutions, including the development of granulation processing methods (Van Arnum, 2015). Granulated products are also highly used in the fertilizers field: about 90 % of fertilizers are applied as solids, less as powder, more in granular form. The global demand for fertilizer nutrients was estimated to be 184.02 million tons in 2015, and it is forecast to reach 201.66 million tons by the end of 2020 (FAO, 2017). The animal feed additives global market was estimated at 256.8 kilo tons in 2015, and in particular, industries aim to develop new technologies (Research, 2017), very often based on granulation principles, to provide stabilization and effective protection of the active components in the finished products.
I.4 Main aims of this thesis
Aim of this research project is to investigate the role of the phenomenological aspects, and their connection with the main operating parameters in granulation process, on granules final properties, in order to develop physical-mathematical descriptions of this enlargement unit operation, which will constitute the starting point for the scale up studies. To this scope granular structures with tailored features (in terms of size and size distribution, flowability, mechanical and release properties, etc.), through the design and realization of a bench scale experimental set up, were produced and characterized by standard and ad hoc innovative protocols.
The comprehensive approach of experimental and modeling studies constitutes the main novelty of this Ph.D. research activity.
I.5 Outline of the thesis
An introduction on the scientific and industrial importance of granulation process is followed, in particular, by the review of the literature on wet granulation process, concerning relevant physical phenomena, apparatuses, role of formulation and process parameters on the final granules properties, and mathematical approaches to describe the involved phenomena (Chapter two).
Development of dedicated protocols for granulated materials stabilization, separation and characterization and of experimental set up for granules manufacturing with tailored features (in terms of size and size distribution, flowability, mechanical and release properties, etc.) were described (Chapter three).
Several applications concerning bench scale production of granules unloaded and loaded with hydrophilic and lipophilic active molecules, by using the design of experiment statistical protocols are shown (Chapter four).
Studies of phenomenological aspects involved in the formation of the granules, correlated to the main process parameters, and operating conditions optimization are presented by experimental demonstrations (Chapter five).
Physical-mathematical models describing the observed phenomena are developed and approaches towards the scale up of wet granulation process are discussed (Chapter six).
The conclusive part endorses the main findings of this Ph.D. research project (Chapter seven).
The symbols and abbreviations list is reported.
Abstracts relative to the main publications inherent the Ph.D. researches are showed in the Appendix section.
Table I.1 Thesis map
Chapter two Wet granulation: state of the art
Chapter three Methodologies and experimental apparatus set up
Chapter four Granulation process applications
Chapter five Phenomenological analysis and process parameters optimization in wet granulation
Chapter six Mathematical modeling of the low-shear wet granulation
Chapter seven Conclusive remarks about the main findings of this Ph.D. research project
Symbols Symbols list
Abbreviations Abbreviations list
7
Chapter II
Wet granulation: state of the art
II.1 Wet granulation process
Wet granulation is a size enlargement process of powder particles used in many fields, such as pharmaceutical, nutraceutical, and zootecnichal, to improve technological properties of powders such as flowability, compressibility, dosage and so on (Agrawal et al., 2003, Asgharnejad et al., 2000, Jona et al., 2007, Katdare and Kramer, 2004, Lintz and Keller, 2006, Pathare and Byrne, 2011, Phinney, 2000, Phinney, 2001). During wet granulation, a liquid phase called “binder” is added to the powder in a tumbling granulator, high or low shear mixer granulator, fluidized bed granulator, or similar devices, allowing the particles agglomeration (Iveson and Litster, 1998b). It is usually performed in four steps: 1) homogenization of dry powders; 2) wetting by binder addition; 3) wet massing with binder feeding system switched off; 4) drying of the wet granules (Nalesso et al., 2015). Newitt (1958) has described five states of liquid saturation for the granules during the wet granulation process (see Figure II.1), which depend on the amount of binder used to mixer the powder. Before the addition of binder to the dry powder the agglomerates only exist due to attractive forces like the Van der Waals forces. The pendular stage is the first saturation stage: here particles are held together by liquid bridges. With the addition of further binder, the funicular state is formed. It is an intermediary stage between the capillary and the pendular stage, where the voids are not fully saturated with liquid because the amount of added liquid is not sufficient. When these voids inside the agglomerate are saturated with liquid and the surface liquid is drawn back into the pores under capillary action, the capillary stage occurs. If the particles are held within or at the surface of a liquid drop, or if unfilled voids remain trapped inside the droplet, the droplet state and pseudo-droplet state occur respectively. The droplet stage corresponds to what is generally called over-wetting in granulation: the wetted mass loses most of its strength and turns into a paste until to give a
suspension with further liquid addition. It is possible to switch from the pendulum state to that of drops if the liquid binder is injected continuously, or if it occurs the consolidation phase which tends to reduce the granule pores. However, the capillary stage is the optimum state and supposed to give the highest granule strength. In fact, with an amount of liquid less than that required by the capillary state, little adherent granules will be formed. While, with a greater amount of liquid than that required by the capillary state, granules not properly adherent will be obtained (Iveson et al., 2001a).
Figure II.1 Saturation stages of granules (Newitt, 1958, Iveson et al.,
2001a)
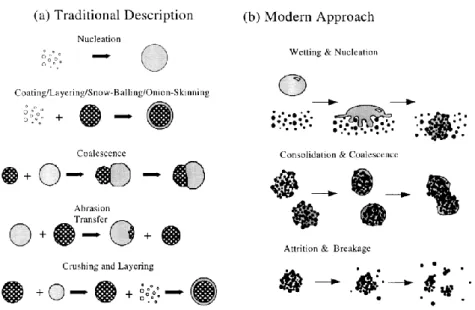
The behaviour of the powder particles during the wet granulation process has been deeply investigated and rationally described by consecutive cyclic mechanisms such as wetting and nucleation, consolidation and growth, and attrition and breakage (Ennis and Litster, 1997, Iveson et al., 2001a), as reported in Figure II.2. Wetting and nucleation are the initial stages in all wet granulation processes, here the dry powder bed is brought into contact with liquid, and a number of particles adhere to give a distribution of nuclei granules that are small aggregates (Abberger, 2007, Chitu et al., 2011, Iveson et al., 2001a, Iveson et al., 2001b). Agglomeration (consolidation and growth) is the stages where the granules collide one on each other: collisions lead to an increase of compaction and size of granules (Abberger, 2007, Chitu et al., 2011, Iveson et al., 2001a, Iveson et al., 2001b). Attrition and breakage are the stages where the wet or dry granules, too large or weak and brittle, deform or break due to shear and impact forces: small particles are produced, generating new nuclei or granules that re-enter the cycle (Abberger, 2007, Chitu et al., 2011, Iveson et al., 2001a, Iveson et al., 2001b). These phenomena are also mathematically described by mechanistic models but the direct application of these models, despite their level of completeness, is still hindered by the impossibility to obtain an ab initio estimation of most of their parameters (Abberger, 2007, Hounslow et al., 1988, Sanders et al., 2009). They coexist in all the wet granulation processes, even if their importance is related to the process type. For example, in the
9
fluid-bed granulation the wetting phase prevails while in the high-shear granulation the consolidation step is predominant.
Figure II.2 Formation mechanisms of the granules: (a) traditional
description (Sastry and Fuerstenau, 1973); (b) modern approach (Ennis and Litster, 1997)
These mechanisms control final granule properties, as the density and the size distribution, and depend on the chosen formulation as well as imposed operating conditions (Rajniak et al., 2007, Chitu et al., 2011, Iveson et al., 2001a, Litster, 2003b, Litster et al., 2001, Perry and Green, 1999). In particular, physicochemical properties of primary particles and binder phase determine surface wetting, spreading, adsorption and solid bridge strength.
II.2 Physical phenomena in wet granulation
II.2.1 Wetting and nucleation
Wetting and nucleation are the initial stages and more important in wet granulation process. Dry powder bed and liquid binder first come into contact through the wetting stage in a zone called “wetting zone”: the binder is sprayed onto the powder mass, attempting to distribute it evenly (Iveson et al., 2001a). After being wetted by the liquid binder, particles start to agglomerate forming initial nuclei of two or more particles, that are small granules: the nucleation stage refers to the formation of initial aggregates that are the result of interaction between the binder spray droplets and the powder in the granulator (Cameron et al., 2005, Iveson et al., 2001a). These initial stages are very important for the outcome of the wet granulation
process: low yields can be obtained if the powder has a poor wetting with the chosen binder, or if incorrect operating conditions are set.
Over the years, studies of wetting thermodynamics have highlighted that two are main parameters to be controlled: the angle of contact (𝜃) between solid particles and binder phase, and the spreading coefficients (𝜆) of the binder phase on the powder surface. These aspects are important to understand if the wetting stage is energetically favorable or not (Iveson et al., 2001a). The solid–liquid contact angle is the angle between the liquid drop on the solid surface and the same surface. It depends on the interaction between liquid and solid and affects the characteristics of the granulated product. Based on the solid–liquid contact angle value, a material can be easily wettable (0° < 𝜃 < 90°), perfectly wettable (𝜃 = 0°) or borders on those value), and hardly wettable (90° < 𝜃 < 180°). The solid – liquid contact angle can be calculated as a function of surface free energies (𝛾𝑠𝑣, 𝛾𝑠𝑙, 𝛾𝑙𝑣: subscripts “l”, “s” and “v” denote liquid, solid and vapour phase
respectively) in according to Young–Dupre equation (see eq. (II.1)), valid for θ > 0°.
𝛾𝑠𝑣− 𝛾𝑠𝑙= 𝛾𝑙𝑣∗ 𝑐𝑜𝑠 𝜃 (II.1)
According to Krycer et al. (1983) and Zajic and Buckton (1990) the final granule properties are also correlated with the spreading coefficient (𝜆). The spreading coefficient is a measure of the tendency of a liquid and solid combination to spread over each other and is given by the difference between the works of adhesion and cohesion. It indicates whether spreading is thermodynamically favorable. There are three possibilities in spreading between a solid and a liquid: the liquid may spread over the solid (𝜆𝑙𝑠) and
create a surface film; the solid may spread or adhere to the liquid (𝜆𝑠𝑙) but no film formation occurs; both the liquid and solid have high works of cohesion, and the solid–liquid interfacial area will be minimized. In particular, the spreading coefficient 𝜆𝑙𝑠 is calculated as difference between work of adhesion for an interface (𝑊𝑎) and work of cohesion for a liquid
(𝑊𝑐𝑙), using the eq. (II.2), while, the spreading coefficient 𝜆𝑠𝑙 is calculated as difference between work of adhesion for an interface (𝑊𝑎) and work of cohesion for a solid (𝑊𝑐𝑠), using the eq. (II.3).
𝜆𝑙𝑠= 𝑊𝑎− 𝑊𝑐𝑙 = ( 𝛾𝑙𝑣· (cos 𝜃 + 1)) − (2 · 𝛾𝑙𝑣) (II.2)
𝜆𝑠𝑙 = 𝑊𝑎− 𝑊𝑐𝑠= ( 𝛾𝑙𝑣· (cos 𝜃 + 1)) − (2 · 𝛾𝑠𝑣) (II.3)
If 𝜆𝑙𝑠 is positive stronger and denser granules are formed and the particles are maintained together by means of liquid bridges because the binder will spread and form a film over the powder surface. Instead if 𝜆𝑠𝑙 is positive weaker and more porous granules are obtained and the bonds between the particles are few and they will create only where the liquid and powder
11
initially touch, considering that in this case the liquid will not spread or form a film.
As the wetting process proceeds, the drop penetrates into the pores of the powder surface and forms a nucleus that migrates outwards as the nucleus grows. The nucleation stage is composed by five steps, as shown in the Figure II.3 (Litster et al., 2001, Hapgood et al., 2002): (1) drops formation at the spray nozzle, from which they fall and impact the surface of the powder bed; (2) impact of the drops on powder bed and their possible breakage; (3) coalescence of the drops on the surface of the powder if the drops are slow to penetrate the surface or if the flux of drops on the surface is high, leading to a broad nuclei size distribution; (4) penetration of the drops into the pores of the powder bed by capillary action to form a nucleus granule; (5) mixing of the liquid binder and powder by mechanical dispersion.
Figure II.3 The five steps of nucleation: (1) drops formation; (2) impact of
the drops on powder bed and possible breakage; (3) coalescence of the drops on the surface of the powder; (4) drops penetration into the pores of the powder bed; (5) mixing of the liquid binder and powder by mechanical dispersion (Litster et al., 2001, Hapgood et al., 2002)
The ideal nucleation conditions occur when for each drop, which is sprayed from the nozzle and penetrates into the powder bed, one nucleus granule is produced (drop controlled nucleation) (Iveson et al., 2001a, Hapgood et al., 2002).
a.
b.
Figure II.4 Nucleation mechanism by (Schæfer and Mathiesen, 1996): a.
immersion mechanism; b. distribution mechanism
The nucleation mechanism depends on the drop size relative to the primary powder particles. According to Schæfer and Mathiesen (1996) two
different nucleation mechanisms can occur, as illustrated in Figure II.4, which firstly were proposed for melt agglomeration and later extended to wet granulation by Scott et al. (2000). If the droplets are larger compared to the size of the powder particles, the binder phase has a high viscosity and the impeller speed of granulator are low, nucleation will occur by immersion of the smaller particles into the larger drop and nuclei with saturated pores will be produced (see Figure II.4 (a.)). If the droplets are smaller compared to the size of the powder particles, the binder phase has a low viscosity and the impeller speed of granulator are high, nucleation will occur by distribution of the drops on the surface of the particles, which will then start to coalesce, and nuclei with air trapped inside will be developed. Therefore, a better distribution of the binder within the agglomerates can be obtained by the distribution mechanism (see Figure II.4 (b.)).
With regard to the wetting and nucleation phenomena, Litster et al. (2001) postulated that three nucleation regimes exist: drop controlled regime, mechanical dispersion regime and intermediate regime. Based on this idea, Hapgood (2000), Hapgood et al. (2002) and Hapgood et al. (2003) proposed a nucleation regime map (MRN), reported in Figure II.5.
Figure II.5 Nucleation Regime Map (MRN) (Hapgood et al., 2003)
The Nucleation Regime Map is based on two key parameters: the drop penetration time (𝑡𝑑𝑝), in comparison to circulation time of the process (𝑡𝑐), and the dimensionless spray flux (𝜓𝑎). In particular, in MRN the dimensionless spray flux is shown on the horizontal axis (axis y) and a magnitude (𝜏𝑝) attributable to ratio between drop penetration time and
circulation time is reported on the vertical axis (axis x).
The drop penetration time is the time taken for a drop of liquid to penetrate fully in the porous powder bed after its initial impact on surface and it is controlled by the formulation properties, as show in the eq. (II.4). In particular, it depends on both wetting thermodynamics, represented by the adhesion tension (𝛾𝑙𝑣· 𝑐𝑜𝑠𝜃), and the wetting kinetics, strongly affected by
13
the liquid viscosity (μ) and effective pore size (𝑅𝑒𝑓𝑓) of the powder bed. Moreover, it a function of the total volume of the droplets that are sprayed in the granulation section (𝑉𝑑) and of the surface porosity (𝜀𝑒𝑓𝑓), which may
differ from the bed porosity (Parikh, 2016).
𝑡𝑑𝑝= 1.35 · 𝑉𝑑 2 3 𝜀𝑒𝑓𝑓2 · µ 𝑅𝑒𝑓𝑓· 𝛾𝑙𝑣· cos θ (II.4)
The dimensionless spray flux is a measure of binder coverage on the powder surface and is defined by actual spray rate, or spray flux, in comparison to solids flux, or mixing rates. Litster et al. (2001) have quantified spray conditions as a function of process parameters, as shown in the eq. (II.5). In particular, in the spray zone, the drops sprayed by the nozzle at a given volumetric flow rate (𝑉̇) with an average drop size (𝑑𝑑) cover a certain projected area of powder per unit time.
This area of droplets is distributed over some spray area on the powder bed surface. Moreover, if is used a flat spray perpendicular to the direction of powder flow, the powder flux through the spray zone (𝐴̇) is simply by eq. (II.6), where v is the speed of the powder after spray and (𝑊) is the powder size after it has been wetted by the binder.
𝜓𝑎=
3 · 𝑉̇
2 · 𝑑𝑑· 𝐴̇ (II.5)
𝐴̇ = 𝑣 ∗ 𝑊 (II.6)
A high (𝜓𝑎) value indicates that the binder was added too fast compared to the speed of the powder flow. In this case, the sprayed droplets will tend to overlap on the surface of the powder bed, causing coalescence and a wider nuclei size distribution is obtained. Instead, a low (𝜓𝑎) value indicates that the ratio of powder flux to solution and the nuclei are swept out of the spray zone before being re-wet by another drop. Low values (𝜓𝑎<< 1) result in a well-dispersed binder where one a droplet tends to form one granule. However, low (𝜓𝑎) is a necessary but not sufficient a condition for drop controlled nucleation because the drop must also wet the powder and have a small penetration time (Parikh, 2016, Iveson et al., 2001a, Litster et al., 2001).
In drop controlled regime of the MRN, the nuclei size distribution is essentially controlled by the drop size distribution: each individual drop wets completely and quickly into the powder bed to form a single nuclei granule (Guigon et al., 2007). In mechanical dispersion regime the nuclei size distribution is independent of the drop size distribution: binder distribution occurs only by breakage of lumps or granules due to mechanical forces
within the powder bed (Guigon et al., 2007). In intermediate regime the nuclei size distribution is sensitive to formulation properties and operating parameters. This regime is intermediate between drop controlled and mechanical dispersion: some agglomeration does occur in or near the spray zone without complete caking or pooling. This is a difficult regime to control (Guigon et al., 2007).
II.2.2 Consolidation and growth
The last decade has seen a rapid advancement in the understanding of growth and consolidation of the granules, mechanisms that occur simultaneously to the process of wetting and nucleation in agitated wet granulation processes. These phenomena may begin with the injection of the liquid binder on the powder bed and terminate or when all the solution has been injected or when the granulation process is completed.
Granule growth occurs when material in the granulator collides and sticks together by coalescence or layering (see Figure II.6).
a. b.
Figure II.6 Granule growth: a. growth by coalescence; b. growth by
layering (Ennis et al., 2007)
The granule growth is traditionally referred to as coalescence when two large granules come together to form an entity with a largest size: the entity obtained has a volume equal to the sum of the volumes of the individual starting entities and its surface area is less to the sum of the surface areas of the individual entities. In particular, the coalescence occurs following the collision and consolidation of nuclei/granules deformable, provided that these then remain cohesive despite the cutting forces exercised by the impeller. Instead, it is termed layering when the sticking of fine material onto the surface of large pre-existing granules occurs: the layers increase the size of solid particles compared to the initial. Both the mixing of powder and binder and binder quantity contribute to the growth of the granule and to its consolidation. The mixing increases the probability of impact between the solid particulate and an increase in energy of mixing involves a greater consolidation of the granule. However, if the binder liquid is not introduced in sufficient quantity the growth is not promoted and the granule size is determined solely by the nucleation conditions. The distinction between these two mechanisms is arbitrary because it depends on the cut-off size used to demarcate fine from granular material (Iveson et al., 2001a).
15
As granules collide with other granules and are subjected to the action of mechanical moving parts of the equipment (blades or impellers), they gradually consolidate. The consolidation has a pronounced effect on granule properties. It reduces the granules size and porosity, increases their yield stress and also increases the pore saturation, which in turn increases granule plasticity and the availability of liquid at the granule surface. Therefore, the granules become harder, less deformable and more elastic with the consolidation.
Iveson and Litster (1998b) have proposed a granule growth regime map to seek describe the different growth behaviours exhibited by the granule on a their formulation properties basis (see Figure II.7).
Figure II.7 Growth Regime Map (GRM) (Iveson et al., 2001b)
The granules growth behaviour depends on two parameters: the maximum pore saturation and the granule deformation during impact. In particular, in growth regime map the maximum pore saturation is shown on the horizontal axis (axis y) and the Stokes deformation number, parameter attributable to granule deformation during impact is reported on the vertical axis (axis x).
The maximum pore saturation (𝑠𝑚𝑎𝑥) is a measure of the amount of liquid present in the pores inside the granules and it is determined by eq. (II.7), in which (w) is the liquid to solid mass ratio, (𝜌𝑠) is the solid particles density, (𝜌𝑙) is the liquid density and (𝜀𝑚𝑖𝑛) is the minimum porosity the
formulation reaches for the operating conditions set.
𝑠𝑚𝑎𝑥=
𝑤 · 𝜌𝑠· (1 − 𝜀𝑚𝑖𝑛)
𝜌𝑙· 𝜀𝑚𝑖𝑛 (II.7)
The amount of deformation during impact was characterised by the Stokes deformation number (𝑆𝑡𝑑𝑒𝑓). The Stokes deformation number is a measure of the ratio of impact kinetic energy to the plastic energy absorbed per unit strain and it is calculated by eq. (II.8). It takes into account both the